Article
Electrocatalytic Oxidation of Methanol: Study with Pt:Mo Dispersed Catalysts
Almir Oliveira Neto, Joelma Perez, Wilhelmin T. Napporn, Edson A. Ticianelli and Ernesto R. Gonzalez*
Instituto de Química de São Carlos, Universidade de São Paulo, CP 780 , 13560-970, São Carlos - SP, Brazil
A oxidação eletroquímica do metanol foi estudada sobre ligas de Pt:Mo dispersa em carbono, preparadas utilizando um método recentemente desenvolvido neste laboratório. Análises de EDX confirmaram que a redução simultânea dos sais precursores de Pt e Mo conduzem a presença destes metais nas composições nominais inicialmente calculadas. A adição de Mo sobre Pt causa um aumento da corrente de oxidação, mas não produz um efeito catalítico para oxidação do metanol. A partir dos dados de polarização em várias concentrações de metanol foram obtidos diagramas de Tafel que apresentaram duas inclinações. A técnica de espectroscopia de massa diferencial aplicada “on line” a um experimento voltamétrico foi utilizada para investigar a distribuição de produtos e intermediários formados na oxidação de metanol.
The electrocatalytic oxidation of methanol on Pt:Mo dispersed on carbon prepared using an alternative method recently developed in this laboratory was investigated. The EDX analysis confirmed that the simultaneous reduction of the precursor salts of Pt and Mo leads to the presence of these materials at the nominal composition initially calculated. The addition of Mo to Pt causes an increase of the oxidation currents, but does not improve the catalytic effect for methanol oxidation. Tafel plots for various methanol concentrations showed the presence of two slopes. On line differential electrochemical mass spectrometry (DEMS) was used to investigate the distribution of products and intermediates in methanol oxidation.
Keywords: methanol electrooxidation, Pt:Mo dispersed catalysts
Printed in Brazil 0103 - 5053 $6.00+0.00
Introduction
The direct methanol fuel cell is an attractive alternative solution for electrochemical energy conversion applied to transportation. Liquid and gas feed systems have been pro-posed for this fuel cell operating with a solid polymer electro-lyte membrane1. Most of the investigations made during the
last years in this fuel cell are directed to the elucidation of the mechanism of the methanol oxidation, in order to find the best catalysts (low cost, good activity) for this reaction2.
Kinetic studies on Pt indicate the formation of poisoning intermediates, which can be only oxidized at high potentials. Many binary Pt based electrocatalysts have been proposed for this reaction: Pt:Ru3-11, Pt:W12, Pt:Sn12, Pt:Mo12-14 and
ternary systems12,15-16, and seem to give better results than
Pt alone.
The present work presents a study the electroactivity of Pt:Mo dispersed catalysts towards the oxidation of metha-nol in acid medium. Various catalyst compositions were
elaborated and the activities investigated in the presence of different methanol concentrations. For the first time, dis-persed catalysts on carbon have been investigated by means of differential electrochemical mass spectrometry (DEMS), with the aim to characterize the possible products and inter-mediates of the methanol oxidation reaction.
Experimental
The catalysts of Pt:Mo dispersed on carbon were ob-tained by simultaneous reduction of Pt and Mo compounds (H2PtCl6 and (NH)4Mo7O24.4H2O) by a method elaborated in this laboratory17. The atomic composition of the samples
was confirmed by EDX. All the samples contained 20% in weight of catalyst dispersed on carbon and the nominal com-positions were: 60:40, 70:30, 80:20, 90:10 and 100:0 of Pt:Mo. The electrochemical characterization of the catalysts was performed using cyclic voltammetry and polarization techniques at room temperature. Thin porous coating electrodes (TPC)18,19
employed in these studies were prepared by mixing the catalyst powders with a dilute suspension (2% w/w) of PTFE emulsion (DuPont TM30) and applied into the recess of a conventional rotating electrode. A conventional one compartment
chemical glass cell was used in the electrochemical experi-ments. A platinum foil served as the counter electrode and a reversible hydrogen as the reference electrode (RHE). All the experiments were carried out in 0.5 mol L-1 H2SO4 solution
(Merck). Methanol was Merck p.a. grade and water distilled and purified in a Milli-Q (Millipore) system. The electrolytes were saturated with purified N2 gas. All the experiments were conducted at room temperature (25±1°C).
X-ray diffraction (XRD) analyses were carried out with a X-URD, Carl Zeiss X-ray system.
For the DEMS measurements a computer controlled qua-drupole mass spectrometer, MKS Instruments, was used. De-tails on this technique are given elsewhere20-22. The method
allows the on-line detection of volatile and gaseous products of electrochemical reactions during the application of a poten-tial scan. The electrochemical cell was constructed according to the principles described in Ref. 23. A reversible hydrogen and a platinum foil were used as reference and counter elec-trodes, respectively. The working electrode for the DEMS ex-periments was prepared by mixing the catalyst powders with a dilute suspension (1% w/w) of PTFE. This mixture was filtered and applied on a gold layer (1.13 cm2 area, 50 nm thickness)
prepared by sputtering gold onto a SCIMAT® membrane
(thickness 60 µm, mean pore size 0.17µm, 50% porosity).
Results and Discussion
After preparation, the dispersed Pt:Mo materials with various Pt:Mo ratios were characterised by EDX. These results are presented in Table 1. As seen in this Table, EDX analyses confirm the nominal composition of the samples. Figure 1 presents a comparison of the behaviour of the X-ray diffraction patterns of all catalysts prepared in this work with commercial E-Tek 75:25 Pt:Mo samples. The results confirm that the samples prepared here present the same structure than the E-Tek material. The differences in the peak intensities are due to differences on the alloy concen-trations (the E-Tek powder contains 30 % Pt:Mo/C and the samples prepared in this work 20 % Pt:Mo/C).
show evidences of both Pt and Mo features, although the Pt-Hupd region is not as well defined as on Pt/C or Pt:Ru/C
electrodes19,24. Also, no evidences of the
Pt-hydro-ox-ides features are seen. When the Mo contents increases from 10 to 40 atom percent, there is a progressive increase in the currents at potentials corresponding to the Pt-Hupd
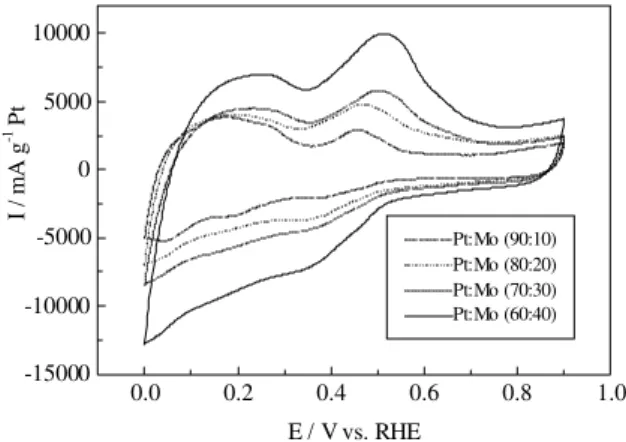
and double layer regions of platinum. A redox process is also apparent at around 0.5 V, with a current intensity that increases with the Mo content.
Table 1 . Composition analysis by EDX of the TPC Pt:Mo lectrodes.
Nominal composition EDX EDX
of the TPC Pt:Mo catalysts Pt content Mo content
Atom % Atom %
90 : 10 8 6 1 4
80 : 20 7 7 2 3
70 : 30 6 7 3 3
60 : 40 6 3 3 7
40 60 80 100
0 50
100 0:100 Pt:Mo
2θ (Degree) 0
500 80:20 Pt:Mo E-Tek30%
0
500 60:40 Pt:Mo
0
500 70:30 Pt:Mo
In
te
n
sity
(c
p
s)
0 500
80:20 Pt:Mo 0
500
90:10 Pt:Mo
Figure 1. X-ray diffraction results for Pt:Mo catalysts. The com-positions are indicated in the Figure.
0.0 0.2 0.4 0.6 0.8 1.0
-15000 -10000 -5000 0 5000 10000
Pt:Mo (90:10) Pt:Mo (80:20) Pt:Mo (70:30) Pt:Mo (60:40)
I / mA
g
-1 Pt
E / V vs. RHE
Figure 2. Cyclic voltammograms for the different Pt:Mo electrodes recorded in 0.5 mol L-1 H
2SO4 at 10 mV s-1. Currents were normalized with respect to the Pt loading.
The increase of current in the double layer region was observed previously with Pt:Ru catalysts24 and various
in-vestigations have shown that it is due to the formation of Figure 2 shows cyclic voltammograms in absence of
methanol, recorded at 10 mV s-1 in 0.5 mol L-1 H2SO4, for
adsorbed oxygenated species. This may also be the case for the Pt:Mo catalysts, for which X-ray absorption spectros-copy have indicated the presence of oxide layers for poten-tials as low as 0.1 V25. The presence of the redox process at
about 0.5 V has been reported previously for other Pt:Mo catalysts25 and it is most likely due to a Mo4+↔Mo6+
oxi-dation state change of Mo.
Figure 3 presents cyclic voltammetric curves for metha-nol oxidation on the carbon supported Pt:Mo (70:30) cata-lyst. Comparing the curves for the different methanol con-centrations, only small differences are observed in the po-tentials corresponding to the onset of the methanol oxida-tion reacoxida-tion. Figure 4 illustrates the corresponding log(j) vs. E curves (Tafel diagrams) obtained from the cathodic scans of the cyclic voltammograms with the currents normalised with respect to the Pt loading. In this case, the results show a potential shift of ca. 25 mV to more positive potentials for the methanol concentration of 1 mol L-1 in comparison with
the concentration of 0.1 mol L-1, indicating a smaller
cata-lytic effect at the higher concentration. In all cases the Tafel diagrams present two slopes: ~35 mV dec-1 in the low
cur-rent region and ~240 mV dec-1 in the high current region.
0,0 0,2 0,4 0,6 0,8 1,0
-10 0 10 20
30 Pt : Mo (70:30)
0.1 mol L-1 CH3OH
0.5 mol L-1 CH3OH
1.0 mol L-1 CH3OH
I /mA
E / V vs. RHE
Figure 3. Cyclic voltammograms for Pt:Mo (70:30) recorded in 0.5 mol L-1 H2SO4 at 10 mV s-1 in the presence of various methanol concentrations.
Cyclic voltammograms in the presence of 0.1 mol L-1 and
1.0 mol L-1 CH3OH in 0.5 mol L-1 H2SO4 for different Pt:Mo
electrodes at 10 mV s-1 are presented in Figure 5. In both
cases the currents were normalised with respect to the Pt load-ing in the electrode. In Figure 6, the results correspondload-ing to the anodic scan for 0.1 mol L-1 methanol were re-plotted after
subtraction of the background responses due to the Pt:Mo features in the supporting electrolyte (Figure 2).
In Figure 5, it is seen that the carbon supported 60: 40 Pt:Mo catalyst gives the higher current density for the oxidation processes in both methanol concentrations.
1,5 2,0 2,5 3,0 3,5 4,0 4,5
0,5 0,6 0,7 0,8
0,9 Pt : Mo (70:30)
0.1 mol L-1 CH3OH
0.5 mol L-1 CH3OH
1.0 mol L-1 CH3OH
E
/
V
vs
. R
H
E
Log ( I/mA g-1 Pt)
Figure 4. Log(j) vs. E curves for the oxidation of methanol on Pt:Mo (70:30) catalysts in 0.5 mol L-1 H2SO4. Currents were normalized with respect to the Pt loading.
However, after correction of background currents (Figure 6), it is observed that the onset of methanol oxidation starts at lower potentials for the catalyst with 90:10 Pt:Mo atomic ratio, demonstrating the higher catalytic activity of this material compared with the other compositions. Figure 6 also shows a comparison of the behaviour of the catalysts used in this work with that of a commercial E-Tek 75:25 Pt:Mo sample. These results clearly show that the commercial sample presents a lower catalytic effect than the catalysts prepared here with alternative method. Figure 7 presents Tafel diagrams comparing the per-formance of the several Pt:Mo catalysts with that of pure Pt for methanol oxidation. For all Pt:Mo catalysts, much smaller currents were observed below 0.55/0.6 V, when compared with the response of pure Pt. However, for more positive potentials, the activity of the Pt:Mo catalysts increases with the amount of Mo and the electrodes with 70:30 and 60:40 Pt:Mo present higher oxidation currents than those of the catalyst containing Pt alone. This behaviour indicates that the Pt:Mo catalysts are not much effective for the initiation of the methanol oxidation reac-tion. However, the increase of the oxidation currents at high potentials denotes a better tolerance to the poison-ing species (mainly CO) formed as intermediates in the oxidation of methanol. This observation is in agreement with the improvements in CO tolerance observed with Pt:Mo/C for the hydrogen oxidation reaction at 85°C with 100 ppm CO in the H2 gas, which show a two to three fold enhancement in performance compared to the current state of the art Pt:Ru/C anodes26.
As in the case of Figure 4, the results in Figure 7 show that for the Pt:Mo catalysts the Tafel plots present two slopes, that is, 30-35 mV dec-1 at low current densities and 230-250
com-0,0 0,2 0,4 0,6 0,8 1,0 -10000
0 10000 20000
0.1 mol L-1 CH3OH
Pt : Mo (90:10) Pt : Mo (80:20) Pt : Mo (70:30) Pt : Mo (60:40)
I /
m
A
g
-1 Pt
E / V vs. RHE
0,0 0,2 0,4 0,6 0,8 1,0
-10000 0 10000 20000 30000
40000 1.0 mol L
-1
CH3OH
Pt : Mo (90:10) Pt : Mo (80:20) Pt : Mo (70:30) Pt : Mo (60:40)
I /
m
A
g
-1 Pt
E / V vs. RHE
Figure 5. Cyclic voltammograms for the different Pt:Mo electrodes recorded in 0.5 mol L-1 H2SO4 at 10 mV s-1 in the presence of 0.1 mol L- 1 CH3OH and 1.0 mol L- 1 CH3OH. Currents were normalized with respect to the Pt loading.
0,0 0,2 0,4 0,6 0,8 1,0
0 4000 8000 12000 16000
0.1 mol L-1 CH 3OH
Pt : Mo (90:10) Pt : Mo (80:20) Pt : Mo (70:30) Pt : Mo (60:40) Etek (75:25)
I / mA
g
-1 Pt
E / V vs. RHE
Figure 6. Comparison of current density vs. potential curves of the different TPC Pt:Mo electrodes and for a commercial E-Tek sample in 0.5 mol L-1 H2SO4 in the presence of 0.1 mol L-1 CH3OH. Currents were corrected for the background response and normalized with respect to the Pt loading.
pare these data with those in pure Pt for which the slopes are 100 and 270 mV dec-1. The first value for this catalyst is the
same as that reported in the literature26. The different values
1,0 2,0 3,0 4,0
0,4 0,5 0,6 0,7
0.1 mol L-1
CH3OH Pt : Mo (90:10)
Pt : Mo (80:20) Pt : Mo (70:30) Pt : Mo (60:40) Pt
E
/
V v
s
.R
HE
Log(I/mA g-1 Pt)
Figure 7. Comparison of Tafel plots for the different TPC electrodes: Pt:Mo and Pt, in 0.5 mol L-1 H2SO4 in the presence of 0.1 M CH3OH.
of the first Tafel slope for the Pt and Pt:Mo catalysts can be related to effects of the particle size and distribution, be-cause these have been shown to play important roles in the mechanism of oxidation of small organic molecules such as methanol, formic acid and carbon monoxide27. However, in
the present case, it is more probable that the differences are related to the formation of oxygenated species at low poten-tials. The presence of these species is evident for Pt:Mo but they are completely absent for pure Pt.
Figure 8 presents the results of DEMS analysis for the oxidation of methanol in the 60:40 Pt:Mo catalyst. The mass signals (m/z) analysed were: 44 (CO2), 46 (HCOOH) and 60
(HCOOCH3). It is seen that all mass signals start to in-crease at about 0.55 V, corresponding to the same potential
0.0 0.2 0.4 0.6 0.8 1.0 0.00E+000
1.00E-015 2.00E-015
m/z=60
E / V vs. ERH
0.0 0.2 0.4 0.6 0.8 1.0 0.00E+000
5.00E-015 1.00E-014
m/z=46
0.0 0.2 0.4 0.6 0.8 1.0 0.00E+000
1.00E-012
2.00E-012 m/z=44
ma
ss
i
n
te
n
sit
y
where the methanol oxidation starts to take place (Figs. 3 and 5). It is observed that the m/z = 44 signal is considerable larger than the others, indicating that the most important product in the oxidation of methanol is CO2. This behaviour
is consistent with the DEMS analysis of other non-dispersed catalysts11,22. Further studies of the oxidation of methanol
are under way to compare the product distributions for Pt:Mo/C with those of other dispersed catalysts.
Conclusion
The experiments described in this work show that the alternative preparation method of the Pt:Mo catalysts leads to active materials. The addition of Mo to Pt causes a signifi-cant increase of the oxidation currents, but does not show a catalytic effect for the initiation of methanol oxidation.
The DEMS experiments, performed for the first time in this type of catalyst, show the formation of CO2, formic acid and methyl formate at potentials that coincide with the increase of the electrochemical oxidation currents.
Acknowledgments
The authors wish to thank Fundação de Amparo à Pesqui-sa do Estado de São Paulo (FAPESP, Proc 97/02471-6 and 95/ 0692-0), Conselho Nacional de Desenvolvimento Científico e Tecnológico (CNPq), Fundação Coordenação de Aperfeiçoa-mento de Pessoal de Nível Superior (CAPES) and Financiadora de Estudos e Projetos (FINEP), for financial supports.
References
1. Hogarth, M.; Christensen, P.; Hamnett, A.; Shukla, A.
J. Power Sources1997, 69, 113; ibid 1997, 69, 125. 2. Beden, B.; Lamy, C.; Leger, J. -M. Modern Aspects of
Electrochemistry, Bockris, J. O’M.; Conway, B. E.; White, R. E. (Eds.), Vol. 22, Plenum, New York, 1992, p. 97. 3. Perez, J.; Tanaka, A. A.; Gonzalez, E. R.; Ticianelli, E.
A. J. Electrochem. Soc.1994, 141, 431.
4. Perez, J.; Gonzalez, E. R.; Ticianelli, E. A. Electrochim. Acta1998, 44, 1329.
5. Gasteiger, H.; Markovic, N. M.; Ross, P. N.;. Cairns, E. J. J. Electrochem. Soc. 1994, 141, 1796.
6. Kauranen, P. S.; Skou, E.; Munk, J. J. Electroanal. Chem. 1996, 404, 1.
7. Napporn, W. T.; Laborde, H.; Leger, J. -M.; Lamy, C.
J. Electroanal Chem. 1996, 404, 153.
8. Kabbabi, A.; Faure, R.; Durand, R.; Beden, B.; Hahn, F.; Leger, J. -M.; Lamy, C. J. Electroanal Chem. 1998,
444, 41.
9. Pandya, K.; Anderson, E. B.; Sayers, D. E.; O’Grady, W. E. J. Phys. IV France1997, 7, C2-995.
10. Chrzanowski, W.; Wieckowski, A. Langmuir1998,
14, 1967.
11. Krausa, M.; Vielstich, W. J. Electroanal. Chem. 1994,
379, 307.
12. Gotz, M.; Went, H. Electrochim. Acta1998, 43, 3637. 13. Grgur, B. N.; Zhuang, G.; Markovic, N. M.; Ross, P. N.
Phys. Chem. 1997, 101, 3910.
14. Grgur, B. N.; Markovic, N. M.; Ross Jr., P. N. Phys. Chem.1998, 102, 2494.
15. Hamnett, A.; Kennedy, B. Electrochim. Acta, 1988,
33, 1613.
16. Liu, R.; Triantafillou, K.; Liu, L.; Pu, C.; Smith, C.; Smotkin, S. J. Electrochem. Soc.1997, 44, 148. 17. Gonzalez, E. R.; Ticianelli, E. A.; Pinheiro, A. L. N.; Perez,
J. Brazilian Patent I.N.P.I. – SP n0 00321, 1997, Brazil.
18. Perez, J.; Tanaka, A. A.; Gonzalez, E. R.; Ticianelli, E. A. J. Electrochem. Soc.1994, 141, 431.
19. Perez, J.; Gonzalez, E. R.; Ticianelli, E. A. Electrochim. Acta1998, 44, 1329.
20. Wolter, O.; Heitbaum, J.; Ber. Bunsenges Phys. Chem.
1984, 88, 6.
21. Bittins-Cattaneo, B.; Cattaneo, E.; Königshoven, P.; Vielstich, W. Electroanalytical Chemistry – A Series of Advances, vol. 17, Ed. A. J. Bard, Marcel Dekker, Inc., New York, 1991, 181.
22. Iúdice de Souza, J. P.; Iwasita, T.; Nart, F. C.; Vielstich, W. J. Applied Electrochem.1999, 30, 43.
23. Ianniello, R.; Schmidt, V. M.; Ber. Bunsenges Phys. Chem.1995, 99, 83.
24. Oliveira Neto, A.; Perez, J.; Napporn, W. T.; Ticianelli, E. A.; Gonzalez, E. R. 194th Meeting of Electrochemical
Society, Boston (USA) November 1998, Abstract no 1092.
25. Murkerjee, S.; Lee, S. J.; Ticianelli, E. A. Q.; McBreen, J.;Grgur, B. N.; Markovic, N.M.; Ross, P.N.; Giallom-bardop, J.R.; De Castro, E.S. Electrochem. and Solid-State Letters1999, 2, 12.
26. Gloaguen, F.; Napporn, W. T.; Croissant, M. -J.; Berthelot, S.; Leger, J. -M.; Lamy, C.; Srinivasan, S. 191st meeting of Electrochem. Soc., Montreal (Canada)
May 4-9 1997.
27. Gloaguen, F.; Léger, J. -M.; Lamy, C. J. Appl. Electrochem. 1997, 27, 1052.
Received: May 31, 1999