Article
Redox Behavior of Crosslinked Polyaniline Films
José E. P. da Silva, Susana I. C. de Torresi and Marcia L. A. Temperini*
Departamento de Química Fundamental, Instituto de Química, Universidade de São Paulo, CP 26077, 05599-970, São Paulo - SP, Brazil.
Os processos redox da polianilina dopada secundariamente e dopada primariamente pré-aquecidas (150oC, 6-12 horas) foram investigados pela espectroscopia Raman ressonante in-situ. Os espectros Raman do polímero dopado secundariamente mostram uma maior dependência com o aumento do potencial do que o polímero dopado primariamente pré-aquecido. Estes diferentes comportamentos foram atribuídos à presença de diferentes graus de ligações cruzadas nos polímeros. A presença de diferentes quantidades de ligações cruzadas foi confirmada por análise termogravimétrica, espectroscopia UV-vis e voltametria cíclica.
The redox processes of secondarily doped and the pre-heated primarily doped polyaniline (150oC, 6-12 h) were investigated by in-situ resonance Raman spectroscopy. Raman spectra of
secondarily doped polymer is more dependent on potential than those observed in the pre-heated primarily doped polymer. These different behaviors were attributed to the presence of different degree of crosslinking in the polymers. The presence of different amounts of crosslinking was confirmed by thermogravimetric analysis, UV-vis spectroscopy and cyclic voltammetry.
Keywords: polyaniline, Resonance Raman, crosslinking.
J. Braz. Chem. Soc., Vol. 11, No. 1, 91-94, 2000. Printed in Brazil
c 2000 Soc. Bras. Química 0103 - 5053 $6.00+0.00
Introduction
The secondary doping effect1,2 phenomenologically consists in the treatment of a polymer already doped with a functionalized organic acid with an organic solvent, for ex-ample, polyaniline doped with camphorsulfonic acid dis-solved in m-cresol.
This effect produces an increase in the conductivity (~ 400 S.cm-1) of polyaniline and conformational changes in the polymeric chains from the coil form to the expanded one. It was observed by ex-situ Raman spectroscopy and ESR3 that in addition to a conformational effect a conversion of quinoid structures into semiquinoid ones also occurs in the same oxidation state of polyaniline (emeraldine form), a pro-cess called internal redox reaction4. Scherr et al5 and Rodrigue et al6 have shown that temperature produces crosslinked poly-mers leading to the formation of structures others than radical ones, such as ternary cycled nitrogen producing “phenazine like” segments. Recently, Resonance Raman Spectroscopy7,8 has confirmed the presence of cyclized nitrogen structures in heated samples and the Raman bands at ca. 574, 1380 and 1630
e-mail: [email protected]
Presented at the XI Simpósio Brasileiro de Eletroquímica e Eletroana-lítica, Maragogi - AL, Brazil, April 5-9, 1999. Guest editor: Luis Alberto Avaca.
cm-1 have been assigned to these segments. Moreover, the same bands were observed in the Raman spectrum of polyaniline treated with Fenton’s reagent, a well known reticulating agent. The aim of this work is to follow the electrochemical behavior of secondarily doped and pre-heated primarily doped polyaniline by cyclic voltammetry and resonance Raman spectroscopy. A more detailed explanation of the convertion of structures in the emeraldine form (internal re-dox reaction) and other processes occurring in the polymers heated or treated with m-cresol are presented.
Experimental
Polyaniline (PANI) was electrochemically deposited onto gold electrode by cyclic voltammetry from a 0.5 mol L-1 aniline + 1.0 mol L-1 camphorsulfonic acid (HCSA) solution by lin-ear potential sweeps between -0.2 V and +0.75 V at 50 mV s -1. A platinum wire was used as a counter electrode and all
potentials are referred to the Ag/AgCl electrode. The heat-ing of the films was carried out in an oven at a constant temperature of 150oC for 6-12 h.
92 Silva et.al J. Braz. Chem. Soc
of the polymer into m-cresol (1.1 mg mL-1 ). The mixture was treated in ultrasonic bath for 10 h and then filtered in order to obtain a limpid solution. Films were prepared from this solu-tion by “dip coating” technique onto gold electrode.
In-situ Resonance Raman spectra with 632.8 nm exciting radiation (He-Ne laser, Spectra Physics, mod 127) were re-corded in a Renishaw Raman Imaging (System 3000) contain-ing an Olympus metallurgical microscope and a CCD detector. Laser power was always kept below 0.7 mW at the sample to avoid sample degradation. The potential was fixed for each spectrum with an EG&G PAR 362 potentiostat/galvanostat.
Thermogravimetric analyses were performed in a Hi-ResTM TGA 2950 (T.A. Instruments).
UV-vis spectra were performed with a Hewlett-Packard 8453 diode array spectrophotometer.
Results and Discussion
Figure 1 shows ex-situ Raman spectra of different prepa-rations of polyaniline. Figures 1A and 1B show Raman spec-tra of primarily and secondarily doped polyaniline, respec-tively. Results indicate an increase in the relative intensity of bands assigned to semiquinoid structures3,9-13 at 1330, 1510 and 1600 cm-1, with the corresponding decrease of the rela-tive intensity of the bands assigned to quinoid structures 3,9-13 at 1480 and 1580 cm-1. Another fact that can be observed
from the figures is the appearance of bands located at 574, 1380 and 1643 cm-1 for secondarily doped samples. These latter bands are more intense in the Raman spectra of pre-heated primarily doped polyaniline (Figure 1C).
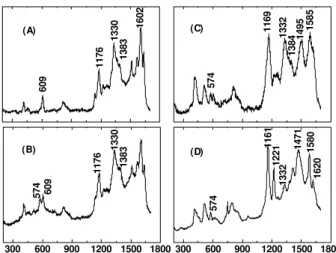
Figure 2 shows the in-situ Raman spectra of second-arily doped polyaniline. In the -0.2 V and +0.2 V potential range, the resonance Raman spectra are similar to those obtained ex-situ for the same polymer in the emeraldine form. At +0.5 V the oxidation of secondarily doped poly-mer begins to change the Raman spectra. A decrease in the relative intensity of the bands at 574, 1176, 1330, 1380, 1602 and 1633 cm-1 can be observed. This fact indicates the diminution of reduced and semi-oxidized segments which occurs together with the increase of the bands as-signed to oxidized structures and located at 1169, 1495, 1585 and 1620 cm-1. The Raman spectrum obtained at +0.75 V indicates that the polymer is completely oxidized pre-senting the characteristic bands of pernigraniline form and the loss of the band at 1330 cm-1, corresponding to polaronic structures.
300 600 900 1200 1500 1800
0 0 0 0 0 0
1587
1484
1251
1339
1321
1165
588
(A)
300 600 900 1200 1500 1800
0 00 00 00 00 00 00
1384 1510
1634
1595
1338
1174
605
573
(B)
300 600 900 1200 1500 1800
0 0 0 0 0
Raman Shift/ cm-1
1646
1599
1512
1389
1336
1172
609
574
(C)
Figure 1. Resonance Raman spectra of: (A) primarily doped PANI/ CSA, (B) secondarily doped PANI/CSA/ m-cresol and (C) pre-heated primarily doped PANI/CSA (150 °C, 12 h). λ0 = 632.8 nm.
3 00 6 00 9 00 1 200 1 500 1 800
00 00 00 00 00 00 00
1602
(A)
1383
1330
1176
609
300 600 900 1200 1500 1800 00
00 00 00 00
(B)
1383
1330
1176
609
574
3 00 6 00 9 00 1 200 1 500 1 800
6 00 8 00 1 000 1 200 1 400 1 600
(C) 1585
1495
1384
1332
1169
574
300 600 900 1200 1500 1800
2 000 4 000 6 000 8 000 1 000 0
Raman Shift/ cm-1 (D)
1620
1580
1471
1332
1221
1161
574
Figure 2. In-situ Resonance Raman spectra of secondarily doped PANI/CSA/m-cresol film as a function of potential: (A) –0.2 V, (B) +0.2 V, (C) +0.5 V and (D) +0.75 V. λ0 = 632.8 nm.
Vol. 11, No. 1, 2000 Crosslinked Polyaniline 93
formation of this type of structures has already been sug-gested by Gènies et al14 to explain the reticulation reaction of polyaniline films.
300 600 900 1200 1500 1800
1
176
1
383
1
339
60
9
57
4
(B)
300 600 900 1200 1500 1800 300
400 500 600 700 800 900 1000
1
169
1
392
1
339
57
4
(D)
300 600 900 1200 1500 1800
Raman Shift/ cm-1
1
176
1
383
1
339
60
9
(A)
300 600 900 1200 1500 1800
500 600 700 800 900 1000 1100 1200
1
169
1
383
1
339
61
1
57
4
(C)
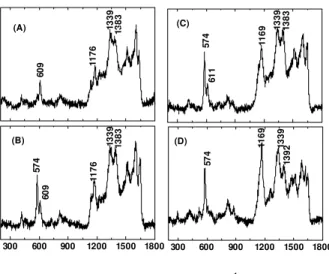
Figure 3. In-situ Resonance Raman spectra of pre-heated primarily doped PANI/CSA film as a function of potential: (A) –0.2 V, (B) +0.3 V, (C) +0.5 V and (D) +0.75 V. λ0 = 632.8 nm.
These facts can be explained considering that the pre-heated primarily doped polymer has a more crosslinked structure than secondarily doped PANI, hindering the ef-fective oxidation of the polymer.
The presence of different degrees of crosslinking in different preparations was confirmed by TGA analyses7. The amount of residue, in the case of pre-heated polyaniline (53%), is greater than those obtained for primarily (26%) and secondarily doped (37%) samples, showing that the polymer is more reticulated15.
Results obtained by in-situ UV-vis spectroscopy and cyclic voltammetry also put in evidence the less effective oxidation process in pre-heated doped polyaniline. UV-vis spectra of primarily doped polyaniline (Figure 4) show that at +0.75V, the band centered at 675 nm, in the pre-heated primarily doped polyaniline spectra (Figure 5), is observed at 730 nm. This small shift towards lower energies at positive potentials indicates a greater stabilization of the emeraldine form in the polymer, which is consistent with the results obtained by in-situ resonance Raman spectroscopy.
Voltammetric data (Figure 6) show a diminution of charge for the pre-heated polymer due to the formation of crosslinking. From the voltammograms the electric charge can be calcu-lated giving 95.4 mC cm-2 for primarily doped polyaniline and 75.6 mC cm-2 for the pre-heated samples. These bonds make the polymer less porous, hindering the oxidation because the swelling of the polymer by the electrolyte is lower and conse-quently, the anion exchange is reduced.
400 500 600 700 800 900
0.10 0.15 0.20 0.25
675
(F)
(E) (D) (C)
(B)
(A)
A
b
so
rb
an
ce
λ/ nm
Figure 4. In-situ UV-vis spectra of primarily doped PANI/CSA film as a function of potential: (A) –0.2 V, (B) +0.2 V, (C) +0.3 V, (D) +0.5 V, (E) +0.75 V and (F) +0.8 V.
400 500 600 700 800 900
0.10 0.15 0.20 0.25
73
0
(F) (E )
(D ) (C )
(B ) (A)
A
b
so
rb
a
n
ce
λ/ nm
Figure 5. In-situ UV-vis spectra of pre-heated primarily doped PANI/CSA film as a function of potential: (A) –0.2 V, (B) +0.2 V, (C) +0.3 V, (D) +0.5 V, (E) +0.75 V and (F) +0.8 V.
0.0 0.4 0.8
-1.0 0.0 1.0
I
/ m
A
E / V(SCE)
Figure 6. Cyclic voltammograms of polyaniline: ( ) before heating
and (...) after heating at 150°C for 12 h.
On the other hand, another effect to be considered is the change of conductivity due to the diminution of conju-gation produced by crosslinking.
94 Silva et.al J. Braz. Chem. Soc
Conclusions
In situ Resonance Raman and electrochemical results are consistent with the formation of crosslinked structures in polyaniline films when heated. The less effective oxidation process of heated films, even at high positive potentials, is due to a low swelling of the polymer by the electrolyte. This is corroborated by the observation of the Raman bands corresponding to polaronic segments at high positive potentials, in contrast to that observed for non-heated samples, in which the increase of Raman bands of imine structures were observed. Electrochemical data have shown that thermal treatment leads to a stabilization of the emeraldine form due to the depolarization of the leucoemeraldine-emeraldine couple, together with the polarization of the emeraldine-pernigraniline redox process.
Acknowledgements
Authors are indebted to Brazilian Agencies FAPESP (Procs. N° 98/07624-8 and 98/15686-3), CNPq and CAPES.
References
1. MacDiarmid, A. G.; Epstein, A. J. Synth. Met.1994,
65, 103.
2. Xia, Y.; Wiesinger, J. M.; MacDiarmid, A. G. Chem. Mater. 1995, 7, 443.
3. Silva, J. E. P.; Torresi, S. I. C.; Temperini, M. L. A.
Electrochim. Acta 1999, 44, 1887.
4. Stafström, S.; Bredas, J. L.; Epstein, A. J.; Woo, H. S.; Tanner, D. B.; Huang, H. S.; MacDiarmid, A. G. Phys. Rev. Lett.1987, 59, 1464.
5. Scherr, E. M.; MacDiarmid, A. G.; Manohar, S. K.; Masters, J. G.; Sun, Y.; Tang, X.; Druy, M. A.; Glatkowski, P. J.; Cajipe, V. B.; Fisher, J. E.; Cromack, K. R.; Jozefowicz, M. E.; Ginder, J. M.; McCall, R. P.; Epstein, A. J. Synth. Met.1991, 41, 735.
6. Rodrigue, D.; Riga, J.; Verbist, J. J. J. Chim. Phys. 1992,
89, 1209.
7. Silva, J. E. P. Master Thesis; Universidade de São Paulo 1999.
8. Silva, J. E. P.; Faria, D. L. A.; Torresi, S. I. C.; Temperini, M.L.A. Macromolecules 2000 (in press).
9. Louarn, G.; Lapkowski, M.; Quillard S.; Pron A.; Buisson, J. B.; Lefrant S. J. Phys. Chem.1996, 100, 6998. 10. Quillard, S.; Berrada K.; Louarn G.; Lapkowski, M.;
Lefrant S.; Pron, A. New. J. Chem.1995, 19, 365. 11. Sariciftci, N. S.; Kuzmany, H Synth. Met. 1987,
21,157.
12. Cochet, M; Corraze, B.; Quillard, S.; Buisson, J. P.; Lefrant, S.; Louarn, G. Synth. Met. 1997, 84, 757. 13. Furukawa, Y.; Hara, T.; Hyodo, Y.; Harada, I. Synth.
Met.1986, 16, 189.
14. Gènies, E. M.; Lapkowski, M.; Penneau, J. P. J. Electroanal. Chem., 1988,249, 97.
15. Wang, X. H.; Geng, Y. H.; Wang, L. X.; Jing, X.B.; Wang, F. S. Synth. Met. 1995, 69, 263.
Received: June 15, 1999