Temperature Dependent Structure of Low Index Copper
Surfaces Studied by Molecular Dynamics Simulation
F.J. Resende
1, V.E. Carvalho
1, B.V. Costa
1, and C.M.C. de Castilho
2(1) Departamento de F´ısica ICEX, Universidade Federal de Minas Gerais
Caixa Postal 702, 30123-970, Belo Horizonte, MG, Brazil
(2) Instituto de F´ısica, Universidade Federal da Bahia, Rua Bar˜ao de Geremoabo sn,
Campus Universit´ario da Federac¸ ˜ao, 40210-340, Salvador, BA, Brazil
Received on 6 January, 2004
The thermal behavior of the (010), (110) and (111) copper surfaces is studied by molecular dynamics simu-lation. We have used a many-body potential based on the tight-binding model in order to describe the Cu-Cu interaction. The calculations we have performed correspond to simulations in the temperature range between 600 and 1800 K. The observed order in the stability follows the same order as in the packing density, i. e., (110), (010) and (111). The (110) disorder results from anharmonic effects and by vacancy-adatom formation. On the other end, the (111) surface is very stable, and remains so up to temperatures of the order of the bulk melting point. The melting proceeds by a layer-by-layer mechanism.
1
Introduction
The thermal behavior of solid surfaces has raised a lot of attention in recent years as a result, in a large extent, of re-finements in either experimental or theoretical techniques. Low-energy electron diffraction (LEED) [1, 2], medium-energy ion scattering (MEIS) [3, 4, 5, 6] and X-ray diffrac-tion [7] are some of the experimental techniques well suited to the study of the structure of metallic surfaces and their behaviour as the temperature is varied [8]. These experi-ments indicate that quantities such as surface thermal ex-pansion, mean-square displacements and structural parame-ters often exhibit a behaviour which are “anomalous” when compared to the bulk one. These behaviours have been attributed to strong anharmonic vibrations of the atoms at the surface. This anharmonicity brings disorder to the sur-face, mainly at high temperatures [8, 9, 10]. These exper-imental techniques have been applied to study the copper (010), (110) and (111) surfaces. The results for the (110) face have shown an enhancement of the disorder for tem-peratures aboveT = 550Kand a roughening transition at TR= 870K[9] andTR = 1070K[10]. For the (010) face,
LEED experiments show an enhancement of the atoms vi-brational amplitude at the surface [11]. In the case of the (111) face, experimental studies by MEIS show an anoma-lous behaviour of the thermal expansion coefficient for tem-peratures above1000Kand an anisotropy of the vibrations at the surface, with the atoms vibrational amplitudes in the direction normal to the surface higher than those in the plane of the surface [12]. Numerical simulational methods, like Monte Carlo (Lattice-gas model and solid-on-solid model) and Molecular Dynamics (MD), have been used, with a rel-ative success, to study the structure and dynamics of the surfaces. The main ingredient of the MD approach is the
interatomic interaction potential. Realistic potentials, for metallic systems, have been available only during the past few years. Up to now, MD simulations, implemented with these potential models, have been made for Cu(110), us-ing the effective-medium theory (EMT) [13, 14] and the Embedded-atom method (EAM) [15]. For Cu(010), the Effective-medium theory (EMT) [16] was applied and for Cu(111) a tight-binding (TB) method in the second moment approximation was used [23]. A premelting phenomenon, driven by the vacancy-adatom mechanism, has been ob-served in simulations of the Cu(110) surface [13, 15]. The (111) face of copper, on the other hand, seems to be quite stable, and maintains the crystalline state until high temper-atures. In these studies, strong effects of the anharmonic vi-brations of the atoms at the surface have been also observed for Cu(110) [15]. The anharmonicity manifests itself as a larger thermal-expansion coefficient of the surface area and also as an anomalous increase in the vibrational amplitudes of the surface atoms. In these previous simulations, the an-harmonicity effects are less pronounced at (010) and (111) faces [16].
In this work we have studied the structure of the (110), (010) and (111) faces of copper, in the temperature range from 600up to1800K, by classical Molecular Dynamics simulation. With the purpose of directly comparing the behaviour of the different crystal faces, a task which is generally difficult if the comparison involves distinct sim-ulation approaches, we have employed comparable sample sizes and the same many-body potential, based on the tight-binding model, to describe the Cu-Cu interaction.
2
Simulation Method
Our simulation was carried out using molecular dynamics (MD). We have used a semi-empirical potential [17, 18, 19], based on the tight-binding method for the second moment approximation, in order to describe the attractive interatomic interaction, while a Born-Mayer-type interatomic repulsion was assumed. This potential model has given good results in previous MD calculations of bulk [18, 19] and surface [20, 21, 22, 23, 24, 25, 26] properties of transition metals. For a system with just one kind of atomic species, the total potential energy is given by
E=
N
i=1
N
j=1
Ae−p(ri,jr0 −1)−
N
j=1
ξ2e−2q(ri,jr0 −1)
.
(1) In this equation, indexesiandjstands for particles at posi-tionri andrj, respectively,N is the total number of
parti-cles,ri,j =|ri−rj|is the distance between atomsiandj
andr0 is the nearest-neighbour equilibrium distance in the
bulk metal. The parameters A,ξ,pandqare adjusted in order to reproduce the cohesive energy, the equilibrium con-dition (zero pressure at T= 0 K) and the elastic constants of the metal under consideration. For Cu-Cu we have used A = 0.0855eV,ξ = 1.224eV,p= 10.96,q= 2.278and R0 = 2.5562, according to ref.[42]. A cutoff is introduced
in the potential, so that it is possible to account for interac-tions up to the fifth nearest neighbours, as a route to acceler-ate the simulation process. Particles in the simulation move according Newton’s law and this generates a set of3N cou-pled equations of motion, which are simultaneously solved by increasing forward in time the physical state of the sys-tem and that is done in small time-steps of sizeδt= 10−14s.
To do that we have used Beeman’s method of integration [26, 27, 28, 29, 30, 31], which is a fourth order predictor-corrector scheme. To improve the integration procedure we have also used a Verlet table [26, 27, 28, 29, 30, 31].
0 200 400 600 800 1000 1200 1400 1600 1800 2000 T (K)
-3.2 -3.0 -2.8
ENERGY (eV/atom)
7 layers 4 layers
DINAMICA-MOLECULAR - POTENCIAL TIGHT-BINDING
Superficie: cobre fcc(010) 5 camadas (25x25) N=490 / Melting
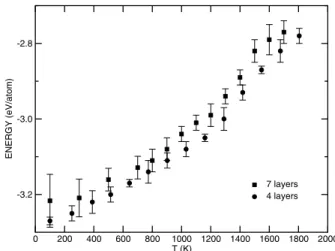
Figure 1. Total energy (per molecule) as a function of the temper-ature for systems with4(N≈400atoms) and7layers (N≈700 atoms) in the y direction and dimensions(L×L) = (25 ˚A×25 ˚A).
The copper substrate is composed by distributing N
par-ticles over a frozen layer in order to simulate the presence of the semi-rigid solid. Particles are then distributed around their equilibrium position, filling 4 layers in theydirection, which is the one perpendicular to the substrate. We also per-formed some simulations in a system with seven layers as a control procedure.
Periodic boundary conditions are used for the directions parallel to the substrate while an open condition is set for they direction. Once the temperature(T)of the system is fixed, a process of velocity renormalization is used to equi-librate the system by letting it to evolve for2×103δttime
steps. The system is assumed to be in equilibrium provided the deviations in the mean kinetic energy becomes less than
1%. With the aim of estimating the melting temperature of a slab, we have chosen, as a reference, the (010) surface. In Fig. 1 is presented the total energy (per molecule) as a func-tion of temperature for systems with4(N ≈ 400atoms) and7 layers (N ≈ 700atoms) in the y direction and sur-face dimensions of about (25 ˚A×25 ˚A). It is easy to see that the melting temperature (Tm) does not change very much as
the number of layers is varied; in both casesTm>1400K.
Thus, we have chosen to work with systems of4layers and N ≈400atoms, restricting our attention to temperatures in the range600Kto1100K, well bellow the estimated melt-ing point. In order to have reasonable statistics, our results correspond to averages over simulations of200psand6 in-dependent initial configurations.
3
Results
To evaluate the degree of disorder in the structure and how it is affected as a result of temperature variation, we have calculated the structural parameterλ, which is defined by [32]
λ= 1 2N
N
i=1
µ
coskµxµi, (2)
wherekµ correspond to the reciprocal-lattice vectors, (xµ i)
are the coordinates of the atomiin the plane parallel to the surface andNis the number of atoms in the plane. The value ofλis usually considered as an order parameter, being 1.0 in the case of a perfectly ordered layer at low temperature, approaching zero for a completely disordered layer.
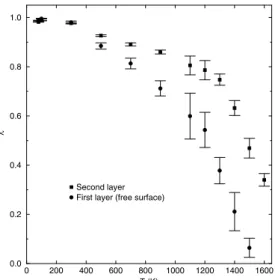
Figure 2 shows, as a function of temperature, the values ofλfor the first (free surface) layer and also for the sec-ond one, in case of the Cu(010) face. For low temperatures λ ≈ 1and, as the temperature arises, λtends to zero. As can be seen from this figure the values ofλfor the first layer are lower than those for the second layer and also go to zero faster. This behaviour is associated with a higher disorder in the surface layer, as compared with the second one, and it is a strong evidence of the surface premelting process. In this process, the melting of the material starts from the surface, with the formation of a thin liquid-like film at a temperature bellow the thermodynamical bulk melting pointTm. This
0 200 400 600 800 1000 1200 1400 1600 T (K)
0.0 0.2 0.4 0.6 0.8 1.0
λ
Surface: Cu(010) − 10x10x7
Second layer First layer (free surface)
Figure 2. Structural parameterλfor the first layer (free surface) and second layer of Cu(010) surface, as a function of temperature.
500 600 700 800 900 1000 1100 1200 T (K)
0.3 0.4 0.5 0.6 0.7 0.8 0.9 1 1.1
λ
Cu(010) Cu(110) Cu(111)
Order Parameter λ 10x10x4 - Primeira camada (superficie)
Figure 3. Structural parameterλfor the first layer of the (010), (110) and (111) faces of Cu, as a function of temperature.
500 600 700 800 900 1000 1100 1200 T (K)
0.3 0.4 0.5 0.6 0.7 0.8 0.9 1 1.1
λ
Cu(010) Cu(110) Cu(111)
10x10x4 - segunda camada
Figure 4. Structural parameterλcalculated for the second layer of the three low index faces of copper, as a function of temperature.
Figure 3 shows for comparison the parameterλas calcu-lated for Cu(010), Cu(110) and Cu(111) surfaces in the case of the first layer, whereas, in figure 4, the same is shown for the second layer. It is possible then to observe that the
surface stability follows the packing density order, i. e., the disorder is most pronounced on the (110) face, much weaker on the (100), and the face (111) behaves as a very well or-dered surface up toTm.
3.1
Vacancy-adatom Formation
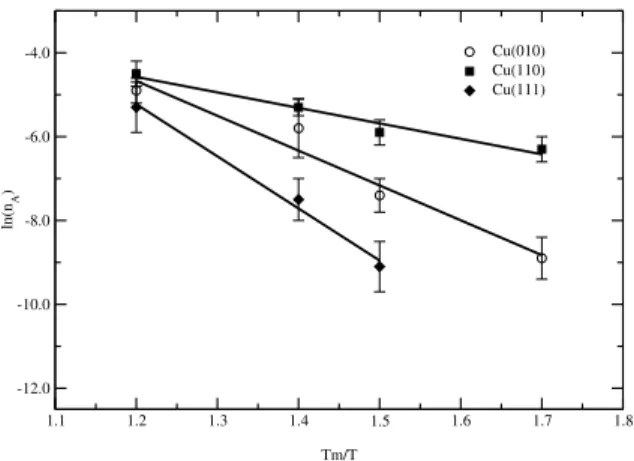
It has been observed in both theoretical and experimental studies that at elevated temperatures the thermal genera-tion of vacancy-adatom pairs, at the outermost surface layer, might be responsible for some of the disorder observed at the surface [13, 14, 15, 16, 23]. Vacancies at the surface have then an indirect effect on the order parameter, by in-ducing distortions in the surface region. In our simulations we have studied the vacancy-adatom formation by evalu-ating the layer occupation over the crystal surface at each time step in the temperature range from600to1100K. We have observed that on the (110) face, the formation of the adatom layer begins at around700K, whereas for the (010) and (111) faces the onset of the vacancy-adatom formation takes place at higher temperatures,800Kand900K, respec-tively. For the three explored faces, the adatom related va-cancies are mainly found in the first crystal layer. These observations are in agreement with other simulational stud-ies [13, 14, 15, 16, 23]. Figure 5 shows an Arrhenius plot for the adatom concentration. In this figure it has been in-cluded just the high-temperature points, where good statis-tics have been achieved. From the slope of the curves it is possible to derive the activation energy for adatom forma-tion as 0.43(6)eV, 0.9(1)eV and 1.4(1)eV for the (110), (010) and (111) faces, respectively. In Table I is presented the obtained results from this work as well as those from studies using molecular-dynamics (MD), the tight-binding method (TB) [23, 35], effective medium theory (EMT) [16] and embedded atom method (EAM) [36] and experimental studies of X-ray diffraction [37]. As can be seen from the table our results agree well with those from other works and Cu(111) is the face presenting the largest discrepancies.
Table I - Vacancy-adatom formation energies (eV) Cu(110) Cu(010) Cu(111) Reference
0.43(6) 0.9(1) 1.4(1) This work
0.35 - - [14]
- 1.16 2.21 [23]
0.30 - - [35]
0.39 0.86 1.92 [16]
0.31 0.71 1.69 [36]
0.27 - - [37]
3.2
Surface Relaxation
1.1 1.2 1.3 1.4 1.5 1.6 1.7 1.8
Tm/T -12.0
-10.0 -8.0 -6.0 -4.0
ln(n
A
)
Cu(010) Cu(110) Cu(111)
MOLECULAR-DYNAMICS TB - ADATOM FORMATION
Cu(010), Cu(110), Cu(111)
Figure 5. The logarithm of the adatom concentration nA as a function ofTm/T for the (110), (010), and (111) copper surfaces. Tm= 1400Kis the estimated melting temperature.
600 700 800 900 1000 1100
T (K) -6
-5 -4 -3 -2 -1 0 1 2 3 4 5 6
δ
d12
(%)
Cu(010) Cu(110) Cu(111)
Lattice Relaxation 10x10 with 4 Layers
Figure 6. The relaxation of the uppermost interlayer spacingd12
(in percentage of the bulk value) as a function of the temperature for (110), (010) and (111) faces.
on temperature and, in general, it is also affected by the par-ticular nature of the surface under consideration. For lay-ered systems, thermal expansion is directly observed in the dependence with temperature of the interlayer distance d. While the thermal expansion coefficient for the bulk shows only a weak temperature dependence, even at values ap-proaching melting, the situation is quite different for the surface. The reported results have shown that, in general, the thermal-expansion coefficient at the surface (αsurf ace)
is larger than that of the bulk (αbulk)[38, 39, 16]. We have
calculated the surface relaxation using the difference be-tween the mean distance of the first and second layers of the crystal. As it is shown in Fig. 6, the calculated sur-face relaxationδd12for the faces (010), (110) and (111) as
a function of the temperature, defined as the percent change of the inter-layer spacing with respect to the value of the bulk lattice parameter at each temperature. It should be ex-pected that, in this kind of plot, if the thermal expansion coefficient for the surface is the same as that of the bulk, these data will fall on a horizontal line parallel to that corre-sponding to the bulk. In fact, the curves seem to be nearly
linear for the three faces although showing different slopes. This is an indication of an occurrence of different thermal expansion coefficient for the three surfaces, which can be calculated from aδd12×T plot. We have carried out this
calculation and foundα010 = 87(6)×10−6K−1 ( about
five timesαbulk), α110 = 108(9)×10−6K−1 (six times
αbulk) andα111 = 32(6)×10−6K−1 (two timesα
bulk).
Analysing figure 6, the first point that may be mentioned is that the expansion of the three surfaces shows a behaviour similar to that found in other theoretical and experimental works, that is, an occurrence of a contraction at low temper-ature and an expansion at higher tempertemper-atures [38, 39]. Fur-thermore, for the Cu(010) surface in the temperature range T ∼500−700K, the results from MEIS experiments, re-ported by Fowler [40], show a contraction (δd12=−2.3%)
that is very close to our result. On the other hand, results from MD using EAM, show a contraction of0.8%forT = 600K[41]. Using EMT, the results of Hakkinen and Man-ninen [16] show contraction between0.3%and0.6%for a temperature below400K and an expansion between0.3%
and1%for a temperature between600Kand900K. In this same study, a linear behaviour of the relaxation curves with a thermal-expansion coefficientα= 38(8)×10−6K−1, was
observed i.e., twiceαbulk. In another MD simulation, a
con-traction of0.6%forT = 1000K was found while above T = 1000K a strong expansion was observed [23]. The thermal-expansion coefficient, in the low temperature range, is37(5)×10−6K−1, i. e., twiceα
bulk. For higher
tempera-tures, aboveT = 1000K,αgrows up to five timesαbulk. In
our simulations we have calculated a thermal-expansion co-efficient ofα010= 87(6)×10−6K−1, i. e., five timesαbulk.
For the (110) copper face the results obtained by Hakkinen and Manninen show a strong contraction of4%, for low tem-peratures, and for high temperatures this contraction goes to1%atT = 900K[16]. The relaxation curve, in these studies, is approximately linear withα = 32(5)×10−6,
i. e. , twiceαbulk. A similar behaviour is observed in
MD simulations using TB [35], with a contraction of2%
atT = 400K and of0.4%atT = 1000K. Experimental results by LEED and X-rays, at low temperatures, show con-tractions up to6%. The MD study of Ditlevsen et al [14] us-ing EMT shows a significant expansion of the surface inter-layer distance. For low temperatures the curve is linear, with a thermal-expansion coefficient tree timesαbulk. At high
temperatures the surface inter-layer distance rises dramati-cally. This is attributed to anharmonic effects. The value of the thermal-expansion coefficient for (110) face, obtained in the present work, isα110= 108(9)×10−6K−1, that is six
times the bulk valueαbulk.
MEIS experimental studies on the (111) copper surface [12] show a contraction of the first inter-layer distance of1%
10(5)×10−6, very close to the bulk value. This behaviour is
also observed in the results obtained by Hakkinen and Man-ninen and the contraction at low temperatures being nearly
1%. Again, the thermal-expansion coefficient is very close to the bulk value. In our study we have observed a linear behavior and the thermal-expansion coefficient obtained is α111= 32(6)×10−6K−1, i. e., approximately twiceα
bulk.
So, the results for the thermal behaviour of the interlayer dis-tance of the three surfaces investigated in this work show an overall qualitative agreement with the reported results from other techniques.
3.3
Conclusions
In the study of the thermal behavior of the (010), (110) and (111) copper surfaces by molecular dynamics (MD) simu-lations, we have observed that the order in the stability fol-lows the same order as in the packing density. The (110) face presents a considerable disorder at relatively low tem-peratures (Fig. 3), probably due to anharmonic effects, what is evidenced by the surface thermal-expansion coefficient higher than the bulk value (Fig. 6). AboveT = 700K the onset of the vacancy-adatom formation takes place. This observation, although do not represent results of direct mea-surements, shows that roughening and premelting transi-tions, as observed in other works [16], are possible in the Cu(110) surface. The (010) copper face presents disorder only for temperatures aboveT = 800K and, at this tem-perature, it is observed the beginning of the vacancy-adatom formation. In this surface, the anharmonic effects are also present, with a surface thermal-expansion coefficient higher than the bulk value. The (111) surface is ordered up to high temperatures and presents no significant vacancy-adatom pairs formation, with a surface thermal-expansion coeffi-cient only two times that bulk value, i. e., the presence of only weak anharmonic effects. We have not observed an anomalous behaviour of the thermal-expansion coefficient on these faces. These results show qualitative agreement with previous theoretical and experimental studies.
Financial support from the Brazilian agencies CNPq, CAPES, FAPEMIG and CIAM-02 49.0101/03-8 (CNPq) are gratefully acknowledged.
References
[1] E. A. Soares, V. B. Nascimento, V. E. Carvalho, C. M. C. de Castilho, A. V. de Carvalho, R. Toomes, and D. P. Woodruff, Surf. Sci.419, 89 (1999).
[2] E. A. Soares, G. S. Leatherman, R. D. Diehel, and M. A. Van Hove, Surf. Sci.468, 129 (2000).
[3] B.W. Busch and T. Gustafsson, Surf. Sci.407, 7 (1998).
[4] G. Bracco, M. Canepa, P. Cantini, F. Fossa, L. Mattera, S. Terreni, and D. Truffelli, Surf. Sci.269/270, 61 (1992).
[5] G. Bracco, A. Pizzorno, and R. Tatarek, Surf. Sci.377/379, 94 (1997).
[6] L. Pedemonte, G. Bracco, R. Tatarek, M. Aschoff, K. Br¨uning, and W. Heiland, Surf. Sci.482-485, 1457 (2001).
[7] G. Helgesen, D. Gibbs, A. P. Badddorf, D. M. Zehner, and S. G. J. Mochrie, Phys. Rev. B48, 15320 (1993).
[8] D. Gorse, J. Lapuloulade, Surf. Sci.162, 847 (1985).
[9] S. G. J. Mocrie, Phys. Rev. Lett.59, 304 (1987).
[10] P. Zeppenfeld, et al. Phys. Rev. Lett.62, 63 (1989).
[11] G. Armand, et al., Europhys. Letters.3, 1113 (1987).
[12] K. H. Chae, H. C. Lu, and T. Gustafsson Phys. Rev. B54, 14082 (1996).
[13] H. Hakkinen, J. Merikoski, Phys. Rev. lett.70, 2451 (1993).
[14] P. D. Ditlevsen, et al. Phys. Rev. B44, 13002 (1993).
[15] M. S. Daw and M. I. Baskes. Phys. Rev. B29, 6443 (1984); M. Foiles, M. I. Baskes and M. S. Daw, Phys. Rev. B33, 7983 (1986).
[16] H. Hakkinen and M. Manninen Phys. Rev. B46, 1725 (1992).
[17] D. Tomanek, A. A. Aligia, and C. A. Balseiro, Phys. Rev. B 32, 5051 (1985).
[18] Carlo Massobrio, V. Pontikis, and G. Martin, Phys. Rev. Lett. 62, 1142 (1989).
[19] F. Willaime and Carlo Massobrio, Phys. Rev. Lett.63, 2244 1989).
[20] K. -D. Shiang et al, Surf. Sci.301, 136 (1994).
[21] N. I. Papanicolaou et al, Surf. Sci.337, L819 (1995).
[22] G. A. Evangelakis, N. I. Papanicolaou , Surf. Sci.347, 376 (1996).
[23] G. C. Kallinteris et al, Surf. Sci.369, 185 (1996).
[24] G. A. Evangelakis et al, Surf. Sci.394, 185 (1997).
[25] N. Levanov et al, Surf. Sci.400, 54 (1998).
[26] F. J. Resende and B.V. Costa, Surf. Sci.481, 54 (2001).
[27] M. P. Allen and D. J. Tildesley,Computer Simulation of Liq-uids, Oxford Science Publications, New York (1992).
[28] D. C. Rapaport,The Art of Molecular Dynamics Simulation, Cambridge University Press, New York (1997).
[29] P. Z. Coura and B.V. Costa, Int. J. Mod. Phys. C 9, 857 (1998).
[30] P. Z. Coura, O. N. Mesquita, and B.V.Costa, Phys. Rev. B59, 3408 (1999).
[31] F. J. Resende and B.V.Costa, Phys. Rev. B61, 12697 (2000).
[32] C. P. Toh, C. K. Ong, and F. Ercolessi, Phys. Rev. B50, 17507 (1994).
[33] D. Passerone, F. Ercolessi, F. Celestini, and E. Tosatti Surf. Rev. Lett.6, 5, 663 (1999).
[34] Ngoc-Thanh Vu and D. B. Jack, Surf. Rev. Lett. 6,5, 683(1999).
[35] G. A. Evangelakis, D. G. Papageorgiou, G. C. Kallinteris, Ch. E. Lekka, and N. I. Papanicolaou, Vacuum50, 165 (1998).
[36] M. Karimi et al, Phys. Rev. B52, 5364 (1995).
[37] H. Durr, R. Shneider, Phys. Rev. B43, 12187 (1991).
[38] B. W. Bush and T. Gustafsson, Surf. Science. 6, 5, 683 (1999).
[39] Q. T. Jiang, P. Fenter, and T. Gustafsson, Phys. Rev. B44, 5773 (1991).
[40] D. E. Fowler, J. V. Barth, and T. Gustafsson Phys. Rev. B52, 2117 (1995).
[41] Liqiu Yang, Talat S. Rahman, and Murray S. Daw, Phys. Rev. B44, 13725 (1991).