Printed in Brazil - ©2007 Sociedade Brasileira de Química 0103 - 5053 $6.00+0.00
ArticleArticleArticleArticleArticle
*e-mail: [email protected]
Elucidation of Chiral Recognition Mechanism of
α
α
α
α
α
-Amino Acids using Ligand
Exchange High Performance Liquid Chromatography
Jaqueline D. Senra,a,b Luiz Fernando B. Malta,a Patricia M. N. Ceva-Antunes,a Rodrigo J. Corrêa*,a and O. A. C. Antunesa,b
a
Instituto de Química, UFRJ, CT Bloco A 641, Cidade Universitária, 21941-590 Rio de Janeiro-RJ, Brazil
b
Núcleo de Pesquisas de Produtos Naturais, UFRJ, CCS Bloco H, Cidade Universitária, 21941-590 Rio de Janeiro-RJ, Brazil
A técnica de HPLC por troca de ligante foi utilizada para a separação de racematos de amino ácidos com cadeia lateral alifática. Para tanto, o seletor quiral escolhido foi o complexo de Cu(II) combinado com a L-fenilalananina. Os resultados mostram que o primeiro enanciômero a eluir foi a forma D, seguido da forma L. Segundo o conceito de interação de 3 pontos, foi proposto um mecanismo de reconhecimento quiral, no qual não há evidências de mudança de configuração após a formação dos complexos pseudo-homo e heteroquiral. Cálculos DFT-B3LYP para energia e espectro vibracional confirmaram a viabilidade deste mecanismo, pois mostram a que a configuração trans do complexo homoquiral é mais estável do que a forma cis.
Ligand exchange HPLC technique was applied to resolve chiral separation of aliphatic side chain aminoacid racemates. Chiral selector was copper L-phenylalaninate (II) and the results showed the elution of D enantiomer followed by L form. Considering the 3-point interaction concept, a mechanism of chiral recognition was proposed, in which no change of configuration would follow the formation of pseudo-homochiral and heterochiral complexes. To prove the reliability of this mechanism, the trans configuration of homochiral complex had to be more stable than the cis form, which was confirmed by DFT-B3LYP calculation in gas phase. The infrared frequencies were also calculated and the comparison with the subtracted and deconvoluted spectrum of the in-solution complex also pointed to the presence of the trans diasteroisomer.
Keywords: α-amino acids, L-phenylalanine, ligand exchange chromatography, ab initio
molecular orbital calculations, fourier self-deconvolution
Introduction
Chiral separation has become an important and fascinating research field in the separation sciences since it was discovered that the chirality of molecules greatly affects their bioactivity. It has also been recognized that
the analytical separation of α-amino acid enantiomers
is of importance in research from the synthetic point of view up to the understanding of the origin of life. Recently separation scientists have focused their attention on the development of enantioseparation methods for α-amino acids in extraterrestrial exploration1
and in situ analysis in space missions.2 It is to be expected that the study on chirality, such as asymmetric synthesis and chiral separation, will play a more and more important role in life sciences, the pharmaceutical industry and other fields in the near future.
High Performance Liquid Chromatography (HPLC) has been one of the most important and flexible analytical tool in routine separations. However, the high costs of chiral columns and relatively short lifetime have lead to search resources such as the use of chiral additives added to mobile phase, which makes the use of achiral reversed phase material possible.
α J. Braz. Chem. Soc.
in 1970 by Davankov and widely used for the enantioseparation of compounds such as amino acids,
hydroxy acids and peptides.3,4 Based on the ligand
exchange principle, chiral resolution is possible due to the transient formation of a pair of diastereomers, pseudo-homochiral and pseudo-heterochiral complexes, with different chemical properties and consequently different retentivities in the mobile phase.5-13
Our previous publication14 reported the successful study of three chiral selectors: L-proline, L-hydroxy-proline and N,N-dimethyl-L-phenylalanine combined with Cu(II) ion in the mobile phase for the enantioseparations
of some α-amino acids, with the elution order of D
followed by L, using RP (Reversed Phase)-HPLC. In order to determine the preferable configuration of the diastereoisomeric complex (Figure 1), it was carried out for both isomers a theoretical study of structure optimization and infrared spectra simulation in the 100-600 cm-1 range, which corresponds to the bands assigned as metal-ligand vibrations. This was done to corroborate the mechanism proposed for the chiral recognition process, according to the concept of the 3-point interaction.15-17
The aim of the present work is, therefore, to investigate the previous hypothesis about the mechanism of chiral recognition, studying the enantioseparation of valine, alanine, methionine and leucine optical isomers by using Ligand Exchange Liquid Chromatography with L-phenylalanine as the chiral selector and copper (II) as the central cation.
Results and Discussion
General chromatographic results
The enantiosselectivities (α) and retention factors (k) were obtained for all racemic mixtures (Table 1). According to the α values obtained, all racemic mixtures were resolved, with D eluting before L (Figure 2).
From these results, it is proposed the mechanism for the chiral recognition. In the lack of derivatization, the chiral liquid chromatography presume the formation of diastereoisomeric complexes, through ligand exchange, which is constrained by differences between equilibrium constants and rates of the ligand exchange reactions. When both of these factors are favoured chiral recognition happens. At this point, is important to emphasize the hydrophobic interactions in the stationary phase, which contribute decisively on selectivity.
The observed elution behaviour can give information about the chiral recognition mechanism. It shows that the L enantiomer is held tighter through
Table 1. Retention factors and enantioselectivity using L-phenylalanine as chiral selector in the mobile phasea
Water 5%(v/v) MeOH 15%(v/v) MeOH
α-amino acid kD kL α kD kL α kD kL α
Alanine (Ala) 0.18 0.26 1.44
Valine (Val) 0.61 1.03 1.69
Leucine (Leu) 1.00 1.18 1.18
Methionine(Met) 0.61 0.71 1.16
aAnalysis conditions: column SUPELCOSIL LC-C18-DB; eluent, 1 mmol L-1 Cu(OAc)
2 and 2 mmol L
-1 of the chiral selector, resulting pH = 5, flow rate, 1.0
mL min-1.
Figure 2. Enantioseparations of α-amino acids using Cu(II)-L-phenyla-lanine as chiral selector.
the stationary phase than the D form. This can be explained in terms of the possible different complex structures present in solution. Complex structures with R groups pointed “up” would interact better with the stationary phase than those pointed to opposite sides (Figure 3).
Then, the following situations are possible to happen:
i) homochiral trans complex present in the mobile phase exchanges with L and D enantiomers, with greater retention of the L form, which does reproduce the experimental data; ii) homochiral cis complex present in the mobile phase exchanges with L and D enantiomers, with greater retention of the D form, which does not reproduce the experimental data.
These situations are related to structures with both R groups pointed “up” when the L and D forms are involved in the pseudo-homo and heterochiral complex formation, respectively (Figure 4). Then, to reproduce the
chromatographic data, the homochiral trans complex
must be more stable than the cis form. The main
assumption here is that the R group does not influence the metal-ligand configuration. Therefore, the ligand exchange is not followed by a configuration change.
Experimental-theoretical study
An early study by Jackovitz and coworkers18,19
investigated similar complexes and their infrared spectra in the solid state and proposed the trans stereochemistry as the most stable. This model was exposed in our previous work of chiral recognition.14
In order to examine what configuration is thermo-dynamically favored, we have carried out theoretical studies with the two possible homochiral complex structures.
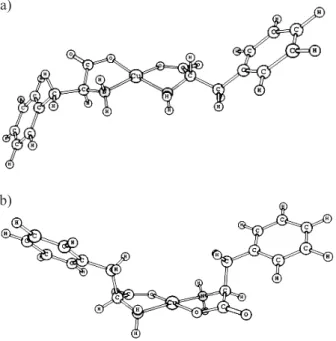
DFT-B3LYP calculation was carried out for the cis and trans isomers in order to obtain their relative stabilities. From the structure optimization (Figure 5), the energy values for both diasteroisomers were used to evaluate the population quotient given by the Boltzmann distribution law:
RT E
trans cis
e N
N −Δ
=
where Ntrans and Ncis are the numbers of trans and cis complexes; ΔE = Ecis-Etrans, where Etrans and Ecis are:
–1304.457 and–1304.437 Hartrees, respectively; R =
8.3145 Joule mol-1 k-1; and T = 298 K. The energy barrier,
ΔE, between the forms is of 52.0 kJ mol-1. This gives a population quotient with largeness order of 10-10. It means that in-solution the homochiral complex is mostly the trans
diasteroisomer.
Figure 3. Scheme of C18 stationary phase interaction with (a) pseudo-homochiral and (b) heterochiral complexes.
α J. Braz. Chem. Soc.
Table 2. Comparison between the observed and calculated vibrational frequencies (cm-1) obtained by ab initio DFT/B3LYP calculation (predicted vibrational
frequencies at the level 6-31G which have been scaled by a single factor of 0.9614 ) of the trans-Cu(L-Phe)2
Mode assignment Experimental Theoretical
ν/(cm–1) ν/(cm–1) %
δ (C2C1C6) + δ (COO–) + δ (NC
aCb) 588 584 0.7
ρ (NH2) + δ (COO–) + ν (C
a-C1) + δ (CCC) ring+ δ (NCaCb) 578 1.7
o.p.(Cring-H) + δ (NCaC1) + τ (NH2) 530 9.9
o.p. (Cring-H) + δ (NCaC1) + τ (NH2) 523 11.0
o.p. (Cring-H) + ν (Cu-N)asym + δ (NCaCb) + ρ (NH2) + ω (COO–) 459 475 3.5
o.p. (Cring-H) + δ (NCaC1) + ω (COO-) 472 2.8
ν (Cu-N)asym 452 1.5
ρ (HCaN) + ν (Cu-N)asym + ρ (COO–) 434 432 0.5
o.p. (Cring-H) 418 406 2.9
406 2.9
ν (Cu-N)asym + ν (Cu-O)asym 395 402 1.8
ρ (CH2) + ω (COO–) 369 352 4.6
ρ (CH2) + ρ (HCaN) + ρ (COO–) + δ (C
aNCu) 349 350 0.3
ρ (NH2) + ρ (CH2) + δ (CaCbC1) 342 2.0
ρ (NH2) + ω (CuNCa) 324 330 1.9
ρ (NH2) + ρ (CH2) + τ (CbCaN) 298 300 0.7
ν (Cu-N)asym + ν (Cu-O)sym 270 284 5.2
δ (OCuN) + ρ (CH2) 249 250 0.4
o.p. (C1-Cb) + ρ (CH2) 206 226 9.7
ω (OCuO) + ω (NCuN) + o.p. (C1-Cb) 197 4.4
ω (COO–) + ρ (NH
2) + ω (NCaCb) 190 7.8
ω (OCuO) + ω (NCuN) 187 186 0.5
Mean % = 3.5
I = intensities (in Debye units). Approximate description of assignments: ν→ stretching; δ→ bending; ω→ wagging; ρ→ rocking; sym → symmetric; asym → asymetric; i.p. → in-plane; o.p. → out-of-plane; C1 → substituted ring carbon.
Figure 5. Optimized structures of the homochiral complex [Cu(L-C18H20N2O4)2] in the (a) cis; and (b) trans configurations.
a)
b)
Theoretical IR spectra were generated together with the structure optimization process. Both complex confi-gurations have the same symmetry point group, C2, hence the number of bands given by each calculation was the
same. Both forms showed very similar spectra, and those were compared to experimental data obtained in the 100-600 cm-1 interval (Table 2 and 3). The experimental spectra was obtained using an aqueous solution of
Cu(L-Phe)2. This signal was subtracted from those of the
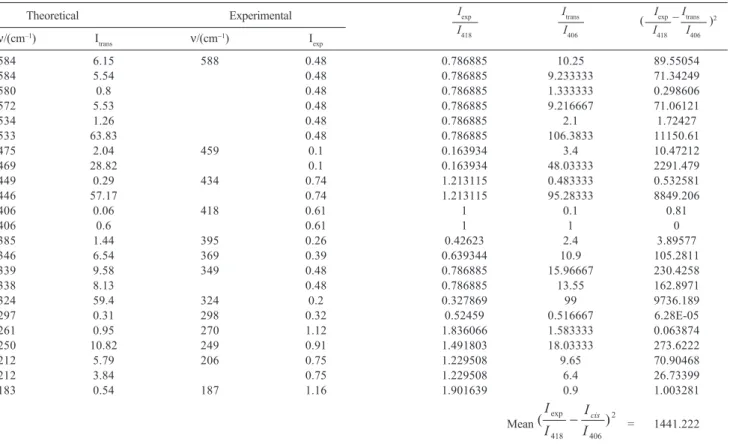
precursors, and the result was submitted to Fourier self-deconvolution. We applied this process in our previous study20 and the assignment was successfull. Table 2 and 3 show that the correlation produced mean discrepancies of 3-4% for both complex forms, which is a good agreement. To determine which form was present in aqueous media, band intensities of the experimental spectrum
were compared to those calculated for cis and trans
complexes (Tables 4 and 5). As a reference value of intensity, it was chosen a band assigned as only ligand mode, i.e., the highest intensity out-of-plane mode of phenyl C-H, at 406 cm-1. This band is localized at 418
cm-1 in the experimental spectrum. To identify which
calculated spectra had major agreement with the
experimental one, the quotient
406 I
or Icis trans
was compared
to
418 exp
I I
as showed in the last right column of Tables 4
( )2 Table 4. Comparison between intensity quotients of experimental and theoretical trans spectra
Theoretical Experimental Iexp Itrans Iexp _ Itrans
ν/(cm−1) I
trans ν/(cm
−1) I
exp
I418 I406 I418 _ I406
584 10.14 588 0.48 0.786885 7.140845 40.37281
578 1.80 0.48 0.786885 1.267606 0.231092
530 40.44 0.48 0.786885 28.47887 766.8462
523 16.55 0.48 0.786885 11.65493 118.1144
475 21.04 459 0.10 0.163934 14.8169 214.7094
472 7.32 0.10 0.163934 5.15493 24.91003
452 24.61 0.10 0.163934 17.33099 294.7077
432 0.61 434 0.74 1.213115 0.429577 0.613931
406 1.42 418 0.61 1 1 0
406 0.45 0.61 1 0.316901 0.466624
402 55.38 395 0.26 0.42623 39 1487.936
352 2.85 369 0.39 0.639344 2.007042 1.870598
350 11.83 349 0.48 0.786885 8.330986 56.91345
342 0.16 324 0.20 0.327869 0.112676 0.046308
330 1.30 0.20 0.327869 0.915493 0.345302
300 18.43 298 0.32 0.52459 12.97887 155.1092
284 0.38 270 1.12 1.836066 0.267606 2.460067
250 0.2 249 0.91 1.491803 0.140845 1.825088
226 0.64 206 0.75 1.229508 0.450704 0.606536
197 22.08 0.75 1.229508 15.5493 205.0563
190 5.21 0.75 1.229508 3.669014 5.951189
186 0.38 187 1.16 1.901639 0.267606 2.670066
Mean 2
406 418 exp
) (
I I
I I
trans
− = 153.7165 Table 3. Comparison between the observed and calculated vibrational frequencies (cm-1) obtained by ab initio DFT/B3LYP calculation (predicted vibrational
frequencies at the level 6-31G which have been scaled by a single factor of 0.9614 ) of the cis-Cu(L-Phe)2
Mode assignment Experimental Theoretical
ν/(cm-1) ν/(cm-1) %
ρ (NH2) + ω (COO–) + δ (C
2CbCa) + o.p. (Cring-H) 588 584 0.7
ρ (NH2) + δ (COO–) + δ (C
2C1C6) + i.p. (C-H) 584 0.7
ρ (NH2) + ω (COO–) + δ (C
2C1C6) 580 1.4
δ (CbCaN) + δ (COO–) + δ (C
2C1C6) + ν (Cu-O)asym 572 2.7
o.p. (Cring-H) + δ (CaCN) + ρ (NH2) 534 9.2
o.p. (Cring-H) + δ (NH2) 533 9.4
+ δ (CaCN) + δ (CaCO) + ν (Cu-O)asym + ν (Cu-N)asym
o.p. (Cring-H) + ν (Cu-N)sym + ρ (COO–) 459 475 3.5
o.p. (Cring-H) + ν (Cu-N)asym + ρ (COO–) 469 2.2
o.p. (Cring-H) + ν (Cu-N)sym + ρ (NH2) 434 449 3.4
o.p. (Cring-H) + τ (HCaN) + ν (Cu-N)asym 446 2.8
+ ν (CuO)asym
o.p. (Cring-H) 418 406 2.9
406 2.9
o.p. (Cring-H) + ν (Cu-O)sym + ν (Cu-N)sym + ω (COO–) + ρ (COO–) 395 385 2.5
ρ (CH2) + ω (C2CbCa) + ρ (COO–) + ν (Cu-O)
sym + + ν (Cu-N)sym 369 346 6.2
ρ (CH2) + ρ (NH2) + ω (C1CbCa) 349 339 2.9
ρ (CH2) + ρ (NH2) + ω (C1CbCa) + ω (COO–) + + ν (Cu-O)
asym 338 1.8
o.p. (Cring-H) + ρ (CH2) + ρ (CaCbN) 324 324 2.4
ρ (CH2) + ρ (NH2) + ω (CaCbN) + ν (Cu-O)sym 298 297 0.3
o.p. (Cring-H) + ρ (CH2) + ρ (NH2) + ω (COO–) 270 261 3.4
o.p. (Cring-H) + ρ (CH2) + ρ (NH2) 249 250 0.4
δ (C1CbCa) + τ (CH2) 206 212 212 2.9
2.9
ω (OCuO) + ω (NCuN) 187 183 2.1
Mean % = 3.1
α J. Braz. Chem. Soc.
lower than that for the cis form (Tables 4 and 5). Hence this result corroborated the energy result of DFT calculation in gas phase, which gave the trans isomer as the most stable.
Experimental
Chemicals
DL-alanine, DL-valine, DL-leucine, DL-methionine and L-phenylalanine were obtained from Sigma (St. Louis, MO, USA); methanol (HPLC-grade) was from Tedia Brasil (Rio de Janeiro, RJ, Brazil); cooper(II) acetate was from Merck (Darmstadt, Germany).
Instrumentation
A Shimadzu LC-10AS high performance liquid chromatograph (Shimadzu, Japan), equipped with a Rheodyne model 7125 injection valve, was used and
coupled to a Supelcosil LC-C18 DB column (250 mm ×
4.6 mm), from Supelco (Bellefonte, PA, USA), with 5 µm particle size and 10 nm pore diameter. Photometric detection was used at 254 nm (variable wavelenght UV detector Shimadzu SPD-10AV).
Water was purified with an Ultra Pure
System-Milli-Q Plus from MilliporeTM (Bedford, MA, USA).
Sample preparation for HPLC analysis
Racemic mixtures
Aqueous solutions of the enantiomeric mixtures
and of the L and D-isomers of the α-amino acids were
prepared with a final concentration of 0.5 mg mL-1.
These solutions were filtered through an Iso-Disc
N-34 nylon membrane (0.45 µm × 3 mm) from Supelco
and analysed several times. In order to determine the column void time, it was used a solution of sodium nitrate, whichgave tM = 3.4 min.
Preparation of the chiral mobile phase
L-phenylalanine (2 mmol L-1) and Cu(CH
3COO)2 (1
mmol L-1) were dissolved in Milli-Q water or Milli-Q
water/methanol. The final measured pH was 5.0. These solutions were filtered through Nylon 66 membranes (0.2
mm × 47 mm) from Supelco. The system was equilibrated
with the mobile phase until the detector base line was stabilized and, therefore, zeroed.
FTIR characterization
Homochiral complex of copper with L-phenylalanine,
Cu(L-Phe)2, was obtained in solution by mixing of
Table 5. Comparison between intensity quotients of experimental and theoretical cis spectra
Theoretical Experimental Iexp Itrans Iexp _ Itrans
ν/(cm–1) I
trans ν/(cm
−1) I
exp
I418 I406 I418 _ I406
584 6.15 588 0.48 0.786885 10.25 89.55054
584 5.54 0.48 0.786885 9.233333 71.34249
580 0.8 0.48 0.786885 1.333333 0.298606
572 5.53 0.48 0.786885 9.216667 71.06121
534 1.26 0.48 0.786885 2.1 1.72427
533 63.83 0.48 0.786885 106.3833 11150.61
475 2.04 459 0.1 0.163934 3.4 10.47212
469 28.82 0.1 0.163934 48.03333 2291.479
449 0.29 434 0.74 1.213115 0.483333 0.532581
446 57.17 0.74 1.213115 95.28333 8849.206
406 0.06 418 0.61 1 0.1 0.81
406 0.6 0.61 1 1 0
385 1.44 395 0.26 0.42623 2.4 3.89577
346 6.54 369 0.39 0.639344 10.9 105.2811
339 9.58 349 0.48 0.786885 15.96667 230.4258
338 8.13 0.48 0.786885 13.55 162.8971
324 59.4 324 0.2 0.327869 99 9736.189
297 0.31 298 0.32 0.52459 0.516667 6.28E-05
261 0.95 270 1.12 1.836066 1.583333 0.063874
250 10.82 249 0.91 1.491803 18.03333 273.6222
212 5.79 206 0.75 1.229508 9.65 70.90468
212 3.84 0.75 1.229508 6.4 26.73399
183 0.54 187 1.16 1.901639 0.9 1.003281
Mean 2
406 418 exp
) (
I I
I I
cis
precursors in order to give a 2 mmol L-1 solution. This complex was analyzed by FTIR spectroscopy using a
Nicolet Magma spectrometer with 4 cm-1 resolution and
64 accumulations. The sample was prepared by producing a liquid film in polyethylene matrix. Data were collected
in the 100-600 cm-1 interval. The FTIR signal of the
complex was subtracted from those of copper acetate and L-phenylalanine solutions in appropriate concentrations and deconvoluted. OMNIC XP software was used for this mathematical procedure.
Ab initio calculation
The geometry of several species were optimized using standard techniques21 and, after geometry optimization, vibrational analysis was performed and the resulting geometries were checked with respect of being true minima on the potential energy surface, as shown by the absence of imaginary frequencies. Geometrical, energetic and vibrational analysis were performed at UB3LYP/6-311++G**//UB3LYP/6-31G* with lanl2dz for Cu atom.
Conclusions
The previously proposed mechanism of chiral recognition of α-aminoacids using copper L-phenylalaninate (II) chiral selector in ligand exchange HPLC was supported by DFT-B3LYP calculation carried out in the present paper. To justify
the experimental elutions of D and L forms, the trans
configuration of homochiral complex had to be more stable
than the cis form. This was confirmed by DFT-B3LYP
calculation in gas phase, with an energy barrier of 8.7189 ×
10–20 Joule per molecule between the two forms. The infrared frequencies were also calculated and the comparison by means of intensity quotients with the subtracted and deconvoluted spectrum of the in-solution complex also pointed to the presence of the trans diasteroisomer.
Acknowledgments
The authors would like to thank FAPERJ, CAPES and CNPq (Brazil) for financial support; and Mr. Glaucio Braga Ferreira for the helpful comments in the present work.
References
1. Hutt, L.D.; Glavin, D.P.; Bada, J.L.; Mathies, R.A.; Anal. Chem.
1999, 71, 4000.
2. Rodier, C.; Laurent, C.; Coscia, D.; Sternerg, L.; Raulin, F.; Vidal-Madjar, C.; Abstract of 13th ISCD (Chirality 2001),
P-232, Orlando, USA, July 15-18, 2001.
3. Davankov, V. A.; Rogozhin, S.V.; J. Chromatogr.1971, 60, 280. 4. Davankov, V. A.; Navratil, J.D.; Walton, H.F.; Ligand Exchange
Chromatography, CRC Press: Boca Raton, FL, 1988. 5. Gilon, C.; Leshem, R.; Grushka, E.; Anal. Chem.1980, 52,
1206.
6. Davankov, V. A.; Kurganov, A.A.; Chromatographia1983, 17, 686.
7. Wernicke, R.; J. Chromatogr. Sci.1985, 23, 39. 8. Pirkle, W.H.; Pochapsky, T.C.; Chem. Rev.1989, 89, 347. 9. Galaverna, G.; Corradini, R.; DeMunari, E.; Dossena, A.;
Marchelli, R.; J. Chromatogr. A 1993, 657, 43.
10. Husain, S.; Sekar, R.; Rao, R.N.; J. Chromatogr. A1994, 687, 351.
11. Galaverna, G.; Corradini, R.; Dossena, A.; Chiavaro, E.; Marchelli, R.; Dallavalle, F.; Folesani, G.; J. Chromatogr. A
1998, 829, 101.
12. Chen, Z.; Niitsuma, M.; Uchiyama, K.; Hobo, T.; J. Chromatogr. A2003, 990, 75.
13. Rombach, M.; Gelinsky, M.; Vahrenkamp, H.; Inorg. Chim. Acta
2002, 334, 25.
14. Nazareth, P.M.P.; Antunes, O.A.C.; J. Braz. Chem. Soc.2002, 13, 658.
15. Davankov, V.A.; J. Chromatogr. A1994, 666, 55. 16. Pirkle, W.H.; Chirality1997, 9, 103.
17. Hyun, M.H.; Ryoo, J.J.; Pirkle, W.H.; J. Chromatogr. A2000, 886, 47.
18. Jackovitz, J.F.; Durkin, J.A.; Walter, J.L.; Spectrochim. Acta A
1967, 23, 67.
19. Jackovitz, J.F.; Walter, J.L.; Spectrochim. Acta A1966, 22, 1393. 20. Malta, L.F.B.; Senra, J.D.; Medeiros, M.E.; Antunes, O.A.C.;
Supramol. Chem.2006, 18, 327.
21. Fletcher, R.; Practical Methods of Optimization, Wiley: New York, 1980, v.1.