ISSN 0104-6632 Printed in Brazil
www.abeq.org.br/bjche
Vol. 25, No. 03, pp. 563 - 570, July - September, 2008
Brazilian Journal
of Chemical
Engineering
HIGH-PRESSURE CLOUD POINT
DATA FOR THE SYSTEM GLYCEROL
+ OLIVE OIL + N-BUTANE + AOT
J. P. Bender
1, A. Junges
1, E. Franceschi
1, F. C. Corazza
1, C. Dariva
2,
J. Vladimir Oliveira
1and M. L. Corazza
1*1
Department of Food Engineering, URI, Campus de Erechim, Phone: +(55) (54) 3520-9000, Fax: +(55) (54) 3520-9090, Av. Sete de Setembro 1621, CEP: 99700-000, Erechim - RS, Brazil.
E-mail: [email protected]
2
Instituto de Pesquisa e Tecnologia, ITP, Programa de Mestrado em Engenharia de Processos PEP/UNIT, Campus Farolândia, Av. Murilo Dantas 300, CEP: 49032-490, Aracaju - SE, Brazil.
(Received: February 7, 2007 ; Accepted ; March 5, 2008)
Abstract - This work reports high-pressure cloud point data for the quaternary system glycerol + olive oil +
n-butane + AOT surfactant. The static synthetic method, using a variable-volume view cell, was employed for obtaining the experimental data at pressures up to 27 MPa. The effects of glycerol/olive oil concentration and surfactant addition on the pressure transition values were evaluated in the temperature range from 303 K to 343 K. For the system investigated, vapor-liquid (VLE), liquid-liquid (LLE) and vapor-liquid-liquid (VLLE) equilibrium were recorded. It was experimentally observed that, at a given temperature and surfactant content, an increase in the concentration of glycerol/oil ratio led to a pronounced increase in the slope of the liquid-liquid coexistence curve. A comparison with results reported for the same system but using propane as solvent showed that much lower pressure transition values are obtained when using n-butane.
Keywords: Phase equilibria; N-butane; AOT surfactant; Glycerolysis.
INTRODUCTION
The use of monoacylglycerols (MAGs) in food, pharmaceutical and cosmetic industries has been continuously increasing over the past decade. Currently, MAGs are being produced on a large scale by chemical glycerolysis of fats and oils at high temperatures, typically in the range of 170-250°C, using inorganic alkaline catalysts (Kaewthong et al., 2005). Chemical catalytic processes however have several drawbacks such as the formation of dark-colored, burned tasting by-products; their energy intensive nature, low yields (30-40%) and the need for product post-purification by molecular distillation (Yang et al., 2005).
Attempts to synthesize higher quality monoacylglycerols with higher yield processes and
to minimize energy costs have been made using lipases as catalysts, especially in non-aqueous media, in an increasingly employed standard approach to the development of strategies for organic synthesis (Kaewthong and Kittikun, 2004; Kaewthong et al., 2005; Yang et al., 2005; Habulin and Knez, 2001; Oliveira et al., 2004; Oliveira et al., 2005). In fact, several studies have shown that many enzyme-catalyzed reactions can be conducted in liquid or supercritical carbon dioxide, and in some cases, rates and selectivities achieved are greater than those obtained in normal liquid or gas phase reactions (Oliveira and Oliveira, 2000 2001).
564 J. P. Bender, A. Junges, E. Franceschi, F. C. Corazza, C. Dariva, J. Vladimir Oliveira and M. L. Corazza
(Knez and Habulin, 2002). Furthermore, the hydrophilic characteristics of carbon dioxide over wide pressure ranges may negatively affect the activity of the enzyme, as the water partitioning between the enzyme and reaction mixture may be a key factor in conducting enzymatic reactions (Knez and Habulin, 2002; Nakaya et al., 2001). Also, it should be considered that CO2 is mildly Lewis acidic, interacting with Lewis basic sites (often carbonyl groups) in a solute. This interaction enhances the effective steric bulk, resulting in enhanced conformal rigidity of the protein/support (Rayner, 2007).
Nevertheless, other compressed gases also seem to be adequate for biocatalysis (Kao et al., 1997). Actually, the comparable dielectric constants of n-butane and carbon dioxide (Habulin and Knez, 2001; Chen and Yang, 2000) and the higher pressure phase transition values generally found in systems formed of carbon dioxide with higher molecular weight compounds (e.g. triglycerides) than those found with the use of n-butane (Ndiaye et al., 2006) support a firm belief that n-butane may also be suitable as reaction medium for enzyme-catalyzed bioconversions. It should also be taken into account that to conduct enzyme-catalyzed reactions at high pressures the enzyme behavior in compressed fluids is of primary importance. For example, Oliveira and co-workers (Oliveira et al., 2006a,b) investigated the effect of high-pressure treatment on the activity of immobilized lipases in compressed carbon dioxide, propane and n-butane and found that the enzymes utilized were much more active in propane and butane than in carbon dioxide. Besides, the use of n-butane offers the advantages of low separation costs and also solvent-free products when compared to higher homologue hydrocarbons liquid solvents at ambient conditions.
However, glycerolysis generally requires the use of surface-active agents due to the usually poor dissolution of both hydrophilic (glycerol) and lipophilic (triglyceride) substrates. Microemulsion systems offer many advantages as reaction media for biocatalysis because both hydrophilic and hydrophobic substances can be dissolved in high concentrations. Besides, reverse micelles (or water-in-oil microemulsions) have a relatively ordered structure; are characterized by a definite diameter; and provide an enormous interfacial area, which clearly favors lipase-catalyzed reactions, and it has been shown that lipases have high interfacial activity in micellar systems (Stamatis et al., 1999).
Microemulsions are thermodynamically stable, nanometer-size droplets dispersed in an organic
phase stabilized by surfactant molecules. The majority of investigations with reverse micelles in biological systems has employed sodium(bis-2-ethyl-hexyl)sulfosuccinate (Aerosol-OT or AOT) as the surfactant (Stamatis et al., 1999; Bartscherer et al., 1995). This anionic surfactant has the ability to form reverse micelles in a great number of non-polar organic substances (e.g. oils) and several other polar solvents such as glycerol (Stamatis et al., 1999).
Recently, high-pressure phase equilibrium data for the quaternary system propane, AOT, glycerol and olive oil, was reported for a wide temperature range and pressures up to 30 MPa (Benazzi et al., 2006). The major objective was to investigate the phase behavior of such systems formed with potential alternative solvents in order to help elucidate the reaction mechanism as well as for a rational process design of lipase-catalyzed glycerolysis in compressed fluids.
The present report is part of a broader project aiming at developing new processes for the production of emulsifiers through enzyme-catalyzed glycerolysis reactions. Here, the aim is to report phase equilibrium (cloud point) experimental data on a glycerolysis reaction system composed of n-butane, AOT, glycerol and olive oil in the typical temperature range of enzymatic reactions, 303 K to 343 K. The effect of surfactant addition and glycerol/olive oil concentration in pressures up to 27 MPa was evaluated.
MATERIALS AND METHODS
Materials
N-butane (99.5 mol% purity) was supplied by White Martins S.A.; AOT surfactant (99 wt%) was purchased from Sigma-Aldrich and glycerol (99 mol%), from Nuclear. The olive oil (Otoyan) was purchased from a commercial establishment and was used without any additional treatment. The oil was stored in a dry place and protected against light before use. The fatty acid composition of the vegetable oil employed in this work is given elsewhere (Oliveira et al., 2005).
Apparatus and Experimental Procedure
Franceschi et al., 2004; Ndiaye et al., 2006; Benazzi et al., 2006). Briefly, the experimental setup consists of a variable-volume view cell with two sapphire windows for visual observation, an absolute pressure transducer (Smar LD 301) with a precision of ±0.03 MPa, a portable programmer (Smar, HT 201) for pressure data acquisition and a syringe pump (ISCO 260D). The equilibrium cell contains a movable piston, which permits pressure control inside the cell. Phase transitions were obtained visually through pressure manipulation using the syringe pump and the solvent as pneumatic fluid.
Initially, a precise amount of the solute was weighed on a precision balance (Gilbertini E254 with 0.0001 g accuracy) and loaded into the equilibrium cell. The cell was then flushed with low-pressure n-butane to remove any residual air. A known amount of n-butane was added with the syringe pump (resulting accuracy of ± 0.005 g in butane loadings). Based on the uncertainty in n-butane loading and the weighing of other compounds, we estimate that the uncertainty in global concentrations of the mixtures is lower than 0.005 % on a weight basis. Then the cell content was kept under continuous agitation with the help of a magnetic stirrer and a Teflon-coated stirring bar. The temperature control was then turned on, and once the desired temperature was reached, controlled within 0.5 K; the pressure system was increased until a one-phase system was observed in the cell. At this point, the system was maintained at least 30 min to allow stabilization, and then the pressure was decreased slowly (typically at a rate of 0.1-0.3 MPa/min) until
incipient formation of a new phase. This procedure was repeated at least three times for each temperature and global composition.
RESULTS AND DISCUSSION
In order to study the quaternary system n-butane + AOT + glycerol + olive oil, the glycerol/olive ratio oil was kept fixed at the stoichometric value of the glycerolysis reaction, i.e. 2:1 on a molar basis. Results for the quaternary system at 5 wt% and 7.5 wt% of AOT in n-butane (glycerol/olive oil free basis) are presented in Tables 1 and 2, respectively. For both surfactant compositions, the occurrence of coexistence curves for biphasic, LLE and VLE, and also three-phase, VLLE can be observed.
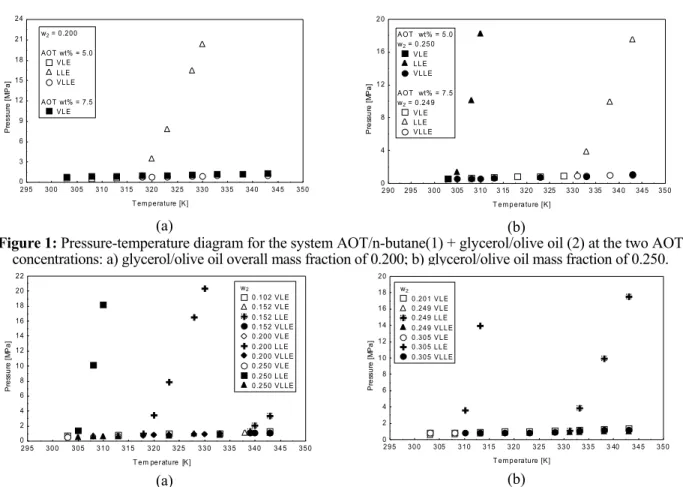
Figures 1(a) and (b) contain pressure-temperature diagrams for the AOT concentrations investigated at glycerol/olive oil overall compositions of 20 wt% and 25 wt%, respectively. It can be seen from Figure 1(a) that an increase in AOT concentration results in a decrease in pressure transition values to such an extent that, in contrast to VLE, LLE and VLLE, only VLE is registered at higher AOT content. Also, one can observe in Figure 1(b) that the addition of AOT to n-butane shifts the LL coexistence curves to higher temperatures, resulting in a broader region of homogeneous one-bulk phase. Besides, comparison of these two figures shows that a rise in glycerol/oil content at a constant AOT concentration, either 5 wt% or 7.5 wt%, can cause a change in phase behavior with at least a dramatic modification of cloud point values.
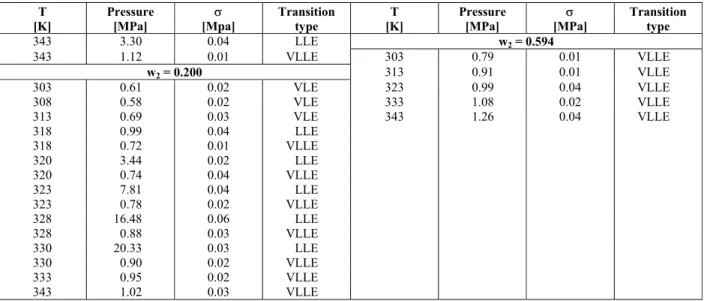
Table 1: Experimental phase equilibrium data for the system AOT/n-butane(1) + glycerol/olive oil(2) at an AOT mass fraction of 0.050 in n-butane (glycerol/olive oil free basis).
Glycerol/olive oil molar ratio fixed at 2:1.
T [K]
Pressure [MPa]
σ [Mpa]
Transition type
T [K]
Pressure [MPa]
σ [MPa]
Transition type
w2* = 0.102 w2 = 0.250
303 0.72 0.02 VLE 303 0.50 0.01 VLE
313 0.80 0.01 VLE 305 1.33 0.06 LLE
323 0.95 0.03 VLE 305 0.51 0.02 VLLE
333 1.03 0.02 VLE 308 10.09 0.02 LLE
343 1.24 0.04 VLE 308 0.55 0.01 VLLE
w2 = 0.152 310 18.21 0.05 LLE
303 0.65 0.02 VLE 310 0.57 0.04 VLLE
308 0.72 0.03 VLE 313 0.59 0.01 VLLE
313 0.77 0.01 VLE 323 0.69 0.02 VLLE
323 0.88 0.01 VLE 333 0.82 0.02 VLLE
328 0.96 0.03 VLE 343 1.09 0.03 VLLE
333 1.00 0.04 VLE w2 = 0.396
338 1.06 0.01 VLE 303 0.81 0.03 VLLE
339 1.24 0.04 LLE 313 0.88 0.06 VLLE
339 1.04 0.04 VLLE 323 1.06 0.05 VLLE
340 2.11 0.04 LLE 333 1.08 0.01 VLLE
566 J. P. Bender, A. Junges, E. Franceschi, F. C. Corazza, C. Dariva, J. Vladimir Oliveira and M. L. Corazza
Continuation Table 1
T [K]
Pressure [MPa]
σ [Mpa]
Transition type
T [K]
Pressure [MPa]
σ [MPa]
Transition type
343 3.30 0.04 LLE w2 = 0.594
343 1.12 0.01 VLLE 303 0.79 0.01 VLLE
w2 = 0.200 313 0.91 0.01 VLLE
303 0.61 0.02 VLE 323 0.99 0.04 VLLE
308 0.58 0.02 VLE 333 1.08 0.02 VLLE
313 0.69 0.03 VLE 343 1.26 0.04 VLLE
318 0.99 0.04 LLE
318 0.72 0.01 VLLE
320 3.44 0.02 LLE
320 0.74 0.04 VLLE
323 7.81 0.04 LLE
323 0.78 0.02 VLLE
328 16.48 0.06 LLE
328 0.88 0.03 VLLE
330 20.33 0.03 LLE
330 0.90 0.02 VLLE
333 0.95 0.02 VLLE
343 1.02 0.03 VLLE
*
w2 stands for glycerol + olive oil overall mass fraction
Table 2: Experimental phase equilibrium data for the system AOT/n-butane(1) + glycerol/olive oil(2) at an AOT mass fraction of 0.075 in n-butane (glycerol/olive oil free basis).
Glycerol/olive oil molar ratio fixed at 2:1.
T [K]
Pressure [MPa]
σ [Mpa]
Transition type
T [K]
Pressure [MPa]
σ [MPa]
Transition type
w2 = 0.201 w2 = 0.305
303 0.81 0.02 VLE 303 0.81 0.01 VLE 308 0.85 0.01 VLE 308 0.85 0.01 VLE 313 0.91 0.02 VLE 310 3.58 0.02 LLE
318 0.97 0.01 VLE 310 0.79 0.02 VLLE
323 1.01 0.01 VLE 313 13.93 0.02 LLE
328 1.08 0.02 VLE 313 0.81 0.01 VLLE
333 1.15 0.02 VLE 318 0.83 0.01 VLLE
338 1.21 0.01 VLE 323 0.85 0.02 VLLE
343 1.30 0.04 VLE 328 0.89 0.01 VLLE
w2 = 0.249 333 1.04 0.02 VLLE
303 0.55 0.01 VLE 338 1.12 0.02 VLLE
308 0.63 0.02 VLE 343 1.20 0.02 VLLE
313 0.70 0.02 VLE w2 = 0.402
318 0.78 0.01 VLE 303 0.99 0.03 VLLE
323 0.83 0.01 VLE 308 1.02 0.02 VLLE
328 0.88 0.01 VLE 313 1.06 0.06 VLLE
331 1.07 0.02 LLE 318 1.09 0.08 VLLE
331 0.88 0.02 VLLE 323 1.13 0.05 VLLE
333 3.82 0.06 LLE 328 1.15 0.03 VLLE
333 0.90 0.01 VLLE 333 1.18 0.06 VLLE
338 9.90 0.05 LLE 338 1.21 0.04 VLLE
338 0.96 0.02 VLLE 343 1.25 0.04 VLLE
343 17.49 0.07 LLE
343 1.01 0.01 VLLE
To help visualize the experimental data presented in Tables 1 and 2, Figures 2(a) and (b) depict the pressure-temperature diagram for the system investigated at selected mass fractions of glycerol/ olive oil. As aforementioned, cloud point values are very sensitive to small variations in solute or solvent contents, considerably altering
T e m p e ratu re [K ] Pr e s s u re [ M Pa ]
2 9 5 3 0 0 3 0 5 3 1 0 3 1 5 3 20 3 2 5 3 3 0 3 3 5 3 4 0 3 4 5 3 5 0 0 3 6 9 1 2 1 5 1 8 2 1 2 4
w2 = 0 .2 0 0
AO T wt% = 5.0 V L E L L E V L L E
AO T wt% = 7.5 V L E
(a)
(a)
T e m p era tu re [K ]
Pr e ss u re [ M P a ]
2 90 295 3 00 305 3 10 3 15 3 20 325 33 0 3 35 34 0 345 35 0
0 4 8 1 2 1 6 2 0
A O T wt% = 5.0 w2 = 0 .25 0
V L E L LE V L LE
A O T wt% = 7.5 w2 = 0 .24 9
V L E L LE V L LE
(b)
(b)
Figure 1: Pressure-temperature diagram for the system AOT/n-butane(1) + glycerol/olive oil (2) at the two AOT concentrations: a) glycerol/olive oil overall mass fraction of 0.200; b) glycerol/olive oil mass fraction of 0.250.
T e m pe rature [K ]
Pr e ss u re [ M Pa ]
29 5 30 0 3 05 31 0 31 5 3 20 3 25 3 3 0 3 35 3 40 34 5 35 0
0 2 4 6 8 10 12 14 16 18 20 22 w2
0 .1 02 V L E 0 .1 52 V L E 0 .1 52 L LE 0 .1 52 V L LE 0 .2 00 V L E 0 .2 00 L LE 0 .2 00 V L LE 0 .2 50 V L E 0 .2 50 L LE 0 .2 50 V L LE
(a)
(a)
T e m p era tu re [K ]
Pr e ss u re [ M Pa ]
2 9 5 3 0 0 305 3 10 3 15 3 2 0 3 2 5 3 3 0 3 3 5 3 40 3 4 5 3 5 0 0 2 4 6 8 1 0 1 2 1 4 1 6 1 8 2 0 w2
0 .20 1 V L E 0 .24 9 V L E 0 .24 9 L L E 0 .24 9 V L L E 0 .30 5 V L E 0 .30 5 L L E 0 .30 5 V L L E
(b)
(b)
Figure 2: Pressure-temperature diagram for the system AOT/n-butane(1) + glycerol/olive oil(2) at selected mass fractions of glycerol/olive oil (molar ratio of 2:1): a) 5 wt% of AOT in n-butane (glycerol/olive oil free basis); b)
7.5 wt% of AOT in n-butane (glycerol/olive oil free basis).
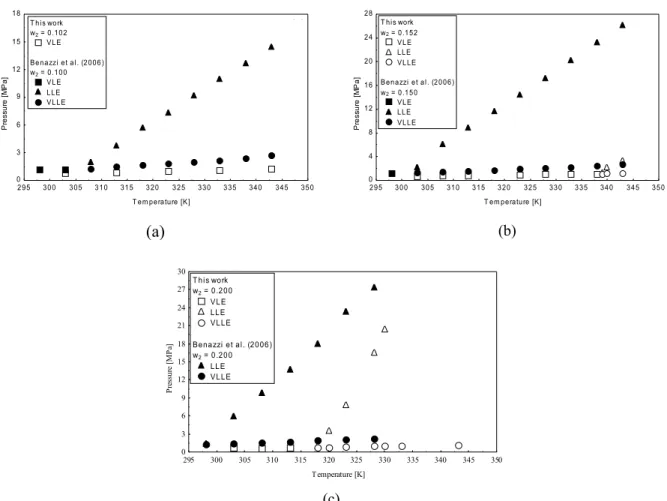
Figures 3(a) to (c) provide a comparison of data obtained in this work with those reported by Benazzi et al. (2006) for the same system, except that instead of n-butane, propane was the solvent used. Inspection of Figure 3(a) (glycerol/olive oil overall mass fraction of approximately 0.100 and AOT mass fraction of 0.050) reveals that a completely different phase behavior was found for n-butane with only VLE phase transitions being observed in a wide temperature range. As immobilized enzymes are generally preferred in industrial applications (reutilization, easy recovery and recycling), this phase behavior may be of technological relevance if one intends to conduct the reaction in a one-phase system, allowing proper interaction between substrates and enzyme particles (in fact a solid-fluid medium) (Laudani et al., 2007). Additionally, it seems unnecessary in this case to emphasize that much lower pressure transition values are found for n-butane than for propane.
Figures 3(b) and (c) show that a rise in glycerol/oil mass fraction at a given AOT concentration results in the appearance of VLLE and LLE coexistence curves at lower temperatures. It may also be interesting to observe that the slope of
the LLE curve becomes more abrupt as glycerol/olive oil content is enhanced, which means that higher pressures must be applied to attain a one-phase system (homogeneous region).
568 J. P. Bender, A. Junges, E. Franceschi, F. C. Corazza, C. Dariva, J. Vladimir Oliveira and M. L. Corazza
T e m p e ra tu re [K ]
P
re
s
s
u
re
[
M
P
a
]
2 9 5 3 0 0 3 0 5 3 1 0 3 1 5 3 2 0 3 2 5 3 3 0 3 3 5 3 4 0 3 4 5 3 5 0 0
3 6 9 1 2 1 5 1 8
(a)
T h i s wo rk w2 = 0 .1 0 2
VL E
Be n a zzi e t a l . (2 0 0 6 ) w2 = 0 .1 0 0
VL E L L E VL L E
(a)
T e m p e ra tu re [K]
P
re
s
s
u
re
[
M
P
a
]
2 9 5 3 0 0 3 0 5 3 1 0 3 1 5 3 2 0 3 2 5 3 3 0 3 3 5 3 4 0 3 4 5 3 5 0 0
4 8 1 2 1 6 2 0 2 4 2 8
T h i s wo rk w2 = 0 .1 5 2
V L E L L E V L L E
B e n a zzi e t a l . (2 0 0 6 ) w2 = 0 .1 5 0
V L E L L E V L L E
(b)
(b)
T emperature [K]
P
re
ss
u
re
[M
P
a]
295 300 305 310 315 320 325 330 335 340 345 350
0 3 6 9 12 15 18 21 24 27 30
T h i s wo rk w2 = 0 .2 0 0
V L E L L E V L L E
Be n a zzi e t a l . (2 0 06 ) w2 = 0 .2 0 0
L L E V L L E
(c)
(c)
Figure 3: Effect of solvent on phase equilibrium for the system AOT/solvent(1) + glycerol/olive oil(2): a) glycerol/olive oil overall mass fraction of approximately 0.100; b) glycerol/olive oil overall mass
fraction of approximately 0.150; c) glycerol/olive oil overall mass fraction of 0.200. Glycerol/olive oil molar ratio of 2:1 and 5 wt% of AOT in solvent (glycerol/olive oil free basis).
T e m p e ra tu re [K ]
Pr
e
s
s
u
re
[
M
Pa
]
2 95 30 0 30 5 3 1 0 3 1 5 3 20 3 25 33 0 3 3 5 3 4 0 3 4 5 3 50 0
3 6 9 1 2 1 5 1 8 2 1 2 4
w2 = 0.2 0 0 A O T wt% = 5 .0 T h i s work
V L E L L E V L L E
A OT wt% = 1 0 .0 B e n azzi e t a l . (2 0 0 6)
V L E L L E V L L E
Figure 4: Comparison of AOT/solvent + glycerol/olive oil phase behavior at glycerol/olive oil overall mass fraction of 0.200 and 10 wt% and 5 wt% of AOT in propane and n-butane,
CONCLUSIONS
Phase equilibrium measurements for the system containing n-butane, AOT, glycerol and olive oil were reported in this work. Commonly found LLE, VLE and VLLE were experimentally observed within the variable ranges investigated. Pressure transition values were found to be very sensitive to changes in surfactant and substrate contents. Comparison with the quaternary system using propane showed that the use of n-butane might be advantageous depending on the experimental condition. The experimental data reported here might be relevant for conducting enzyme-catalyzed glycerolysis in an alternative medium composed of a compressed fluid in the presence of AOT surfactant.
NOMENCLATURE
Latin Letters
AOT sodium(bis-2-ethyl-hexyl)sulfosuccinate
Aerosol-OT
P pressure MPa
T temperature K
wi mass fraction of component
(or mixture of components) i
(-)
LLE liquid-liquid equilibrium (-)
VLE vapor-liquid equilibrium (-)
VLLE vapor-liquid-liquid equilibrium
(-)
Greek Letters
σ experimental error (standard
deviation calculated from replicated measurements)
(-)
ACKNOWLEDGEMENTS
The authors thank PETROBRAS, CNPq and Intecnial Ltda (Brazil) for the financial support and scholarships.
REFERENCES
Bartscherer, K. A., Minier, M. and Renon, H. Microemulsions in compressible fluids: A review, Fluid Phase Equil., 107, 93 (1995).
Benazzi, T., Franceschi, E., Corazza, M. L., Oliveira,
J. V. and Dariva, C., High-pressure multiphase equilibria in the system glycerol + olive oil + propane + AOT, Fluid Phase Equilibria, 244, 128 (2006).
Chen, H-Q. and Yang, J-C., The effects of dielectric constant of supercritical CO2 on the
enzyme-catalyzed reaction, In: Proc. 5th Int. Symp. on Supercrit. Fluids, Atlanta, USA, April 9-11, 2000, p. 1.
Corazza, M. L., Cardozo, L. F., Antunes, O. A. C. and Dariva, C., Phase behavior of the reaction medium of limonene oxidation in supercritical carbon dioxide, Ind. Eng. Chem. Res., 42, 13, 3150 (2003).
Franceschi, E., Grings, M. B., Frizzo, C. D., Oliveira, J. V. and Dariva, C., Phase behavior of lemon and bergamot peel oils in supercritical CO2, Fluid Phase Equil., 226, 1 (2004).
Habulin, M. and Knez, Z. J., Activity and stability of lipases from different sources in supercritical carbon dioxide and near-critical propane, Chem. Technol. Biotechnol., 76, 1260 (2001).
Kaewthong, W. and Kittikun, H., Glycerolysis of palm olein by immobilized lipase PS in organic solvents, Enzyme Microb. Technol., 35, 218 (2004).
Kaewthong, W., Sirisansaneeyakul, S., Prasertsan, P. and Kittikun, A., Continuous production of monoacylglycerols by glycerolysis of palm olein with immobilized lipase, Process Biochem., 40, 1525 (2005).
Kao, F. J., Ekhorutomwen, S. A. and Sawan, S. P., Residual stability of lipase from Candida rugosa in hexane, supercritical CO2, and supercritical
SF6, Biotechnol. Tech., 11, 849 (1997).
Knez, Z. and Habulim, H., Compressed gases as alternative enzymatic-reaction solvents: A short review, J. Supercrit. Fluids, 23, 29 (2002).
Laudani, C. G., Habulin, M., Knez, Z., Porta, G. D. and Reverchon, E., Immobilized lipase-mediated long-chain fatty acid esterification in dense carbon dioxide: Bench scale packed-bed reactor study, J. Supercrit. Fluids, 41, 74 (2007).
Nakaya, H., Miyawaki, O. and Nakamura, K., Determination of log P for pressurized carbon dioxide and its characterization as a medium for enzyme reaction, Enzyme Microb. Technol., 28, 176 (2001).
570 J. P. Bender, A. Junges, E. Franceschi, F. C. Corazza, C. Dariva, J. Vladimir Oliveira and M. L. Corazza
Oliveira, D. and Oliveira, J.V., Kinetics of enzymatic alcoholysis of palm kernel oil in supercritical CO2, Ind. Eng. Chem. Res., 39, 12, 4450 (2000).
Oliveira, D. and Oliveira, J.V., Enzymatic alcoholysis of palm kernel oil in n-hexane and in SCCO2, J. Supercrit. Fluids, 19, 141 (2001).
Oliveira, D., Di Luccio, M., Faccio, C., Rosa, C.D., Bender, J.P., Lipke, N., Amroginski, C., Menoncin, S. and Oliveira, J.V., Optimization of enzymatic production of biodiesel from castor oil in organic solvent medium, Applied Biochem. Biotech., 115, 771 (2004).
Oliveira, D., Nascimento Filho, I., Di Luccio, M., Faccio, C., Rosa, C.D., Bender, J. P., Lipke, N., Amroginski, C., Dariva, C. and Oliveira, J.V., Kinetics of enzyme-catalyzed alcoholysis of soybean oil in n-hexane, Applied Biochem. Biotech., 121-124, 231 (2005).
Oliveira, D., Feihrmann, A.C., Rubira, A.F., Kunita, M.H., Dariva, C. and Oliveira, J.V., Assessment
of two immobilized lipases activity treated in compressed fluids, J. Supercrit. Fluids, 38, 373 (2006a).
Oliveira, D., Feihrmann, A.C., Dariva, C., Cunha, A.G., Bevilaqua, J.V., Destain, J., Oliveira, J.V. and Freire, D.M.G., Influence of compressed fluids treatment on the activity of Yarrowia
lipolytica lipase, Journal of Molecular Catalysis
B: Enzymatic, 39, 117 (2006b).
Rayner, C.M., The Potential of Carbon Dioxide in Synthetic Organic Chemistry, Organic Process Research & Development, 11, 121 (2007).
Stamatis, H., Xenakis, A. and Kolisis, F.N., Bioorganic reactions in microemulsions: The case of lipases, Biotechnol. Advances, 17, 293 (1999). Yang, T., Rebsdorf, M., Engelrud, U. and Xu, X.,