SHIP-BERTH LINK AND DEMURRAGE COSTS: EVALUATING DIFFERENT ALLOCATION POLICIES AND QUEUE PRIORITIES VIA SIMULATION
Peter Wanke
Received April 2010 / Accepted October 2010
ABSTRACT.The ship-berth link is one of the most critical aspects to be managed at port operations. Until now, simulation models have considered the impact of queue priorities, such as size and type of ships, on waiting times. This research differentiates from previous studies not only by considering another vari-able – the demurrage cost for each type of ship –, but also by considering the possibility of different berth allocation policies. It reports on a simulation study on small Brazilian private container terminal, where different berth allocation policies and queue priorities have been tested. Results and further analyses con-ducted via MANOVA indicate that the demurrage cost ratio between large and small ships and the critical waiting time in queue, after which demurrage costs are charged, impact on the choice of most adequate combination of policies and priorities. The analysis presented in this paper may help port authorities in determining a more precise figure for total demurrage costs.
Keywords: ship-berth link, simulation, queue priority, berth allocation, demurrage costs, MANOVA.
1 INTRODUCTION
Several researchers have focused their work on studying the application of modelling techniques to port environment and the relationships between cost and service levels that might eventually arise. In the last decade, a growing number of studies dealing with ship-berth link planning (SBL) was produced (Imai et al., 2001, 2005). Traditionally, the SBL planning problem consists of assigning incoming ships to berthing positions, as well as scheduling quay-cranes, both relevant decisions to port operation management (Meisel & Bierwirth, 2009).
If port authorities were able to plan and control SBL operations on a daily basis, given the characteristics of the ships and the market segments they serve, on a medium/long-term ba-sis, they would be capable of planning adequately for future investments in berth expansion and would be also better prepared to deal with increasing competition (Ho & Ho, 2006). This is important, because ship operators, to whom certain guarantees of berth availability are not
given, may look for alternative ports in order to maintain high levels of efficiency (Dasgupta & Gosh, 2000; Luo & Grigalunas, 2003).
Within this context, the simulation of port operations may be an option to deal with these is-sues, as it contributes to evaluate port performance and generates different scenarios to help in decision-making (Dragovicet al., 2005; Duinkerkenet al., 2006). In this paper, we focus on the analysis of ship waiting statistics and on total demurrage costs under different berth allocation policies and queue priorities, by means of a simulation model developed in ARENA. The model is fed with data from a case study on a private container terminal in Rio de Janeiro, conducted in 2009. Results are analyzed in terms of the most adequate combination of berth allocation policy and queue priority for a given set of critical levels of waiting times (after which demurrage costs are charged) and demurrage cost ratios between large and small ships.
The paper is organized as follows. In the next section, the major subsystems of port operations and the importance of SBL to port performance are presented. A particular emphasis is given to simulation as a research tool and to the impact of introducing priority on SBL performance. Then, the objectives of the study and the research questions are formalized, followed by another section where the methodology is detailed. Results are discussed and, at last, limitations and suggestions for future research are also addressed.
2 LITERATURE REVIEW
Casaca (2005) presented a comprehensive framework of port industry operations, describing in details their three major subsystems: the shipside interface or berthing area, the container yard, and the gates. Her conceptual scheme makes clear that port operations are complex by nature and, therefore, require modelling techniques, such as simulation, genetic algorithms, and nonlinear programming, in order to help port authorities in different aspects of decision-making. Casaca’s framework (2005) is used in this research to map and organize different studies according to their major objectives, modelling techniques, subsystems, and decisions.
Gates (Road/Rail) Container Yard
Berthing Area Seaside
Gates (Road/Rail) Container Yard
Berthing Area Seaside
Figure 1– Casaca’s (2005) framework.
(2006) found that shipside operations might be considerably accountable for delays at the container yard.
Parola & Sciomachen (2005) presented a simulation model in order to analyze how to face the impact of sea traffic growth on the land infrastructure. More precisely, the authors studied and proposed alternatives to deal with the impact on the saturation degree of the railway lines and on the congestion level of truck gates. Kimet al.(2003) suggested a dynamic programming model for the arrivals of trucks. Several sequencing rules were also compared via simulation. According to the authors, the shortest processing time rule showed a robust and high level performance.
Duinkerkenet al. (2006) presented a comparison among three transportation systems for the overland transport of containers between terminals. In parallel, Ottjeset al. (2006) proposed a generic simulation model structure for the design and evaluation of multi-terminal systems for container handling. In both studies, the experiments conducted gave insight into the importance of the different characteristics of the transport systems and their interaction with the handling equipment.
According to Legato & Mazza (2001), the competitiveness of a port is especially measured in terms of an adequate service level offered to shipping companies. Ho & Ho (2006) indicate that a primary goal for port authorities is to reduce the waiting time of ships from the time they arrive at the port to the leaving instant, by means of a better management of current resources. Even-tually, investments in capacity expansion may be needed, implying large capital expenditures. In this sense, a closer look at the SBL is deemed necessary (Ho & Ho, 2006). This link is not only accountable for a substantial part of the necessary investment to build a port, but also for the total waiting time in queue until (un)loading operations begin.
The SBL operation has been variously referred to as berth planning system (Legato & Mazza, 2001), berth allocation planning (Nishimuraet al., 2001), berth allocation problem (Meisel & Bierwirth, 2009), and berth-crane operations (Canonacoet al., 2008). In general terms, it be-comes clear that the major task of the SBL operation is to allocate a limited number of berths among incoming ships. The choice of berthing one ship rather than another into one specific berth can result in a too long distance from the location point of its containers in the yard, gene-rating cross-effects in terms of delays, not only at the container yard operations, but also at the berthing queue (Meisel & Bierwirth, 2009).
Another common feature of the SBL operation is the necessity to deal with resource limitations and physical constraints (Nishimuraet al., 2001). The limited number of berths and quay cranes constraints the service capacity of ports and terminals, frequently leading to a trade-off between investments in fixed assets and total demurrage costs. In such cases, the use of simulation as a planning tool has been of growing importance to find a balance between queue priorities and the possibility to postpone such investments.
smaller ships would lead to an improvement of the main operational parameters, like the average number of ships in queue and the average time a ship spends in queue. One can easily understand the crucial role that the time spent in queue plays in reducing the total waiting time of ships from the time they arrive at the port to the leaving instant. The path to a lean port environment should involve some fundamentals of operations management (Casaca, 2005), like, for instance, an in-depth study on queue priorities and berth allocation policies.
As pointed out by Asperenet al. (2003), priority rules are expected to reduce the waiting costs of high-priority ships. In their study, a simple priority scheme was considered with two pri-ority classes (high and low), where the large ships get high pripri-ority and the small ones, low. Applying priority rules, the percentage of high-priority ships was reduced, while the percen-tage of low-priority ships that had to wait was increased. However, whether priority rules reduce total demurrage costs, and to what extent, it depends on how much more expensive an idle high-priority ship, compared to a low-priority, is. This still remains to be tested. According to Dragovicet al. (2005), as cost is a key measure in the selection of alternative strategies to the SBL problem, further research needs to incorporate a cost analysis in order to identify the most appropriate combination of berth allocation policies and queue priorities in a given context.
3 RESEARCH MOTIVATIONS, OBJECTIVES, AND QUESTIONS
Transportation has increased in importance for the economy and firms in the globalization scenario. In order to support trade oriented economic development, port authorities have incre-asingly been under pressure to improve port efficiency, ensuring that port services are provided on an internationally competitive basis. There is a consensus that ports form a vital link in the overall trading chain by contributing to a nation’s international competitiveness (Tongzon, 1989; Chin & Tongzon, 1998). In Brazil, one of the so-called “emerging countries” or “BRICs” (Wilson & Purushothaman, 2003) – acronym that stands for Brazil, Russia, India, and China – exports in nominal prices more than doubled in the period between 2002 and 2008, reaching almost US$ 200 bn (Fleury & Hijjar, 2008).
Port congestion arises when port capacity is insufficient to cope with the traffic arriving at the port (Alderton, 2008). It is not a new problem and can occur at any port if there is a sudden upsurge in demand, for example. In fact, several empirical evidences suggests that Brazilian ports are running short in capacity and that ships are experimenting increasing waiting times in queue before mooring in a given berth (S´a, 2009). When this happens, demurrage costs occur. Demurrage costs are the waiting charges levied by ship-owners if their ships are not loaded or unloaded within a specified time.
impacts of berth allocation policies and queue priorities on the time a ship spends in queue. These questions are:
1) Considering the port system as a whole and each ship that periodically visits the port, what is the impact of different berth allocation policies and queue priorities on queue waiting times?
2) What are the signs of the relationship among these variables?
3) What is the most relevant main effect: berth allocation policy or queue priority?
In this study, four different berth allocation policies were considered. They are listed next.
• “Dedicated berths according to ship type”: that is, one berth serves exclusively small or large ships;
• “Single queue distributes ships to the first available berth”: in this case, all berths serve both ship types (large and small). Ships are held in one single queue before they are directed to the first available berth;
• “Ships are allocated to the berth with the smallest expected queue size”: different from the last policy, there is no single queue holding ships until a berth is available; ships enter the queue with the smallest size. All berths serve all ship types;
• “Ships are allocated to the berth with the shortest expected queue time”: this policy differs from the previous one, because, here, ships enter the queue with the shortest expected time to begin berthing. It is based on the sum of the expected processing time of ships already waiting in queue.
In each policy above, eight different queue disciplines or priorities were considered (Han-sen, 1972; Silberholzet al., 1991). These disciplines decide which ship in queue is going to be served next, at the moment a berth becomes available. They are given as follows:
• “Longest processing time”: under this priority, the ship with the longest processing time is served first when a berth is available;
• “Shortest processing time”: opposite to the one above;
• “Largest number of scheduled ship arrivals per year”: under this priority, the ship with the largest number of scheduled visits per year is served first;
• “Smallest number of scheduled ship arrivals per year”: opposite to the one above;
• “FIFO” (first-in, first-out): a classic and well-known queue discipline (Nahmias, 2001);
• “LIFO” (last-in, first-out): another classic discipline, opposite to the one above;
• “Largest ship size”: under this priority, the largest ship is served first when a berth is vacant;
The second set of questions is related to the formalization of elements to support the strategic positioning of port authorities. These new questions are an unfolding of the results obtained for the three previous questions, in light of different demurrage penalties for different ship types. These secondary questions are:
4) What are the apparent contradictions between analyzing the SBL operation as a whole and analyzing the SBL operation as a weighted sum of each one of the ship types, in terms of demurrage costs and waiting times in queue?
5) Considering the port authorities’ perspective, what is, in terms of berth allocation policy and queue priority, the most adequate strategic positioning, which minimizes the total demurrage costs and, at the same time, observes different critical levels of waiting times in queue?
4 METHODOLOGY
In order to address the previously mentioned questions, a series of controlled experiments with two factors (berth allocation policy and queue priority) and several levels was developed and conducted, so as to assess their impact on the time a ship spends in queue and its major statis-tics (mean and variance). For this purpose, the SBL operation of a Brazilian private container terminal was modeled. MULTIRIO is a small-sized container terminal, with only two berths and storage capacity of 8,000 TEUs, in Rio de Janeiro. The layout of this container terminal is depicted in Figure 2.
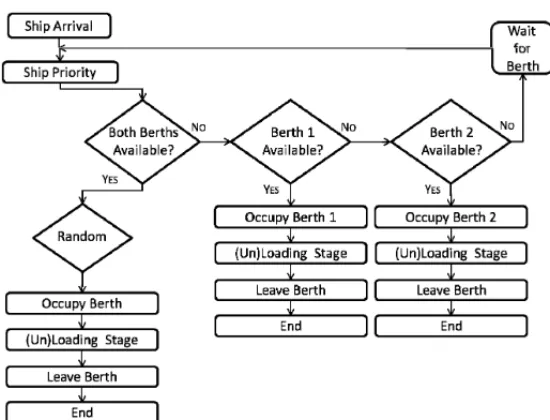
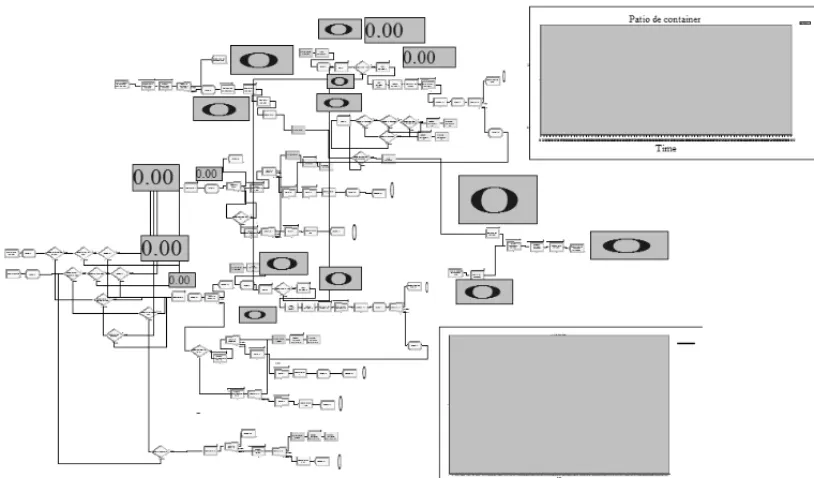
The possible alternatives for the SBL operation are illustrated in Figure 3 by means of different flowcharts. These flowcharts were modeled in ARENA 9.0, a well-established simulation tool for discrete events (Chung, 2004). They basically indicate the same sequence of activities and decisions, differing only by the factors tested. In general terms, the ship service begins when the ship arrives at the port. Depending on congestion and priority assigned, the arriving ship may have to wait until a berth is available. After berthing, containers are unloaded (loaded) from (on) the ship. Finally, when the service is completed, the ship leaves the port. Figure 4 presents a screen of one of the main SBL models developed in ARENA.
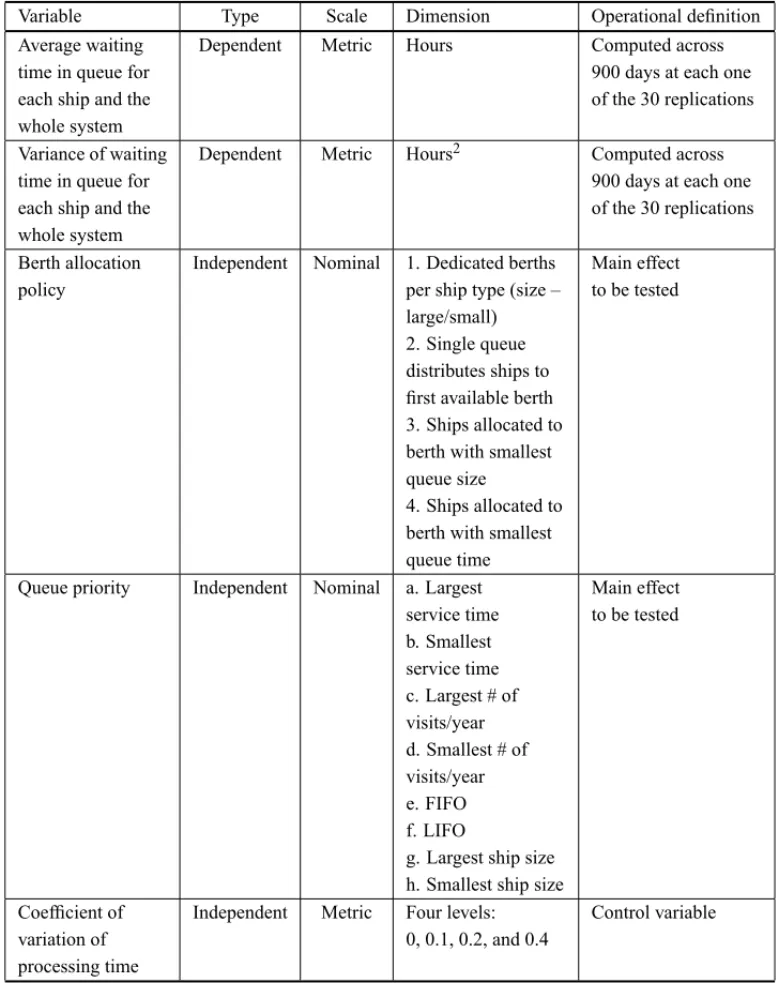
For each one of the combinations of berth allocation policies and queue priorities, 30 replica-tions of 1000 days of operareplica-tions were conducted. Statistics on the waiting time in queue, for the system as a whole and for each ship that periodically berths at the port, were collected. It is worthwhile mentioning, as a methodological note, that the SBL model focused on ships that visit the port at least two times per year. In 2009, from 23 ships, 14 met this criterion. They were the objects of analysis of this case study. The dependent and independent variables of the model are presented in Table 1, which also shows their scales, dimensions, and operational definitions.
Layout of the small container terminal.
MULTIRIO CONTAINER TERMINAL
Guanabara Bay, Rio de Janeiro
Figure 2– Layout of the small container terminal.
(1) Dedicated berths according to ship size
Process flowcharts.
(3/4) Ships allocated to berth with smallest expected queue size or time (Q1 and Q2) (2) Single queue distributes ships to first available berth
Figure 3– (continuation) – Process flowcharts.
so on) not considered in the scope of the SBL operation modeled in ARENA did not influence the statistics collected for the time spent in queue by each ship.
Figure 4– Dedicated berths model.
the most commonly assumed distributions are the exponential (Demirci, 2003; Pachakis & Ki-remidjian, 2003), the negative exponential (Shabayek & Yeung, 2002), and Weibull distribution (Tahar & Hussain, 2000).
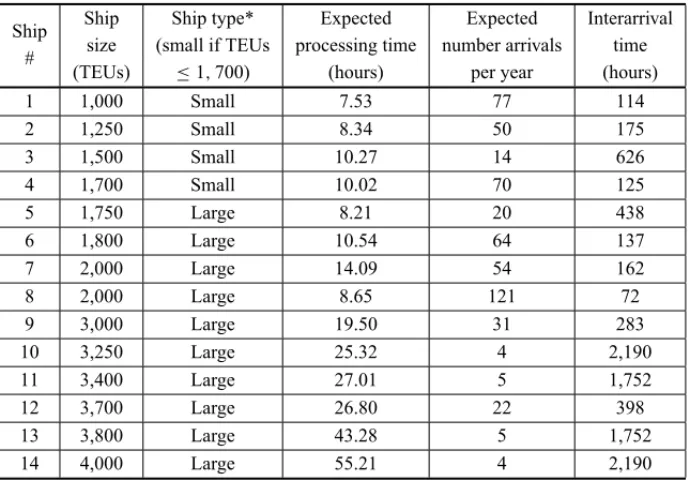
The processing times at berth for each ship were assumed to be normally distributed and their means are also given in Table 2. Four sublevels (0, 0.1, 0.2, and 0.4) of their coefficients of va-riation were tested under each combination. Several studies indicate that empirical distributions of lifts per ship adhere to normal distribution (Dragovicet al., 2005). Even when real data are not available to justify the use of a particular distribution, the number of lifts per ship can be reasonably approximated by the normal random variable (Pachakis & Kiremidjian, 2003).
Since the container terminal is relatively small, with only two berths, another simplification in the SBL model was taken. That is, the choice of anchoring one ship into one specific berth, rather than another, was supposed not to impact on the distance between the ship and the location point of its containers in the yard. Finally, it was also considered that the remainder port resources, which were not modeled in ARENA, did not impact on the time spent in queue by each ship.
Table 1– Simulation variables.
Variable Type Scale Dimension Operational definition
Average waiting time in queue for each ship and the whole system
Dependent Metric Hours Computed across
900 days at each one of the 30 replications
Variance of waiting time in queue for each ship and the whole system
Dependent Metric Hours2 Computed across
900 days at each one of the 30 replications
Berth allocation policy
Independent Nominal 1. Dedicated berths per ship type (size – large/small) 2. Single queue distributes ships to first available berth 3. Ships allocated to berth with smallest queue size
4. Ships allocated to berth with smallest queue time
Main effect to be tested
Queue priority Independent Nominal a. Largest service time b. Smallest service time c. Largest # of visits/year d. Smallest # of visits/year e. FIFO f. LIFO
g. Largest ship size h. Smallest ship size
Main effect to be tested
Coefficient of variation of processing time
Independent Metric Four levels: 0, 0.1, 0.2, and 0.4
Control variable
Table 2– Control variables.
Ship Ship Ship type* Expected Expected Interarrival
# size (small if TEUs processing time number arrivals time
(TEUs) ≤1,700) (hours) per year (hours)
1 1,000 Small 7.53 77 114
2 1,250 Small 8.34 50 175
3 1,500 Small 10.27 14 626
4 1,700 Small 10.02 70 125
5 1,750 Large 8.21 20 438
6 1,800 Large 10.54 64 137
7 2,000 Large 14.09 54 162
8 2,000 Large 8.65 121 72
9 3,000 Large 19.50 31 283
10 3,250 Large 25.32 4 2,190
11 3,400 Large 27.01 5 1,752
12 3,700 Large 26.80 22 398
13 3,800 Large 43.28 5 1,752
14 4,000 Large 55.21 4 2,190
*Ship type was arbitrarily classified by port authorities.
on a two-berth container terminal and underlying assumptions serve the purpose of exploring in depth, by means of a simplified simulation model, the influence of different berth allocation policies and queue priorities in the SBL operation.
5 SIMULATION RESULTS
MANOVA was performed with two dependent variables related to the mean and the variance of waiting times in queue for each one of the 14 ships and the system as a whole. In total, 3,840 observations were considered: 30 replications per factor combination×4 berth allocation poli-cies×8 queue priorities×4 levels of coefficient of variation of processing times. As mentioned before, each replication consisted of a run length of 1,000 days of operation, from which the first 100 days were discarded (warm-up period). No outlier observations were detected among cells at the 0.0001 significance level. Satisfactory results were also obtained for normality, homoge-neity of variance-covariance matrices, linearity, and multicollinearity assumption tests.
The estimated parameters for the impacts of berth allocation policy and queue priority, control-led for the coefficient of variation of processing times, are presented in Tables 3 and 4 (addres-sing research questions 1 and 2). “Ships are allocated to the berth with the shortest expected queue time” and “Smallest ship size” are, respectively, the reference levels for berth allocation policy and queue priority. The coefficients represent the marginal impact of other berth alloca-tion policies (“Dedicated berths according to ship size”, “Single queue distributes ships to first available berth”, and “Ships are allocated to the berth with the smallest expected queue size”) and queue priorities (“Longest processing time”, “Shortest processing time”, “Largest number of scheduled ship arrivals per year”, “Smallest number of scheduled ship arrivals per year”, “FIFO”, “LIFO”, and “Largest ship size”) altogether with the coefficient of variation of processing time. The intercept represents the marginal estimated means for the reference levels. Table 3 also indicates the values of F and adjusted R2 statistics for the models that are associated to each dependent variable.
The signs presented in Table 3 for the expected waiting time in queue (whole system) corro-borate the results found by Dragovic et al. (2005), according to which assigning priority to smaller ships would lead to an improvement of the average time a ship spends in port. The queue priorities “Smallest ship size” and “Shortest processing time” present, respectively, null or ne-gligible impact on the average waiting time in queue when compared to other disciplines. The same occurs under “Largest number of ship arrivals” per year. Considering this priority, one can easily realize (cf. Table 2) that the ship size is positively correlated to its processing time (0.47,
p<0.05) and that the ship size is negatively correlated, though weakly, to the number of arrivals per year (−0.333, p =0.157). On its turn, the ship processing time is strongly and negatively correlated to the number of arrivals per year (−0.619, p <0.01). These three queue priorities are, therefore, related to different aspects of the same operational characteristic: smaller size, shorter processing time, and higher number of arrivals per year.
Considering each decision, the relative impact on each dependent variable is indicated by the modulus of the coefficients (cf.Tables 3 and 4). However, the draw of further conclusions de-pends not only on the aggregation level of the analysis (whole system or a given ship), but also on the specific combination among the berth allocation policy, the queue priority, and the coeffi-cient of variation of processing time.
For example, analyzing the whole system, if berths are dedicated according to ship size, the berth allocation policy will present the highest positive impact on the average waiting time in queue (4.78), followed, in sequence, by the coefficient of variation of service time (1.06) and, then, by the assignment of priority to ships with the longest processing time (0.57). Results should be analyzed in a similar way for all other independent variables.
P
E
T
E
R
W
A
N
K
E
MANOVA – estimated means for the independent variables.
-0.23 -0.09 0.02 -0.14 -0.06 0.07 -0.03
0.14 0.27 0.18 0.32 0.26
-0.04 0.09 0.08 0.04 -0.11 -0.59 -0.14
0.03 0 -0.09 0 -0.48
-0.03 -0.03
3169.59 126.68 77.68 38.02 122.93 937.91 1763.51 1914.51 1252.64 1856.93 352.6 252.04 942.9 237.64 157.23 0.9 0.27 0.18 0.1 0.26 0.73 0.84 0.85 0.78 0.84 0.5 0.42 0.73 0.4 0.31
O
p
e
ra
ci
o
n
a
l,
V
o
l.
3
1
(1
),
2
0
1
S
H
IP
-B
E
R
T
H
L
IN
K
A
N
D
D
E
MU
R
R
A
G
E
C
O
S
T
S
MANOVA – estimated variances for the independent variables.
(0.18) (0.00) (0.31) (0.09) 0.31 0.10
0.45 0.66
0.01 0.31 0.06 0.11 (0.29) -0.69 -0.09
0.04 (0.30) 0.11 -0.68
0.15 (0.10) (0.32)
(0.06)
1567.74 223 151.42 67.13 214.75 597.62 834.88 911.78 780.55 1013.92 258.27 200.74 713.78 222.19 136.112 0.82 0.39 0.3 0.16 0.38 0.64 0.71 0.72 0.69 0.74 0.42 0.36 0.67 0.38 0.28 (a) This parameter is set to zero because it is redundant. Significant variables ( < 0.05) are flagged.
P
e
sq
u
isa
O
p
e
ra
ci
o
n
a
l,
V
o
l.
3
1
(1
Analyzing Table 3, it is possible to affirm that small ships would benefit more from “Dedicated berths according to ship size” or “Single queue distributes ships to the first available berth” policies. Small ships are also less impacted by the coefficient of variation of processing times. With respect to queue priorities, it seems to be a balance between “Shortest processing time” and “Smallest ship size” in terms of their impact on the average waiting time.
On the other hand, when large ships are considered, one can realize that they would benefit more from “Single queue distributes ships to the first available berth” or “Ships are allocated to the berth with the shortest expected queue time” policies. As regards the assignment of a given queue priority, however, the picture is not so clear. It is also possible to affirm that large ships are more impacted than small ones by the coefficient of variation of processing times.
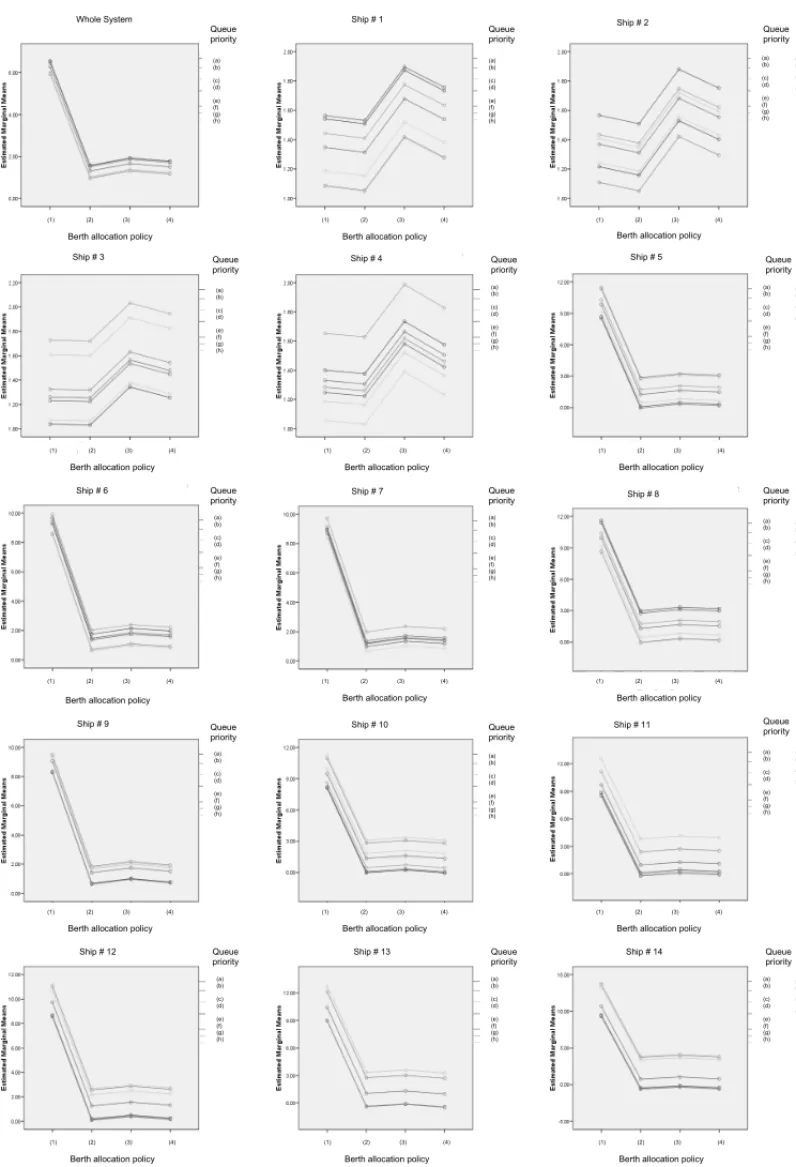
Figure 5 presents the marginal expected values of the average waiting time in queue for each ship at each one of the combinations between berth allocation policies and queue priorities. These expected values were evaluated at the mean level of the coefficient of variation of processing time (0.175) and calculated based on the coefficients in Table 3. It is clear that these countervailing forces within berth allocation policies and queue priorities for each ship should be taken together into account. More precisely, they should be weighted not only by the number of arrivals per year, but also by the demurrage cost of each ship, in order to determine what combination would lead, in fact, to the smallest total demurrage cost for the whole system.
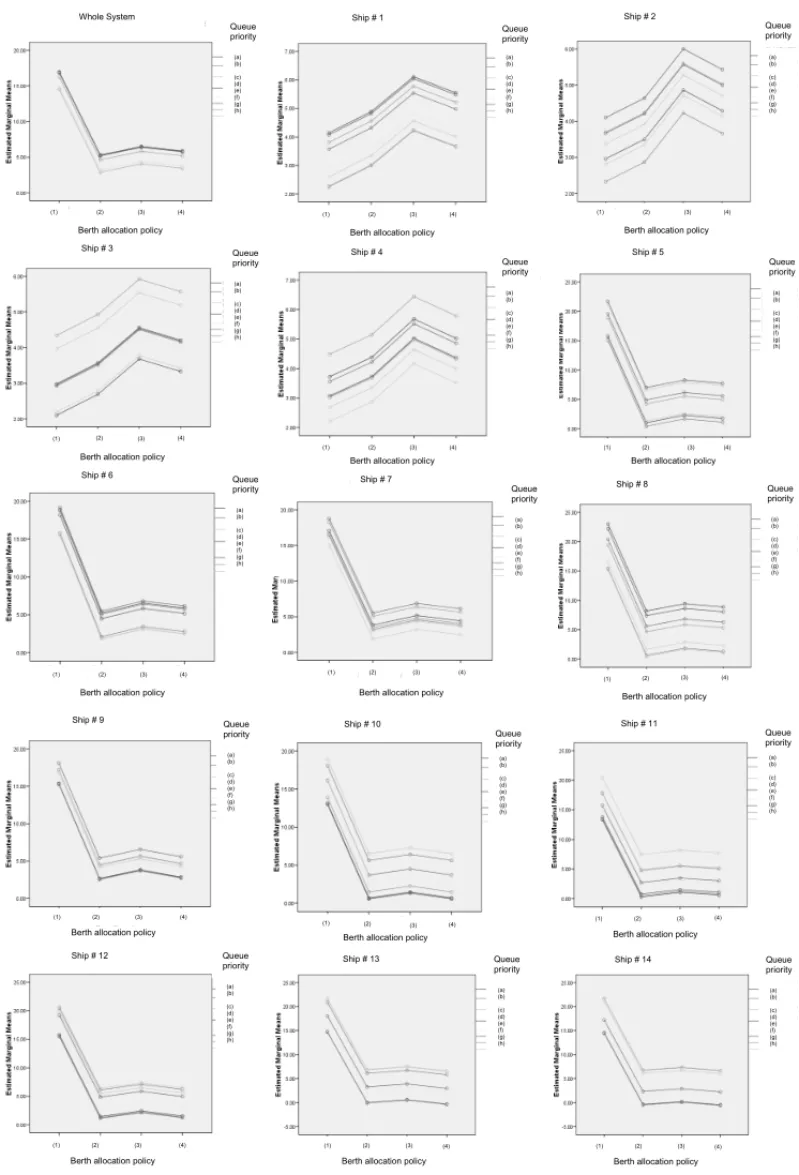
However, an analysis simply based on the marginal expected values of the average waiting time in queue for each ship may not reveal the full picture about total demurrage costs. Therefore, a probabilistic analysis is deemed necessary. Figure 6 presents the marginal expected values for the variance of the waiting time in queue for each ship at each one of the combinations of berth allocation policies and queue priorities. These values were also evaluated at the mean level of the coefficient of variation of processing time and calculated based on the coefficients in Table 3.
Supposing that the waiting times in queue for each ship(W q)are gamma-distributed variables, it is possible to determine, for each combination of berth allocation policy and queue priority, the expected demurrage time (in hours) after a critical waiting time in queue (W q cr i ti cal, in hours). Weighting this expected demurrage time (E(W q/W q>W q cr i ti cal)) by the number of arrivals per year(N A)and the demurrage cost per hour(c)of each one of thei ships, and, then, summing the 14 ships up, one gets the total demurrage cost(T DC), per year, for a given combination. More precisely:
T DC = 14 X
i=1
N Ai ·ci·E(W qi
W qi >W q cr i ti cal),
per year, for a given combination of berth allocation policy and queue priority. The best combi-nation is the one that leads to the smallestT DC.
Queue priority
(1) (2) (3)
Berth allocation policy
(4)
Whole System Ship # 1
Ship # 5 Queue priority Queue priority (a) (b) (c) (d) (e) (f) (g) (h) (a) (b) (c) (d) (e) (f) (g) (h) (a) (b) (c) (d) (e) (f) (g) (h) (a) (b) (c) (d) (e) (f) (g) (h)
(1) (2) (3)
Berth allocation policy
(4) (1) (2) (3)
Berth allocation policy
(4)
Queue priority
(1) (2) (3)
Berth allocation policy
(4)
Ship # 9
Ship # 12
Ship # 3 Queue priority Queue priority (a) (b) (c) (d) (e) (f) (g) (h) (a) (b) (c) (d) (e) (f) (g) (h) (a) (b) (c) (d) (e) (f) (g) (h)
(1) (2) (3)
Berth allocation policy
(4) (1) (2) (3)
Berth allocation policy
(4)
Queue priority
(1) (2) (3)
Berth allocation policy
(4)
Ship # 6
Ship # 10 Ship # 11 Queue priority Queue priority (a) (b) (c) (d) (e) (f) (g) (h) (a) (b) (c) (d) (e) (f) (g) (h) (a) (b) (c) (d) (e) (f) (g) (h)
(1) (2) (3)
Berth allocation policy
(4) (1) (2) (3)
Berth allocation policy
(4)
Queue priority
(1) (2) (3)
Berth allocation policy
(4)
Ship # 4
Ship # 7
Ship # 2
Queue priority Queue priority (a) (b) (c) (d) (e) (f) (g) (h) (a) (b) (c) (d) (e) (f) (g) (h) (a) (b) (c) (d) (e) (f) (g) (h)
(1) (2) (3)
Berth allocation policy
(4) (1) (2) (3)
Berth allocation policy
(4)
Queue priority
(1) (2) (3)
Berth allocation policy
(4)
Ship # 8
Ship # 13 Queue Ship # 14 priority Queue priority (a) (b) (c) (d) (e) (f) (g) (h) (a) (b) (c) (d) (e) (f) (g) (h) (a) (b) (c) (d) (e) (f) (g) (h)
(1) (2) (3)
Berth allocation policy
(4) (1) (2) (3)
Berth allocation policy
(4)
Queue priority
(1) (2) (3)
Berth allocation policy
(4) Whole System (a) (b) (c) (d) (e) (f) (g) (h)
(1) (2) (3)
Berth allocation policy
(4) Queue priority (a) (b) (c) (d) (e) (f) (g) (h)
Ship # 1 Ship # 2
Queue priority (a) (b) (c) (d) (e) (f) (g) (h)
(1) (2) (3)
Berth allocation policy
(4)
Queue priority
(1) (2) (3)
Berth allocation policy
(4)
Ship # 3
(a) (b) (c) (d) (e) (f) (g) (h) Queue priority
(1) (2) (3)
Berth allocation policy
(4)
Ship # 4
(a) (b) (c) (d) (e) (f) (g) (h) Queue priority
(1) (2) (3)
Berth allocation policy
(4)
Ship # 5
(a) (b) (c) (d) (e) (f) (g) (h) Queue priority
(1) (2) (3)
Berth allocation policy
(4)
Ship # 6
(a) (b) (c) (d) (e) (f) (g) (h) Queue priority
(1) (2) (3)
Berth allocation policy
(4)
Ship # 7
(a) (b) (c) (d) (e) (f) (g) (h) Queue priority
(1) (2) (3)
Berth allocation policy
(4)
Ship # 8
(a) (b) (c) (d) (e) (f) (g) (h) Queue priority
(1) (2) (3)
Berth allocation policy
(4)
Ship # 9
(a) (b) (c) (d) (e) (f) (g) (h) Queue priority
(1) (2) (3)
Berth allocation policy
(4)
Ship # 10
(a) (b) (c) (d) (e) (f) (g) (h)
Ship # 11
(1) (2) (3)
Berth allocation policy
(4) Queue priority (a) (b) (c) (d) (e) (f) (g) (h) Queue priority
(1) (2) (3)
Berth allocation policy
(4)
Ship # 12
(a) (b) (c) (d) (e) (f) (g) (h) Queue priority
(1) (2) (3)
Berth allocation policy
(4)
Ship # 13
(a) (b) (c) (d) (e) (f) (g) (h) Queue priority
(1) (2) (3)
Berth allocation policy
(4)
Ship # 14
(a) (b) (c) (d) (e) (f) (g) (h)
main properties. Its probability density function is skewed to the right, and for fixed β (scale factor) the tail becomes heavier as α (shape factor) increases. Also, the gamma distribution is related to several other distributions, thus making this analysis more robust. Let Wq be a gamma waiting time in queue with parametersαandβ. Some important relationships are given next (Zwillinger & Kokosa, 2000): (i) ifα = 1 and β = 1/λ, then Wq has an Exponential distribution with parameterλ; (ii) ifα=ν/2 andβ =2, thenWqhas a Chi-square distribution withνdegrees of freedom; (iii) ifα =nis an integer, thenWq has an Erlang distribution with parameters β andn; and (iv) asα → ∞,Wq tends to a Normal distribution with parameters
E(Wq)=α·βandvar(Wq)=α·β2.
With respect to the determination of the conditional expected demurrage for the gamma waiting time in queue, Tyworth et al. (1996) and Tyworth & Ganeshan (2000) presented less com-plicated solutions, originally applied to inventory management theory, that did not require the use of tabulated values. They demonstrated the relative simplicity of these solutions and dis-cussed some practical considerations as regards to their implementation in electronic spread-sheets, like MS-Excel. In their analytical form and as a spreadsheet function, these solutions are, respectively, given by:
E W qi/W qi >W q cr i ti cal =
∞
Z
W q cr i ti cal
W qi−W q cr i ti cal
·g W qi
·d W qi, (1)
and
E W qi
W qi >W q cr i ti cal
=αi·βi · 1−G AM M A D I ST W q cr i ti cal, αi +1,
βi,T RU E−W q cr i ti cal· 1−G AM M A D I ST W q cr i ti cal, αi, βi,T RU E,
(2)
where:
g(W qi) = the gamma probability density function ofW qi, αi·βi = E(W qi),the average waiting time in queue for shipi,
αi·βi2 = V ar(W qi),the variance of waiting time in queue for shipi, and
TRUE = a switch to indicate that the cumulative distribution function is desired.
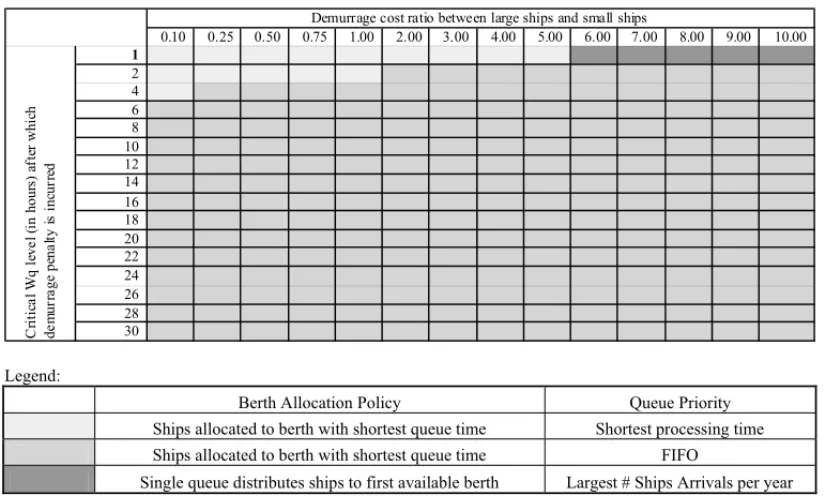
Different levels of W q cr i ti calwere simultaneously tested with different levels of demurrage cost ratios. The demurrage cost ratio indicates how many times the demurrage cost per hour of a large ship is greater than the demurrage cost per hour of a small ship. TheTDCwas calculated for each one of the combinations of berth allocation policies and queue priorities. For each pair ofW q cr i ti caland demurrage cost ratio, the best combination was then identified and plotted in Figure 7. The coefficient of variation of processing time used was 0.175.
0.10
0.25 0.50 0.75 1.00 2.00 3.00 4.00 5.00 6.00 7.00 8.00 9.00 10.00
2 4 6 8 10 12 14 16 18 20 22 24 26 28 30
Demurrage cost ratio between large ships and small ships
C ri ti ca l W q le ve l (i n hour s) a ft er w hi ch de m ur ra ge pe na lt y is i nc ur re d Legend:
Berth Allocation Policy Queue Priority
Ships allocated to berth with shortest queue time Shortest processing time Ships allocated to berth with shortest queue time FIFO
Single queue distributes ships to first available berth Largest # Ships Arrivals per year
Figure 7– Best combination in terms of demurrage costs.
ships, so as to favor the cost performance of the port system as a whole. Ships numbers 5 and 8 would be exceptions, since they are large ships with short processing times.
When the demurrage cost ratio increases, but theW q cr i ti calis still low, port authorities should adopt a single queue in order to distribute ships to the first available berth. Priority, however, should be assigned to the ships with the largest number of visits per year. Under this criterion, large ships with large number of visits per year would be favored, thus contributing to reduce the total demurrage cost of the system. Ships numbers 6, 7, and 8 meet this criterion.
At last, as theW q cr i ti calincreases and, as a direct consequence, the service standards at the port become less rigorous, the system quickly moves to the classic FIFO discipline, with ships being allocated to the berth with the smallest expected queue time at the moment of their arrival. It seems to be a trade-off between the W q cr i ti cal and the demurrage cost ratio. The higher theW q cr i ti cal, the smaller the impact of the demurrage cost ratio on the determination of the most adequate policy combination.
6 CONCLUSIONS
The SBL problem is complex, because of the different sizes of ships, different interarrival ti-mes, and different processing times at berths. By means of a simulation of a two-berth container terminal, developed in ARENA, this case study assesses the impact of different berth allocation policies and queue priorities on the waiting time spent in queue and on total demurrage costs. This paper deals with theory and practical decision-making. In comparison with previous litera-ture, two elements, detailed next, constitute its contribution.
The first element is the simultaneous consideration of four different possible berth allocation policies in parallel to eight possible queue priorities. By means of simulation, this study pro-vides experimental confirmation of the available evidence in literature on the queue priority assignment to ships with the shortest processing time, so as to improve the overall performance of the port, in terms of expected waiting time in queue.
The second element is the incorporation of the demurrage cost for each type of ship to determine the most adequate combination of berth allocation policies and queue priorities. The outputs of the simulation, generated for each ship, are further analyzed and weighted in terms of demurrage probabilities and costs in order to deal with the apparent contradictions between analyzing the SBL operation as a whole and the SBL operation as a weighted sum of the specifics of each ship.
A limitation of this study is related mainly to the underlying assumptions adopted at the design and execution of the experiments: the choice of berthing one ship rather than another into one specific berth is considered not to impact the distance to the location point of its containers in the yard; the impact of the number of lifts and quay cranes is considered to be embedded within the average processing times for each ship; and it is also considered that the scope of the SBL operation modelled in ARENA does not impact the time spent in queue by each ship. Another limitation is related to the small size of the terminal studied, thus making it more difficult to generalize the conclusions generated to larger operations.
Nevertheless, despite such limitations, the simplified model and assumptions in this case study have the advantage of allowing an in-depth understanding of the primary effects of berth alloca-tion and queue priority on port performance and their impact on total demurrage costs. Future research should be conducted under less restrictive assumptions.
REFERENCES
[1] ALDERTONP. 2008.Port management and operations. London, Informa.
[2] ASPERENEV, DEKKERR, POLMANM & ARONSHS. 2003. Allocation of ships in a port
simula-tion.Proceedings of the 15t hEuropean Simulation Symposium, ISBN: 3-936150-29-X (CD).
[3] CANONACOP, LEGATOP, MAZZARM & MUSMANNO R. 2008. A queuing network model for
the management of berth crane operations.Computers & Operations Research,35: 2432–2446.
[4] CASACAACP. 2005. Simulation and the lean port environment.Maritime Economics & Logistics,
[5] CHANG YF. 2005. Analysis of operations at the Kaohsiung port new mega container terminal. The Business Review,4: 123–128.
[6] CHIN A & TONGZONJ. 1998. Maintaining Singapore as a major shipping and air transport hub. In: Toh T (Ed.),Competitiveness of the Singapore Economy. Singapore University Press, Singapore, pp. 83–114.
[7] CHUNGCA. 2004.Simulation Modeling Handbook: a Practical Approach. CRC Press, Boca Raton.
[8] DASGUPTAA & GHOSHM. 2000. Inducing performance in a queue via prices: the case of a
rive-rine port.Management Science,46: 1466–1484.
[9] DEMIRCIE. 2003. Simulation modelling and analysis of a port investment.Simulation,79: 94–105.
[10] DRAGOVICB, PARKNK, RADMILOVICZ & MARASV. 2005. Simulation modelling of ship-berth link with priority service.Maritime Economics & Logistics,7: 316–355.
[11] DUINKERKENMB, DEKKERR, KURSTJENSSTGL, OTTJESJA & DELLAERTNP. 2006. Com-paring transportation systems for inter-terminal transport at the Maasvlakte container terminals.OR Spectrum,28: 469–493.
[12] FLEURYPF & HIJJARMF. 2008. Logistics overview in Brazil 2008. Accessed at
http://www.ilos.com.br/index2.php?option=com docman&task=doc view&gid=31&Itemid=44.
[13] HAIRJF, ANDERSONRE & TATHAM RL. 1998.Multivariate data analysis. Prentice Hall, New York.
[14] HANSENJB. 1972. Optimizing ports through computer simulation: sensitivity analysis of pertinent parameters.Operations Research Quarterly,23: 519–530.
[15] HO MW & HO KH. 2006. Risk management in large physical infrastructure investments: the context of seaport infrastructure development and investment.Maritime Economics & Logistics,8: 140–168.
[16] IMAIA, NISHIMURAE & PAPADIMITROU S. 2001. The dynamic berth allocation problem for a container port.Transportation Research Part B,35: 401–417.
[17] IMAIA, SUNX, NISHIMURAE & PAPADIMITROUS. 2005. Berth allocation in a container port: using a continuous location space approach.Transportation Research part B,39: 199–221.
[18] KIM KH, LEEKM & HWANG H. 2003. Sequencing delivery and receiving operations for yard cranes in port container terminals.International Journal of Production Economics,84: 283–292.
[19] LEGATOP & MAZZARM. 2001. Berth planning and resources optimization at a container terminal via discrete event simulation.European Journal of Operational Research,133: 537–547.
[20] LUOM & GRIGALUNAST. 2003. A spatial-economic multimodal transportation simulation model for US coastal container ports.Maritime Economics & Logistics,5: 158–178.
[21] MEISELF & BIERWIRTHC. 2009. Heuristics for the integration of crane productivity in the berth allocation problem.Transportation Research Part E,45: 196–209.
[22] NAHMIASS. 2001.Production and Operations Analysis. McGraw-Hill, New York.
[24] OTTJESJA, VEEKEHPM, DUINKERKENMB, RIJSENBRIJJC & LODEWIJKSG. 2006. Simulation of a multiterminal system for container handling.OR Spectrum,28: 447–468.
[25] PACHAKISD & KIREMIDJIAN AS. 2003. Ship traffic modeling methodology for ports.Journal of Waterway, Port, Coastal and Ocean Engineering,129: 193–202.
[26] PAROLAF & SCIOMACHENA. 2005. Intermodal container flows in a port system network: analy-sis of possible growths via simulation models.International Journal of Production Economics,97: 75–88.
[27] S ´AN. 2009. Eldorado carioca.Folha de S˜ao Paulo, October 13th, p. A8.
[28] SHABAYEKAA & YEUNGWW. 2002. A simulation model for the Kwai Chung container terminal in Hong Kong.European Journal of Operational Research,140: 1–11.
[29] SILBERHOLZMB, GOLDENBL & BAKEREK. 1991. Using simulation to study the impact of work rules on productivity at marine container terminals.Computer & Operations Research,18: 433–452.
[30] TABACHNICKBG & FIDELLLS. 2001.Using Multivariate Statistics. Allyn and Bacon, Boston.
[31] TAHARMR & HUSSAINK. 2000. Simulation and analysis for the Kelang Container Terminal ope-rations.Logistics Information Management,13: 14–20.
[32] TONGZONJ. 1989. The impact of wharfage costs on Victoria’s export-oriented industries.Economic Papers,8: 58–64.
[33] TUYP & CHANGYF. 2006. Analyses of operations of ditch container wharf and container yard. The Journal of American Academy of Business,9: 139–146.
[34] TYWORTHJE & GANESHANR. 2000. A note on solutions to the (Q,r) inventory model for gamma lead-time demand.International Journal of Physical Distribution and Logistics Management, 30: 534–539.
[35] TYWORTHJE, GUOY & GANESHANR. 1996. Inventory control under gamma demand and random lead-time.Journal of Business Logistics,17: 291–304.
[36] WILSOND & PURUSHOTHAMANR. 2003. Dreaming with BRICs: The path to 2050.Global Eco-nomic Paper No: 99. Accessed at http://www.gs.com.