*e-mail: [email protected]
Experimental Analysis of Indentation Morphologies After Spherical Indentation
Giuseppe Pintaude*, Alessandro Roberto Hoechele
Academic Department of Mechanics – DAMEC, Federal University of Technology Paraná – UTFPR, Av. Sete de Setembro, 3165, CEP 80230-901, Curitiba, PR, Brazil
Received: June 6, 2012; Revised: August 26, 2013
Indentation morphologies depend on the mechanical properties of materials, especially the strain-hardening exponent and yield strength-to-elastic modulus ratio. Hernot et al.1 described a model that
can be used to obtain the indentation morphology index from properties determined in tensile tests. The model is used here with two aluminum alloys and 1020 steel tested under spherical indentation with different loads and ball diameters. There was good agreement between the values predicted by the model and the experimental indings for all the materials tested except partially recovered AA1350 aluminum alloy (H24 condition). This exception is discussed and a possible explanation for it is sought in other experimental deviations and in microstructural inhomogeneities.
Keywords: hardness, aluminum alloy, indentation, mechanical properties
1. Introduction
Indentation morphologies (pile-up/sink-in) depend on the mechanical properties of materials, especially the strain-hardening exponent (n) and yield strength-to-elastic modulus ratio (Y/E). Pile-up and sink-in can hamper measurement of material properties2 and are considered to
be the main problem associated with some methodologies for determining the elastic modulus using instrumented indentation testing. For example, Franco et al.3 conirmed
this effect for a broad range of materials and found that those materials that exhibited pile-up produced different elastic modulus values in instrumentation indentation tests and tensile tests. Other methodologies, known as reverse analysis, have been proposed to overcome the pile-up effect4,5. One of these was tested and performed well when used with polymers6.
After exhaustive use over many years of the results reported by Norbury and Samuel8, new experimental
results relating strain-hardening exponent and indentation morphologies in spherical indentation were published7.
Pintaude et al.7 observed that the behavior of two metals (316 L stainless steel and AA1350-H24 aluminum alloy) in deep spherical indentation tests was not described by any model9-12 and discussed this inding in the light of the
metallurgical properties of these materials.
In this context, this manuscript aims to compare the indentation morphologies for different metals calculated using models described by Hernot et al.1 and Cheng
and Cheng13 and to show how they explain the indings
in the study by Pintaude et al.7. Both models are based
on numerical simulations. In the case of the paper by Hernot et al.1,a series of equations were derived, as the
amount of pile-up or sink-in depends on the ratio of the maximum indentation depth to ball radius (h/R) and on the mechanical properties (n and Y/E) extracted from tensile
tests. Cheng and Cheng13 make use of dimensional analysis
in addition to numerical simulation to obtain the indentation morphology index and present the results graphically for each value of strain-hardening exponent.
2. Experimental
Two aluminum alloys and 1020 steel were tested in spherical indentation tests using different ball diameters and loads. For practical reasons, the ratio of the indentation diameter (d) to ball diameter (D) should be kept in the range 0.24 to 0.6 in this type of test14. Accordingly, only
those combinations of load and ball diameter shown in Table 1 were used, resulting in the following values for load (L)/square of ball diameter (D2): 49.05 N/mm2 for AA1350 aluminum alloy; 98.1 N/mm2 for 6063-T5; and
294.3 N/mm2 for 1020 steel. For each condition, a minimum of 45 indentations were performed.
AA1350 alloy (0.145 wt. % Fe - 0.007 wt. % Si) was heat treated to produce different levels of hardening: H18 (work-hardened), H24 (partially recovered) and O condition (totally recovered). A wide range of treatments were carried out to identify cycles that would provide different hardness values for the AA1350 alloy. Based on these treatments, the H24 condition was achieved after 6 hours at 330 °C, and for the O condition an isothermal temperature of 400 °C was applied for 6 hours. A summary of the heat treatments can be seen in Table 2. A detailed study15 tested a roughly similar aluminum alloy (0.81 wt. % Fe - 0.65 wt. % Si) under different true strains (0.2 to 3.7) and for all cases, including an as-cast condition, 400 °C was always suficient to ensure fully recrystallized grains.
residual proiles were determined using a 2D proilometer with the specimens fastened by a device (details elsewhere7)
to prevent them moving while measurements were being taken. We use the following equation and symbols to describe the amount of pile-up or sink-in:
= .
C
h imi h (1)
where
imi is the indentation morphology index,
hC is the contact depth (= s + h, where s is the pile-up depth), and
h is the indentation depth at maximum load.
Values of imi higher than 1 indicate that pile-up has occurred, while values less than 1 correspond to sink-in. Figure 1 shows the parameters described in Equation 1 and a cross section of an indentation proile.
All the materials were also submitted to tensile tests in an MTS810 tester with a 10kN load cell. The strain rate used was 0.083 mm/s and the strain-hardening exponent was obtained following the procedures described in ASTM E646-07[16].
A minimum of three samples were tested for each type of material. The results are shown in Table 3.
The materials tested have strain-hardening exponents of less than 0.4, a necessary condition for the model proposed by Hernot et al.1. The following equations described by
Hernot et al.1 were therefore used with the mechanical
properties obtained in tensile tests:
( − )
=
2 /
2 2
N N N h
imi M
R (2)
where
R is the ball radius, and M and N are deined as
+ + − +
=
+ + + +
(1.45 28.55 1745 )(1 0.5 20 ) (1 21.4 1020 )(1 0.4 60 )
n Y E n Y E
M
n Y E n Y E (3)
+ + +
=
+ +
(1.9 12.5 570 )(1 0.1 ) (1 6.8 340 )
n Y E n
N
n Y E (4)
3. Results and Discussion
Figure 2 shows the experimental values of imi versus the values calculated using the model described by Hernot et al.1. An important limitation when using this model
is the value of Y/E, which should be greater than 1/4200. In the case of AA1350 aluminum alloy, it is worthwhile to note that its Y/E is close to this limit.
The experimental values obtained for 6063-T5 alloy and 1020 steel were predicted reasonably well by the model, as were the results for recovered AA1350 aluminum alloy despite this material’s low Y/E. Taking a typical value of imi for AA1350-O (1.0), it is clear from Figure 3 that the results of the numerical simulation described by Cheng and Cheng13
do not agree with the experimental values for this case. Figure 3 shows that a material with imi = 1.0 would correspond to an experimental value of Y/E > 0.001, which does not agree with the values calculated using the theoretical model even if allowance is made for the fact that the strain-hardening exponents used in the experimental approach and the numerical simulation were different (0.28 for the experimental approach and 0.3 for the numerical simulation). AA1350-O aluminum alloy
Table 1. Load (L) and ball diameter (D) combinations used in the spherical indentation tests.
Ball diameter, mm Load, N
2.5 306.56, 613.125 or 1834.5
3.175 (only for AA1350) 494.42
5 1226.25, 2452.5 or 7357.5
10 (not used for AA1350) 9810 or 29430
Table 2. Heat treatment and Brinell hardness for each type of material and temper (where applicable).
Material and temper (where applicable) Heat treatment Hardness, HB
AA1350-H18 Work hardened (as received) 36.5 ± 0.8
AA1350-H24 Partially recovered – 330 °C for 6h 30 ± 1
AA1350-O Totally recovered – 400 °C for 6h 19 ± 0.8
6063-T5 Artiicially aged (as received) 82.5 ± 12.5
1020 steel As rolled 145 ± 15
Figure 1. Cross section of an indentation proile showing the ball
radius (R), contact depth (hC), pile-up depth (s) and indentation depth at maximum load (h).
Figure 2. Experimental values of imi from indentation proiles
has a Y/E value of 0.0006, smaller than that indicated in Figure 3. Consequently, the model proposed by Hernot et al.1 produced better results for AA1350-O alloy than the numerical simulation described by Cheng and Cheng13.
Materials with a strain-hardening exponent equal to 0.08 are also shown in Figure 2, from which it can be seen that there is reasonable agreement between the experimental results and the results obtained using the theoretical model. Again, agreement with the results of the numerical simulation13 can be checked in Figure 4.
When the Y/E value for 1020 steel is used in the numerical simulation developed by Cheng and Cheng13,
an imi value of approximately 1.12 is obtained, while for AA1350-H18 alloy the simulation gives an imi of 1.15. As the experimental strain-hardening exponent for these materials is different from the value used in the numerical simulation, these results can be considered satisfactory. In fact, they were corroborated by the experimental inding of an imi of 1.11 for 1020 steel tested with a 5 mm diameter ball.
The poorest prediction of experimental values for the materials in Figure 2 was observed for AA1350-H24 alloy. Two experimental variations observed for this alloy merit further attention: the deviation in yield strength and the deviation in indentation depth proiles.
Changes in yield strength resulted in only small changes in imi: for each 0.02 GPa change in yield strength a 0.01 variation in imi was observed, which is insuficient to affect
the relationship shown in Figure 2. A possible explanation for the results observed for this alloy may therefore lie in the change in indentation proile.
It can be seen from Figure 5 that the profile after indentation with a 3.175 mm diameter ball was not uniform and that there were different pile-up depths on either side of the indentation.
Using the average value of h for AA1350-H24 tested with a 3.175 mm diameter ball (0.128 mm) and the pile-up depths in Figure 5 to recalculate the imi, the lower pile-up depth gives a value of 1.04 and the higher pile-up depth a value of 1.16. The former is very close to the value predicted by the model described by Hernot et al.1 for this condition (1.05), and the latter to the average experimental values shown in Figure 2 (1.2). Thus, it can be concluded that the greatest pile-up depth observed experimentally resulted in
Table 3. Yield strength (Y), elastic modulus (E) and strain-hardening exponent (n) for the different materials.
Material and temper (where applicable)
Y, MPa E, GPa n Y/E
AA1350-H18 82 ± 4 57 ± 3 0.08 ± 0.01 0.0014
AA1350-H24 75 ± 20 63 ± 8 0.17 ± 0.01 0.0118
AA1350-O 35 ± 1.5 56 ± 7 0.28 ± 0.04 0.0006
6063-T5 174 ± 9 64 ± 2 0.13 ± 0.007 0.0027
1020 steel 437 ± 44 210 ± 10 0.08 ± 0.008 0.0020
Figure 3. Numerical simulation described by Cheng and Cheng13 showing the variation in imi with Y/E for a material with n = 0.3.The experimental value of Y/E corresponding to imi = 1.0 is marked.
Figure 4. Numerical simulation described by Cheng and Cheng13 showing the variation in imi with Y/E for a material with n = 0.1. Two experimental values of Y/E and the corresponding values of
imi are marked.
Figure 5. Example of the largest variation in pile-up depth, s, for
an average imi value quite different from those calculated using the model.
Pintaude et al.4 demonstrated a similar effect for wiredrawn 52100 steel, i.e., that pile-up depth was different on each side of the indentation profile after Vickers indentation testing. In addition, Bartier et al.17 pointed out
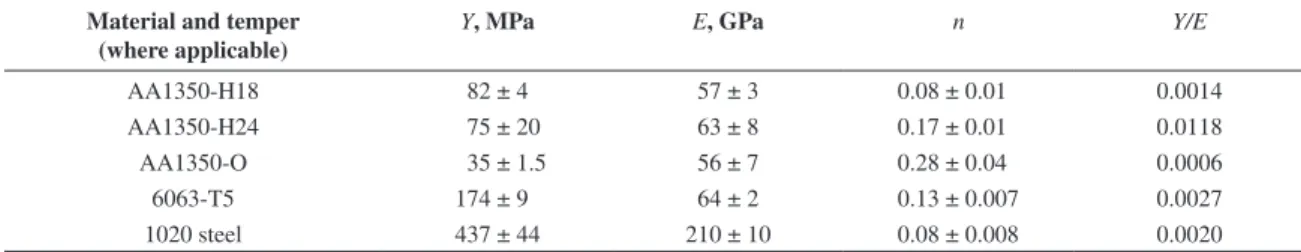
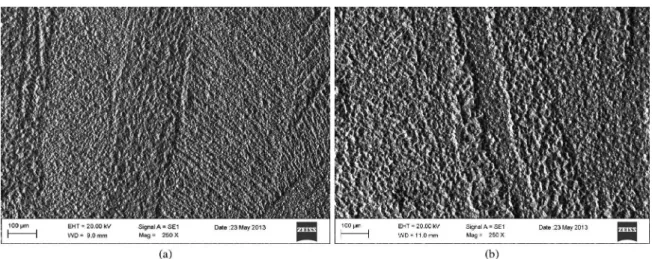
that imi is very sensitive to microstructural inhomogeneities, such as precipitates and different grain sizes. The question of microstructural inhomogeneities is relevant in the case of AA1350 alloy. For example, Mishin et al.18 found that for cold-rolled AA1050 alloy (0.24 wt. % Fe - 0.15 wt. % Si) in the recrystallized state, grain size was related to grain orientation: grains with the same orientation as the rolling texture had a smaller mean size than those with other orientations, resulting in an irregular distribution. Figure 6 presents images of AA1350 alloy in H18 and H24 conditions, revealed in scanning electron microscope. The dimension of images corresponds to a typical diameter (~1mm) found after indentation with 3.175 mm ball.
As the differences between the microstructures revealed in Figure 6 are not clear enough to separate a worthy effect of irregular grain distributions, a inal hypothesis to explain the results observed for AA1350-H24 alloy can have been caused by the unevenness in plane of the specimen surface, although all efforts were made to avoid this effect during the specimens’ preparation.
As the discrepancies observed with AA1350-H24 alloy are satisfactorily accounted for by the above explanations, it
can be concluded that the model proposed by Hernot et al.1
successfully predicted almost all the experimental results reported here and can therefore be considered a reliable tool for describing indentation morphologies.
4. Conclusions
The model proposed by Hernot et al.1 to predict
indentation morphologies was tested for two aluminum alloys and one type of steel with strain-hardening exponents of less than 0.4. The results can be considered satisfactory even for low Y/E values. Although the residual indentation proiles of only one type of material were not detected by the model, this could be accounted for by the fact that the pile-up depths for this material differed signiicantly from those for the other materials investigated. This exceptional case was discussed in terms of microstructural inhomogeneities in an attempt to explain the discrepancy in pile-up depths. Although the model proposed by Hernot et al.1 failed to
predict the imi for this material, it can be considered a reliable tool for predicting indentation morphologies using tensile properties.
Acknowledgments
Financial support for this study was provided by CNPq under project no. 306727/2011-0. The authors are grateful to Denso do Brasil for providing the equipment used in the study.
Figure 6. Microstructure detail of (a) H18 and (b) H24 conditions of AA1350 aluminum alloy, revealed in scanning electron microscope.
References
1. Hernot X, Bartier O, Bekouche Y, Mauvoisin G and El Abdi R. Influence of penetration depth and mechanical properties on contact radius determination for spherical i n d e n t a t i o n . I n t e r n a t i o n a l Jo u r n a l o f S o l i d s a n d Structures. 2006; 43:4136-4153. http://dx.doi.org/10.1016/j.
ijsolstr.2005.06.007
2. Bolshakov A and Pharr GM. Inluences of pileup on the
measurement of mechanical properties by load and depth sensing indentation techniques. Journal of Materials
Research. 1998; 13:1049-1058. http://dx.doi.org/10.1557/
JMR.1998.0146
3. Franco AR Jr, Pintaude G, Sinatora A, Pinedo CE and Tschiptschin AP. The Use of Vickers Indenter in Depth Sensing Indentation for Measuring Elastic Modulus and Vickers hardness. Materials Research. 2004; 7:483-491. http://dx.doi.
org/10.1590/S1516-14392004000300018
International Journal of Materials Research. 2005; 96:1252-1255.
5. Dao M, Chollacoop N, Van Vliet KJ, Venkatesh TA and Suresh S. Computational modeling of the forward and reverse problems in instrumented sharp indentation. Acta Materialia. 2001; 49:3899-3918. http://dx.doi.org/10.1016/
S1359-6454(01)00295-6
6. Santos AF, Wiebeck H, Souza RM and Schon CG. Instrumented indentation testing of an epoxy adhesive used in automobile body assembling. Polymer Testing. 2008; 27:632-637. http:// dx.doi.org/10.1016/j.polymertesting.2008.04.002
7. Pintaude G. Hoechele AR and Cipriano GL. Relation between
Strain-Hardening Exponent of Metals and Residual Proiles
of Deep Spherical Indentation. Materials Science and Technology. 2012; 28:1051-1054. http://dx.doi.org/10.1179/1 743284711Y.0000000107
8. Norbury A and Samuel T. The recovery and sinking-in or piling-up of material in the Brinell test, and the effects of these factors on the correlation of the Brinell with certain other hardness tests. Journal of Iron Steel Institute. 1928; 117:673-687.
9. Matthews JR. Indentation Hardness and Hot Pressing. Acta Metallurgica et Materialia. 1980; 28:311-318. http://dx.doi. org/10.1016/0001-6160(80)90166-2
10. Hill R, Stôrakers B and Zdunek AB. A theoretical study of the Brinell Hardness test. Proceedings of the Royal Society of London A. 1989; 423:301-330. http://dx.doi.org/10.1098/
rspa.1989.0056
11. Taljat B, Zacharias T and Kosel T. New analytical procedure to determine stress-strain curve from spherical indentation data.
International Journal of Solids and Structures. 1998;
35:4411-4426. http://dx.doi.org/10.1016/S0020-7683(97)00249-7
12. Alcalá J, Barone AC and Anglada M. The inluence of plastic
hardening on surface deformation modes around Vickers and spherical indents. Acta Materialia. 2000; 48:3451-3464. http://
dx.doi.org/10.1016/S1359-6454(00)00140-3
13. Cheng Y-T and Cheng C-M. What is indentation hardness?.
Surface and Coatings Technology. 2000;133-134:417-424.
http://dx.doi.org/10.1016/S0257-8972(00)00896-3
14. American Society for Testing and Materials - ASTM. E10-12: Standard Test Methods for Brinell Hardness of Metallic Materials. ASTM; 2012.
15. Birol Y. Recystallization of twin-foil cast Al-Fe-Si foil stock processed without homogeneization. Journal of Alloys and Compounds. 2009; 488:112-116. http://dx.doi.org/10.1016/j.
jallcom.2009.08.135
16. American Society for Testing and Materials - ASTM. E646-07: Standard Test Method for Tensile Strain-Hardening Exponents (n-Values) of Metallic Sheet Materials. ASTM; 2007.
17. Bartier O, Hernot X and Mauvoisin G. Theoretical and experimental analysis of contact radius for spherical indentation. Mechanics of Materials. 2010; 42:640-656. http:// dx.doi.org/10.1016/j.mechmat.2010.03.003
18. Mishin OV, Juul Jensen D and Hansen N. Evolution of Microstructure and Texture during Annealing of Aluminum