A boundary element analysis on the influence of
K
rcand
e
/
d
on
the performance of cyclically loaded single pile in clay
Abstract
The environment prevalent in oceans necessitates the piles supporting offshore structures to be designed against lateral cyclic loading initiated by wave action. Such quasi-static load reversal induces deterioration in the strength and stiff-ness of the soil-pile system, introducing progressive reduction in the bearing capacity associated with increased settlement of the pile foundation. To understand the effect of lateral cyclic load on axial response of single piles in soft clay, a nu-merical model was previously developed and validated by the author. Using the methodology, further analysis has been carried out to investigate how the variation in relative pile-soil stiffness and eccentricity effects the degradation of axial pile capacity due to the effect of lateral cyclic load. This pa-per presents a brief description of the methodology, analysis and interpretations of the theoretical results obtained from the further analysis and the relevant conclusions drawn there from.
Keywords
amplitude, clay, cyclic load, degradation, pile, load eccen-tricity, relative pile-soil stiffness.
S. Basack∗
Assistant Professor in Applied Mechanics, Ben-gal Engineering & Science University, Shibpur, Howrah-711 103 – India.
Presently in leave as:
Endeavour Post Doctoral Fellow
School of Civil, Mining & Environmental En-gineering, University of Wollongong, NSW 2522 – Australia
Received 3 Mar 2010; In revised form 1 Jun 2010
∗Author email: [email protected]
1 INTRODUCTION
Offshore structures, namely oil drilling platforms, jetties, tension leg platforms etc. are mostly supported on pile foundations. Apart from the usual super structure load (dead load, live load, etc.), these piles are subjected to continuous lateral cyclic loading resulting from ocean waves. As reported by other researchers, this type of loading induces progressive degradation of the foundation capacity associated with increased pile head displacement.
system : (i) Development of excess pore water pressure generated during cyclic loading in progress; (ii) General accumulation of irrecoverable plastic deformation of soil surrounding the pile surface; (iii) Rearrangement and realignment of soil particles surrounding the pile surface. Offshore pile foundations need to be designed considering two phenomena : adequate factor of safety against ultimate failure and acceptable deflection at the pile head. The factors responsible for cyclic performance of piles have been found to be : cyclic loading parameters (no. of cycles, frequency and amplitude of applied cyclic load), relative pile-soil stiffness and load eccentricity. A theoretical model using boundary element method to investigate how lateral cyclic loading affects the axial response of single pile in clay was previously developed and validated by the author [4]. The aim of the present work reported herein is to carry out further investigation using this model so as to study the influence of relative pile-soil stiffness and load eccentricity on the performance of single pile in clay under lateral cyclic load.
2 MATHEMATICAL ANALYSIS
The theoretical investigation that is reported here was aimed at developing a theoretical methodology for analyzing the effect of lateral cyclic loading on axial post-cyclic response of single piles in clay. Initially, analysis of a single pile under static lateral load was carried out. Further extension was made to incorporate the effect of lateral cyclic loading. The details of the methodology developed have been published elsewhere [4]. For computation, boundary element analysis was used.
2.1 Pile under lateral static load
The single, vertical pile was idealized as a thin vertical strip having width equal to the pile diameter and negligible thickness. Lateral static load was applied at a certain height above ground level. The embedded portion of the pile is longitudinally discretized into a finite number of elements. All pile elements were subjected to a lateral soil pressure which was assumed to act uniformly over the surface of the entire element. Initially, the focus was to evaluate the displacements of the soil and the pile at the central nodal points of each element and to apply a condition of displacement compatibility.
values for the pile in particular, whichever is less, had been chosen to be the ultimate static lateral capacity of the pile.
2.2 Pile under lateral cyclic load
The cyclic response of the pile in clay is governed by two significant phenomena: (i) Degra-dation of ultimate lateral pressure (piu) and Young’s modulus (Es) of soil at the nodal points and the effect of the loading rate. (ii) Shakedown effects induced by the gradual accumulation of irrecoverable plastic deformation develops in the soil at the interface as reflected by the development of a soil-pile gap extending from ground surface to a certain depth.
The degradation of soil strength and stiffness was quantified by a term soil degradation factor (Dsi) considering the following recommendations of Idrisset al. [10] and Vucetic et al. [20]:
Dsi = N−ϵi/(A+Bϵi), where, ϵi is the nodal normal strain and A & B were the two soil parameters whose values are to be determined from cyclic undrained triaxial or cyclic undrained direct simple shear tests.
This soil degradation was coupled with the effect of strain rate. As per Poulos [15], the undrained soil strength and stiffness increases linearly with logarithm of the loading rate, Fρ
being the constant of proportionality andλr being the datum loading rate.
While calculating the axial post-cyclic pile capacity, the effect of shakedown was incorpo-rated. Starting from the uppermost soil element, a soil-pile gap was supposed to be developed for those elements where yielding took place. However, the depth of this separation cannot be extended beyond the free standing height of the clay bed. A composite analysis was performed in comparison to the cycle-by-cycle analysis to minimize the computational time and effort without much sacrificing the accuracy. This approximate method has been reported by other researchers to yield quite promising results [2, 15]. The cyclic axial capacity of the pile was cal-culated considering no contribution on the frictional resistance at the interface where the gap has developed and the degraded values of soil strength and stiffness for the remaining portion of the interface where no soil-pile separation developed. Unless stated otherwise, henceforth in this paper, the term ‘degradation factor’ will indicate the degradation factor for axial pile capacity which was defined as the ratio of post-cyclic to pre-cyclic axial pile capacities [3, 4].
The computations were carried out using a user-friendly computer software LCYC de-veloped by the author in Fortran-77 language. The flowchart has been published elsewhere [4].
3 VALIDATION OF THE MATHEMATICAL ANALYSIS
The analytical methodology developed has been validated by comparing the mathematical results with available experimental and theoretical results, as described below.
the curves corresponding to the field test and the FEA analysis except for higher values of load ranging values beyond 150 t. This is quite understandable because as the applied lateral load approaches the failure load corresponding yielding of subsoil surrounding the pile, the nodal displacements for unfailed elements were still computed by using the Mindlin’s equation whereas in reality the majority of the interface soil becomes inelastic and therefore the equation no more remains valid. The theoretical bending moment diagrams, as obtained by the present theory, was compared with the available field test results and that of the FEA. The comparison is depicted in Fig. 2. It was observed that although the theoretical curve was well in agreement with the other curves in basic nature, the magnitudes in the former curve was slightly in the higher side and the peak bending moment also occurred at a greater depth. This deviation was supposed to be due to the inaccuracy initiated in application of Mindlin’s equation at higher load levels. From the given pre-cyclic and post-cyclic load deflection curves as per Kooijman [11], the degradation factor was estimated as the ratio of the corresponding secant modulii. The degradation factor calculated from the field test results was Df =0.83. Considering the
post-cyclic ultimate lateral soil pressures, the computed value of degradation factor for ultimate lateral capacity of the pile, as per the present theory, came out to beDf =0.92. However, in
computing this value, some of the cyclic soil parameters were reasonably assumed since they were not available in the literature. These assumed values were as follows : As=0.01,Bs=9.5,
Fρ = 0.1 and λr =0.08. The no. of cycles and frequency reported were respectively 10 and 6.667 cycles per minute.
0 5 10 15 20 25
0 25 50 75 100 125 150
Horizontal Groundline Deflection (mm) L
a t e r a l
L o a d
(
t
)
Present Theory
FEA Prediction (Kooijman)
Field Test
Figure 1 Comparison of theoretical load-defection response of pile with available field test results and FEA analysis of Kooijman [11].
-40 0 40 80 120
0 2 4 6 8 10 12
Depth below GL (m)
B
e
n
d
in
g
M
o
m
e
m
t
(t
-Field Test
Present Theory
FEA Analysis (Kooijman)
Figure 2 Comparison of theoretical bending moment diagram with available field test results and FEA analysis.
obtained from the present computation were well in agreement with the FE results, although there are some deviations. The distributions of lateral soil pressure along pile depth are shown in Fig. 3. In the present analysis, the soil pressure was observed to increase with depth to a maximum positive value, thereafter reduced gradually to zero and for further depth, it became negative. This change in sign from positive to negative was found to occur at normalized
depths of 0.65 and 0.3 with L/d ratios of 10 and 25 respectively. In case of the analytical
results of Bouzid et al. [6], the profiles for soil reaction were of similar nature except the
absence of any negative soil pressure zone in the vicinity of pile tip and the magnitude of p
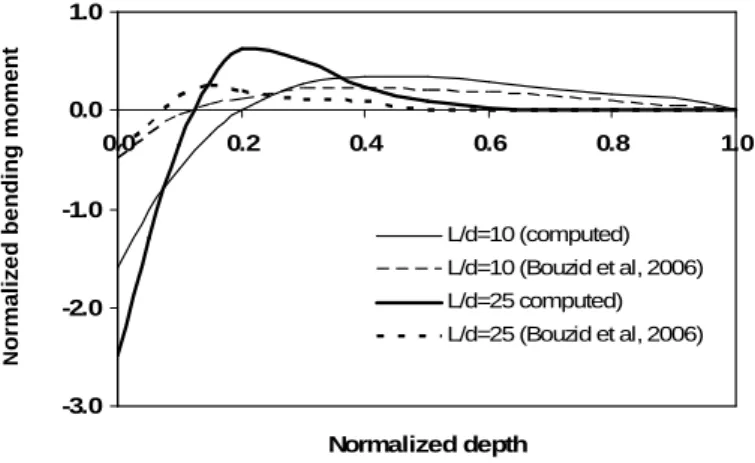
gradually increased with depth near the tip. The pile deflection profiles are presented in Fig. 4. The nodal pile deflectionρ was normalized asρEsd/H. The computed pile deflections were nowhere negative and the rotations at the pile head was slightly higher in comparison with the results of FE analysis. The bending moment profiles are shown in Fig. 5. The nature of the computed profiles was in excellent agreement with those of FE analysis. In the former case, the point of contraflexure was observed at depths of 0.2 and 0.1 respectively forL/dof 10 and 25 against the corresponding values of 0.1 and 0.25 in the FE analysis.
-0.1 0 0.1 0.2 0.3 0.4
0.0 0.2 0.4 0.6 0.8 1.0
Normalized depth
N
o
rm
a
li
z
e
d
s
o
il
r
e
a
c
ti
L/d=10 (computed)
L/d=10 (Bouzid et al, 2006) L/d=25 (computed)
L/d=25 (Bouzid et al, 2006)
N
o
rm
a
li
z
e
d
s
o
il
r
e
a
c
ti
o
n
-0.2 0 0.2 0.4 0.6 0.8
0.0 0.2 0.4 0.6 0.8 1.0
Normalized depth N o rm a li z e d p il e d e fl e c t L/d=10 (computed)
L/d=10 (Bouzid et al, 2006)
L/d=25 (computed)
L/d=25 (Bouzid et al, 2006)
N o rm a li z e d p il e d e fl e c ti o n
Figure 4 Comparison of computed pile deflection with available analytical results of Bouzidet al. [6].
-3.0 -2.0 -1.0 0.0 1.0
0.0 0.2 0.4 0.6 0.8 1.0
Normalized depth N o rm a li z e d b e n d in g m o m L/d=10 (computed)
L/d=10 (Bouzid et al, 2006) L/d=25 computed)
L/d=25 (Bouzid et al, 2006)
N o rm a li z e d b e n d in g m o m e n t
Figure 5 Comparison of computed bending moment profile along pile depth with available analytical results of Bouzidet al. [6].
The report of University of Western Australia regarding the field investigations vide Dames & Moore Job No. 08043-073-071 [19], was primarily aimed towards presenting suitable design criteria based on the field test results. The proposed substructure comprised of four-legged jacket with an integral module support frame and the proposed foundation consisted of a four-pile group, one at each corner. A steel tubular primary four-pile was driven vertically at four four-pile positions and an additional tubular insert was grouted in a hole drilled through the primary pile at three slots. In the report of UWA, the lateral single pile load-deflection response was evaluated using the method of subgrade reaction on the basis of p-y data obtained from the field tests. Fig. 6 represents a comparison of the field load-deflection curve with that obtained from the present analysis. It may be observed that the computed curve is fairly linear as against a hyperbolic field response although in magnitude they are quite closer. The ultimate capacity of the long and flexible pile (Krs = 10−
4
) was computed as 700 MN. Since the L/d
from analysis that under working load upto 7 MN, soil yielding has taken place only for the top 5-10% of the depth of embedment which indicates that the interactive behaviour of the soil-pile system is largely elastic in this range of loading and justifies the linear nature of the load-deflection curve.
0 2 4 6 8
0 25 50 75 100 125
Horizontal groundline deflection (mm)
L
a
te
ra
l
lo
a
d
(
M
N
Field test
Computed
Figure 6 Comparison of computed load-deflection response of single pile with available field test results of UWA - Dames & Moore [19].
Dyson [9] carried out experimental investigation on the pile-soil interaction due to lateral loading (monotonic and cyclic) in sand and silt. All tests were carried out in a beam centrifuge machine at 100g and 160g. The results obtained were compared with the existing models and relevant conclusions were arrived at. The computed load-deflection response at pile head, as obtained from the present analysis, has been compared with the average experimental response. It was observed that the basic nature of the two curves, as depicted in Fig. 7, is similar although the variation in the magnitude was considerable. Fig. 8. represents the computed and the experimental cyclic pile deflection profile at No. of cycles = 100. It should be mentioned at this stage that no rotation has actually taken place at the pile head due to the chosen boundary condition although it appears because of Excel package that notable head rotation has taken place. Notable deviation between the computed and experimentally derived deflection profiles may be observed in the vicinity of G.L. which progressively diminished with increase in depth.
However, for z/L > 0.3, the deviation is quite small. The computed and the experimental
profiles for the pile bending moment at N=100 are depicted in Fig. 9. The basic natures of
the two curves are similar but the deviation in magnitude is fairly large, the computed values being on the higher side. The contra-flexure has been observed to occur at a normalized depth of 0.75 against the experimental value of 0.3.
Figure 7 Pre-cyclic load-deflection curve at pile head.
Figure 8 Comparison of computed static and cyclic pile deflections (with assumed degradation model) with available experimental results of Dyson [9].
-800 -600 -400 -200 0 200 400
-0.2 0.0 0.2 0.4 0.6 0.8 1.0
Cyclic at N = 100 (computed)
Cyclic at N = 100 (experimental)
N
o
rm
a
li
z
e
d
B
.M
.,
M
/k
d
4
Normalized depth, z/L
0 10 20 30 40 50 60
0 0.01 0.02 0.03 0.04 0.05
Displacement (m)
L
o
a
d
(
K
N
Computed (present theory) computed (Chaudhry, 1994)
N
)
Ultimate lateral load : 53 KN
Ultimate lateral load : 65 KN
Figure 10 Comparison of lateral load-deflection responses after Chaudhry (1994).
4 RESULTS AND DISCUSSIONS
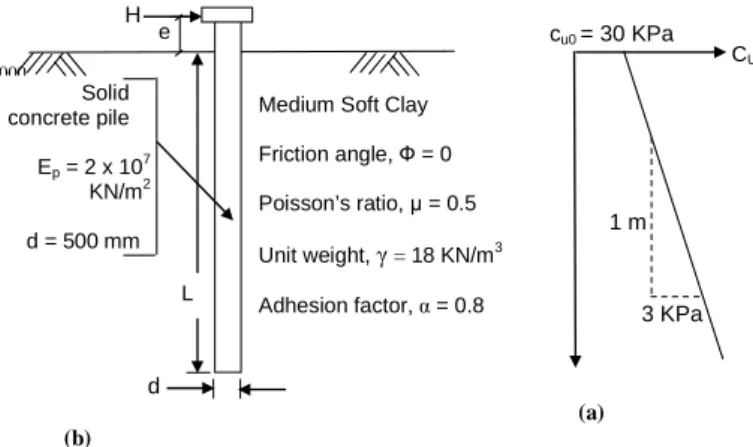
The theoretical methodology and the software developed have been utilized to study the post-cyclic axial response of single prototype pile in clay. The problem is shown in Fig. 11. The
undrained cohesion cU of the soil has been assumed to increase linearly with depth at a rate
of increment ofKh = 3 KN/m3, starting from a value ofcu0= 30 KPa at ground level. After the recommendations of Poulos & Davis [16] and Banerjee & Davies [1], the ratio Es/cu is reasonably chosen as 100.
d
(a) (b)
CU
3 KPa 1 m cu0 = 30 KPa
Solid concrete pile
Ep = 2 x 10⁷ KN/m2
d = 500 mm
Medium Soft Clay
Friction angle, Ф = 0
Poisson’s ratio, = 0.5
Unit weight, = 18 KN/m3
Adhesion factor, = 0.8
2000
L e H
Figure 11 (a) The prototype pile. (b) Variation ofcU with depth.
The embedded length of the pile was increased sequentially such that theL/dratio varied starting from a value of 10 up to a maximum limit of 50, incorporating gradual reduction in the relative pile-soil stiffness Krc the value of which has been calculated using the following relation suggested by Poulos & Davis [16] : Krc = EpIp/KhL5
present case, this happens whenL/dexceeds 11.54.
4.1 Influence of stiffness and eccentricity on static lateral response
The computed values of ultimate lateral pile capacities for various L/d and e/d ratios are
summarized in Tab. 1. The values of the ratio of static lateral ultimate capacities for fixed to free pile head conditions (referred herein as ‘capacity ratio’) are presented in Tab. 2.
Table 1 Values of ultimate lateral pile capacities (kN).
L/d e/d 0.0 0.2 0.5 K1.0rc* 2.0 5.0 10.0 10 0.654 260 # 252 239 231 211 151 110
742 $ 741 744 701 659 500 341
15 0.086 923 921 883 862 801 661 512
923 921 883 862 801 661 512
20 0.020 669 662 651 619 589 501 392
1131 1123 1121 1079 1030 909 741
25 0.0067 910 901 882 870 821 672 493
1430 1420 1400 1382 1341 1211 1050
30 0.0027 1022 1001 979 941 881 711 520
1801 1793 1771 1753 1692 1558 1201
40 0.00064 1061 1030 1010 981 911 721 521
2162 2131 2082 2051 1923 1662 1269
50 0.00021 1061 1039 1011 982 911 730 522
2179 2162 2139 2089 1954 1680 1270
* Critical value ofKrc= 0.01 atL/d= 11.54. # Normal font for free headed pile.
$ Italized font for fixed headed pile.
Table 2 Values of capacity ratio.
L/d 0.0 0.2 0.5 e/d1.0 2.0 5.0 10.0 10 2.85 2.96 3.08 3.04 3.14 3.33 3.09
15 2.04 2.09 2.00 2.05 2.11 2.13 2.22
20 1.69 1.70 1.72 1.74 1.75 1.82 1.90
25 1.57 1.58 1.59 1.59 1.63 1.81 2.14
30 1.76 1.79 1.81 1.86 1.92 2.20 2.31
40 2.04 2.07 2.06 2.09 2.11 2.31 2.44
50 2.06 2.08 2.12 2.15 2.17 2.30 2.40
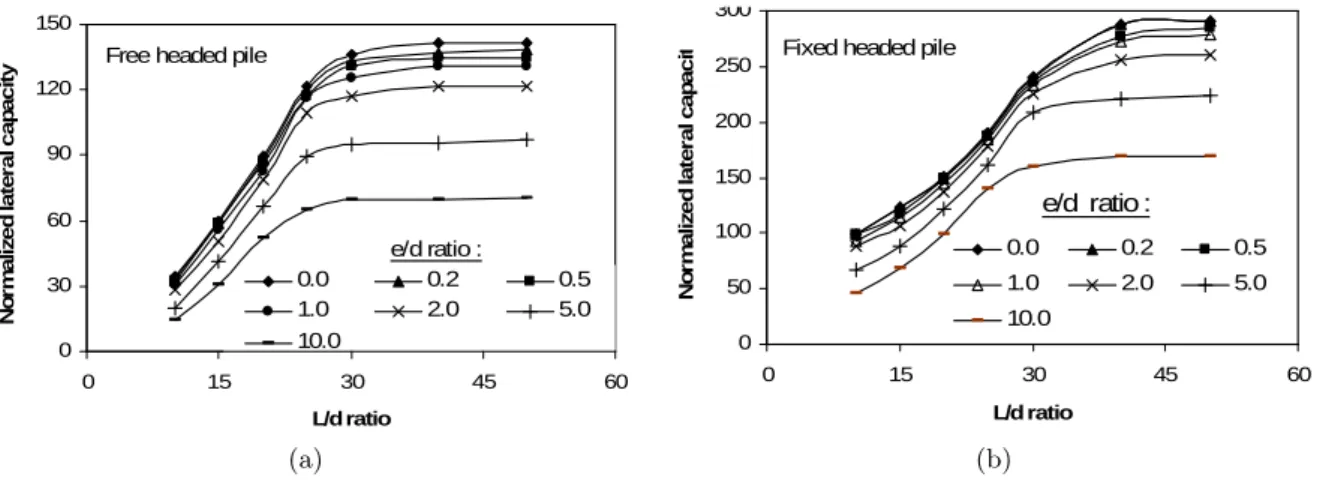
The values of ultimate lateral capacity were normalized by a term cu0d
2
. This normalized
values for the free and the fixed head conditions were plotted against L/d ratio, as shown
the slope of the curves suddenly decreased. For further increase in L/dratio, the slope of the
curves gradually diminished. This critical value of L/d ratio varied in the ranges of 30-40.
Understandably for initial values of L/d ratio, lateral load attains the ultimate value due to yielding of surrounding soil. As L/d ratio increases, failure of pile material itself because of development of plastic hinge takes place prior to soil yield. This is the reason responsible for such behavioral trend.
The normalized ultimate lateral pile capacities for the free and the fixed head conditions
were plotted against Krc, as shown in Fig. 13. The capacity was observed to decrease quite
sharply at initial stage, but gradually tends to stabilize asymptotically at higher values ofKrc.
The values of ultimate lateral capacity for the free and the fixed head conditions were
plotted against e/d ratio, as shown in Fig. 14. It was observed that the capacity decreased
with increase ine/dratio approximately linearly although in case of free headed pile, a tendency of asymptotic stabilization of the curves may be noted. Understandably, the increment in load eccentricity induces greater moment at pile head which significantly reduces the contribution of the lateral load to cause failure of the pile.
Fig. 15. depicts the plot of capacity ratio versus L/d ratio. Initially, the value of the
capacity factor drastically dropped down withL/dratio and reached a minimum limit.
There-after, the curves again sloped in the upward direction and asymptotically stabilized for higher values of L/dratio. The value of L/d ratio at which the curves attained minimum limits was observed to lie in the range of 20-25.
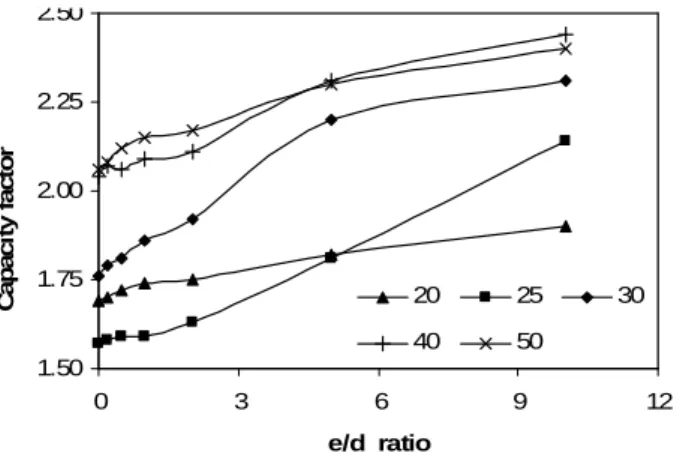
The capacity factor was observed to increase fairly linearly with e/d ratio, as shown in
Fig. 16.
0 30 60 90 120 150
0 15 30 45 60
L/d ratio
N
o
rm
a
li
z
e
d
l
a
te
ra
l
c
a
p
a
c
it
y
0.0 0.2 0.5
1.0 2.0 5.0
10.0
e/d ratio : Free headed pile
(a)
0 50 100 150 200 250 300
0 15 30 45 60
L/d ratio
N
o
rm
a
li
z
e
d
l
a
te
ra
l
c
a
p
a
c
it
y
0.0 0.2 0.5
1.0 2.0 5.0
10.0 Fixed headed pile
e/d ratio :
(b)
0 30 60 90 120 150
0 0.1 0.2 0.3 0.4 0.5 0.6 0.7
Relative pile-soil stiffness .
N o rm a li z e d l a te ra l c a p a c it y
0.0 0.2 0.5
1.0 2.0 5.0
10.0
e/d ratio :
Free headed pile
(a) 0 50 100 150 200 250 300
0 0.1 0.2 0.3 0.4 0.5 0.6 0.7
Relative pile-soil stiffness .
N o rm a li z e d l a te ra l c a p a c it y
0.0 0.2 0.5
1.0 2.0 5.0
10.0
e/d ratio :
Fixed headed pile
(b)
Figure 13 Variation of normalized ultimate lateral pile capacity with Krc for head conditions (a) free. (b)
fixed. 0 40 80 120 160
0 2 4 6 8 10
e/d ratio N o rm a li z e d l a te ra l c a p a c it y
10 15 20
25 30 40
50
L/d ratio :
Free headed pile
(a) 0 50 100 150 200 250 300 350
0 2 4 6 8 10
e/d ratio N o rm a li z e d l a te ra l c a p a c it y
10 15 20
25 30 40
50
L/d ratio :
Fixed headed pile
(b)
Figure 14 Variation of normalized ultimate lateral pile capacity withe/dratio for head condition (a) free. (b) fixed. 0.0 0.5 1.0 1.5 2.0 2.5 3.0 3.5
0 10 20 30 40 50 60
L/d ratio
C a p a c it y f a c to r
0.0 0.2 0.5 1.0
2.0 5.0 10.0
e/d ratio :
1.50 1.75 2.00 2.25 2.50
0 3 6 9 12
e/d ratio
C
a
p
a
c
it
y
f
a
c
to
r
20 25 30
40 50
Figure 16 Variation of capacity factor withe/dratio.
4.2 Influence of cyclic loading parameters
The influence of cyclic loading parameters on the response of the pile was studied at L/d
ratio of 20 and zero eccentricity. Thereafter, further analysis was done by varying the stiffness and eccentricity. The initial static analysis has been carried out. For ascertaining the lateral static response, the method described above has been utilized, whereas in case of axial static response, the conventional method (available in any standard text book) has been followed. Analysis was carried out considering the free and the fixed head conditions of the pile.
As already stated earlier, the cyclic soil-pile interactive response was quantified by a term degradation factor defined earlier. Analysis was carried out with the following cyclic loading parameters : No. of cycles : 100, 250, 500, 750, 1000; Frequency (expressed in cycles per minute or c.p.m.) : 5, 10, 15, 20, 25; Cyclic load amplitude (normalized by static lateral pile capacity) : 15%, 20%, 25%, 30%, 40%.
For detailed analysis using the methodology described above, some additional parameters related to cyclic behaviour of soil apart from the soil and pile data is necessary. The values of these parameters already considered by Basack and Purkayastha [5] have been assumed here
as well, which are as follows : A= 0.025; B = 8.5;Fρ = 0.1;λr = 6.59 mm/minute.
From detailed cyclic analysis, the degradation factor was observed to vary between the maximum and the minimum values of about 0.942 to 0.677. This indicates considerable loss (about 32%) of pile capacity at higher amplitudes. The author’s long experience in this field indicates that the degree of this deterioration is highly sensitive to the values of A and B to be considered for analysis.
The patterns of variation of degradation factor with cyclic loading parameters were studied carefully. The observations are sequentially described below.
Fig. 17 depicts a typical plot of degradation factor versus no. of cycles. It has been observed that in almost all the cases, the degradation factor as well as the slope of the curves
decreases with no. of cycles. Initially (upto about N = 500), the reduction in value is quite
reason against such pattern is that as per the model, the soil strength decreases exponentially
with N which in addition to the effect of shakedown, has introduces this nature variation.
0.75 0.80 0.85 0.90 0.95
0 300 600 900 1200
No. of cycles
D
e
g
ra
d
a
ti
o
n
f
a
c
to
r
f=5; P1 f=5; P2 f=10; P1
f=10; P2 f=15; P1 f=20; P1 f=25; P1 f=25; P2
f = Frequency in c.p.m. P1=Free head; P2=Fixed head;
Amplitude : 15 %.
Figure 17 Variation of degradation factor with no. of cycles.
A representative plot of degradation factor versus frequency is shown in Fig. 18. For most of the cases, the degradation factor was observed to increase with frequency. Initially within 15 c.p.m., the increase is fairly pronounced after which there is an asymptotic stabilization. This type of pattern is in accordance with the consideration of logarithmic increase in soil strength and stiffness with relative loading rate.
0.75 0.80 0.85 0.90 0.95
0 5 10 15 20 25 30
Frequency (c.p.m.)
D
e
g
a
rd
a
ti
o
n
f
a
c
to
r
100 100
250 250
500 500
750 750
1000 1000
No. of cycles : Free head Fixed head Amplitude : 15 %.
Figure 18 Variation of degradation factor with frequency.
Fig. 19. presents a sample variation of degradation factor with amplitude of cyclic loading. The degradation factor was observed to decrease in parabolic manner; the slope of the curves increases sharply amplitude. This pattern of variation is in accordance with the experimental observation of Basack [3]. Exponential deterioration in soil strength and stiffness coupled with shakedown effect is the probable reason for such pattern of variation.
0.65 0.70 0.75 0.80 0.85 0.90
10 15 20 25 30 35 40 45
Cyclic load amplitude (%)
D
e
g
ra
d
a
ti
o
n
f
a
c
to
r
5 5
10 10
15 15
20 20
25 25
No. of cycles : Free head Fixed head
Frequency : 5 c.p.m.
Figure 19 Variation of degradation factor with amplitude.
It was observed that although this depth is not affected much by the variation in frequency, the same is affected significantly with no. of cycles and amplitude. Two typical plots, one with amplitude and the other with no. of cycles, are depicted in Figs. 20 and 21 respectively. The normalized depth of soil-pile separation was found to increase fairly linearly with amplitude for majority of the cyclic loading conditions, although in some cases, the slope of these lines was observed to increase slowly with amplitude. On the other hand, this depth increases asymptotically with no. of cycles. For higher amplitudes and no. of cycles, the depth of separation was as high as about 23% of the embedded pile length.
0.05 0.10 0.15 0.20 0.25
10 20 30 40 50
Amplitude (%)
N
o
rm
a
li
z
e
d
d
e
p
th
o
f
s
e
p
a
ra
ti
o
n
z
/L
100 100
250 250
500 500
750 750
1000 1000
Frequency : 5 c.p.m.
No. of cycles : Free head Fixed head
Figure 20 Variation of the depth of soil pile separation with amplitude.
4.3 Influence of stiffness and eccentricity on cyclic lateral response
0.05 0.10 0.15 0.20 0.25
0 300 600 900
No. of cycles
N
o
rm
a
li
z
e
d
d
e
p
th
o
f
s
e
p
a
ra
ti
o
n
z
/L
A=25%; P1;
A=30%; P2;
A=40%; P1; Frequency : 5 c.p.m.
A : Amplitude.
P1 : Free head; P2 : Fixed head.
Figure 21 Variation of Variation of the depth of soil pile separation with no. of cycles. Table 3 Values of degradation factor for different L/d and e/d ratios.
L/d e/d
0.0 0.2 0.5 1.0 2.0 5.0 10.0
10 0.829 * 0.829 0.828 0.827 0.823 0.817 0.727
0.752 $ 0.765 0.765 0.751 0.750 0.746 0.746
15 0.825 0.812 0.811 0.812 0.811 0.809 0.804
0.771 0.791 0.777 0.777 0.791 0.709 0.789
20 0.812 0.812 0.811 0.812 0.811 0.798 0.796
0.776 0.806 0.793 0.793 0.793 0.793 0.791
25 0.813 0.801 0.813 0.800 0.801 0.801 0.801
0.766 0.797 0.796 0.796 0.796 0.796 0.782
30 0.817 0.817 0.817 0.817 0.817 0.819 0.820
0.785 0.800 0.800 0.800 0.787 0.787 0.773
40 0.836 0.836 0.837 0.837 0.837 0.839 0.841
0.820 0.807 0.807 0.807 0.807 0.807 0.807
50 0.863 0.853 0.863 0.854 0.855 0.856 0.858
0.840 0.836 0.836 0.836 0.836 0.836 0.837
* Normal font for free headed pile.
$ Italized font for fixed headed pile.
Cyclic loading parameters : No. of cycles = 1000; Frequency = 5 cycles per minute; Cyclic load amplitude = 20%.
It has been observed from Tab. 3 that the values of degradation factor varied from a highest vale of 0.863 indicating less deterioration in soil-pile interactive performance to as low as 0.709 inducing remarkable loss in axial pile capacity. For identical values of cyclic loading parameters and pile geometry, the degradation of free headed pile is observed to be less in comparison with that for fixed headed pile.
0.78 0.8 0.82 0.84 0.86 0.88
0 20 40 60
L/d ratio
D
e
g
ra
d
a
ti
o
n
f
a
c
to
r
0.0 0.2 0.5
1.0 2.0 5.0
e/d ratio :
Free headed pile. No. of cycles = 100. Frequency = 5 c.p.m. Amplitude = 20%.
(a)
0.70 0.75 0.80 0.85 0.90
0 20 40 60
L/d ratio
D
e
g
ra
d
a
ti
o
n
f
a
c
to
r
0.0 0.2 0.5
1.0 2.0 5.0
10.0 e/d ratio :
Fixed headed pile. No. of cycles = 100. Frequency = 5 c.p.m. Amplitude = 20%.
(b)
Figure 22 Variation of degradation factor with L/d ratio for pile head condition (a) free. (b) fixed.
0.75 0.80 0.85
0 3 6 9 12
e/d ratio
D
e
g
ra
d
a
ti
o
n
f
a
c
to
r
L/d=10;P1 L/d=20; P2
L/d=25; P2 L/d=15; P1
L/d=20; P1
P1:Free head; P2: Fixed head.
No. of cycles = 100; Frequency = 5 c.p.m. Amplitude = 20%
Figure 23 Variation of degradation factor with e/d ratio.
linearly. The value of L/d ratio at which the degradation factor attains minimum value has
been observed to lie in the range of 15-25. Under fixed head condition, on the other hand, the degradation factor was observed to initially increase to a maximum value, thereafter decrease to a minimum value, and then further increases. These maximum and minimum values were
found to occur at L/dratio between 15-20 and 20-30 respectively. In the initial stage when
L/d ratio increases, the depth of soil-pile separation is expected to increase as well up to an optimum limit. Further increment inL/dratio does not affect the depth of separation signifi-cantly but likely to increase the soil degradation factor resulting from notable reduction in the nodal strain due to reduced pile displacement at greater depth. This possible reason, coupled with head fixity in case of fixed headed pile, has initiated this peculiar pattern of variation of degradation factor withL/dratio.
to decrease fairly linearly for e/d > 2. Understandably, the increment in load eccentricity induces greater moment at pile head which in turn increases the soil-pile separation as well as soil degradation and thus the degradation factor reduces.
It may be observed from the above cyclic analysis that for a specified cyclic loading pa-rameters and pile geometry, the degradation factor for fixed headed pile is slightly higher as compared to that under free headed pile but without much difference. Possibly this is be-cause of lesser cyclic nodal displacements of piles due to hear fixity. But since the amplitudes are expressed in terms of percent of lateral static loads and not in their absolute values, the deviation is not remarkable.
It is hereby mentioned that actually the stress-strain relationship of soil is purely non-linear. But in the analytical methodology described herein, the soil has been idealized as an elastic-perfectly plastic material. This deviates from the initial assumption of Mindlin’s equation, especially when lateral load approaches the ultimate value. Also, the cyclic response of the pile-soil system is governed by shakedown phenomenon coupled with soil degradation and effect of strain rate and therefore quite complex in nature. These factors might have influenced the results to some extent and thus in some cases, the curves obtained from cyclic analysis are of somewhat irregular pattern. However, the entire work frames a significant guideline to understand the influence of relative pile-soil stiffness and load-eccentricity on the performance of cyclically loaded single pile in clay.
Based on detailed analysis and interpretation, the author has developed a design philosophy associated with curves and charts for offshore concrete piles where the approach is to estimate suitable values of L/d and e/dratios for maximum possible degradation factor under a given frequency and amplitude. The detail of this design methodology has been submitted elsewhere for publication.
5 CONCLUSION
Although considerable research works were carried out on cyclic lateral response of piles, investigations on the influence of relative pile-soil stiffness and load eccentricity is quite limited. The entire work frames a significant guideline to understand the influence of Krc and e/d on the performance of cyclically loaded single pile in clay. A prototype concrete pile embedded in a medium soft clay bed with linearly increasing soil modulus was considered and analysis was carried out. Initially, the influence of pile-soil stiffness and load eccentricity on lateral static response was studied. This was followed by investigation on the effect of cyclic loading parameters on post-cyclic axial response of the pile and further analysis was done to study the influence ofL/dand e/dratios on post-cyclic axial pile response.
From the entire investigation, the following theoretical conclusions may be drawn :
1. The ultimate lateral pile capacity was observed to be significantly affected by alteration in the relative pile-soil stiffness and load eccentricity.
and fairly linearly. But whenever a certain value of L/dratio was attained, the slope of the curves suddenly decreased. For further increase in L/dratio, the slope of the curves gradually diminished. This critical value of L/dratio varied in the ranges of 30-40.
3. From the plot of normalized ultimate lateral pile capacities againstKrc, the capacity was observed to decrease quite sharply at initial stage, but gradually assumed an asymptot-ically stabilizing tendency at higher values of Krc.
4. The lateral ultimate capacity of the piles decreased with increase in e/d ratio approxi-mately linearly although in case of free headed pile, a tendency of lateral bearing capacity failure was noted.
5. The value of the capacity factor drastically dropped down for initial valuesL/dratio and reached a minimum limit. Thereafter, the curves again sloped in the upward direction and asymptotically stabilized for higher values of L/dratio. The value of L/d ratio at which the curves attained minimum limits was observed to lie in the range of 20-25. The capacity factor was observed to increase fairly linearly with e/dratio.
6. Lateral cyclic loading introduces degrading effect on axial capacity of pile. In extreme cases, it may lead to disastrous consequences producing as high as 32% loss in capacity. The degree of such deterioration is strongly dependant upon the values of A and B parameters of the soil.
7. As observed from theoretical analysis, the degradation factor decreases with no. of cycles and increases with frequency asymptotically. The degradation factor was observed to decrease in parabolic manner with amplitude as well.
8. It was observed that although the depth of pile-soil separation was not affected by the variation in frequency, the same was affected significantly with no. of cycles and ampli-tude. The normalized depth of soil-pile separation was found to increase fairly linearly with amplitude for the majority of the cyclic loading conditions, although in some cases, the slope of these lines was observed to increase slowly with amplitude.
9. The depth of soil-pile separation theoretically increased asymptotically with no. of cycles. For higher amplitudes and no. of cycles, the depth of separation was as high as about 23% of the embedded pile length.
10. It has been observed that under free head condition, the degradation factor initially de-creases quite sharply withL/dratio to a certain minimum value and thereafter increases
fairly linearly. The value of L/dratio at which the degradation factor attains minimum
value has been observed to theoretically lie in the range of 15-25. Under fixed head condition, the degradation factor was observed to initially increase to a maximum value, thereafter decrease to a minimum value, and then further increases. These maximum and
11. With alteration in e/d ratio, the degradation factor has been observed to decrease fairly linearly fore/d>2.
References
[1] P. K. Banerjee and T. G. Davies. The behaviour of axially and laterally loaded pile groups.Geotechnique, 28(3):309– 326, 1978.
[2] S. Basack. Behaviour of pile under lateral cyclic load in marine clay. PhD thesis, Jadavpur University, Calcutta, India, 1999.
[3] S. Basack. Effect of lateral cyclic loading on axial response of pile foundation. Final Technical Report of AICTE-CAYT Project Report No. AICTE/AM/SB/164/REPORT/FINAL, Bengal Engineering and Science University, Howrah, India, 2007.
[4] S. Basack. A boundary element analysis of soil-pile interaction under lateral cyclic loading in soft cohesive soil.Asian Journal of Civil Engineering (Building and Housing), 9(4):377–388, 2008.
[5] S. Basack and R. D. Purkayastha. Behaviour of single pile under lateral cyclic load in marine clay. Asian Journal of Civil Engineering (Building and Housing), 8(4):446–460, 2007.
[6] D. A. Bouzid, B. Tiliouine, and P. A. Vermeer. Analysis of piled footing under horizontal loading with emphasis on the effect of interface characteristics. InFirst Euro Mediterranean Conference on Advances in Geomaterials and Structures, pages 693–701, Hammamet, Tunisia, 2006.
[7] B. B. Broms. Lateral resistance of pile in cohesive soils. Journal of Soil Mechanics & Foundation Division, ACSE, 90(2):27–63, 1964.
[8] A. R. Chaudhry. Static Pile-Soil-Pile Interaction in Offshore Pile Group. PhD thesis, University of Oxford, U.K., 1994.
[9] G. J. Dyson. Lateral loading of piles in calcareous sediments. PhD thesis, Department of Civil and Resource Engineering, University of Western Australia, Perth, Australia, 1999.
[10] I. M. Idriss, R. D. Singh, and R. Dobry. Non-linear behaviour of soft clay during cyclic load. Jnl. of Geotechnical Engineering, ASCE, 12(104):1427–1447, 1978.
[11] A. P. Kooijman. Numerical Model for Laterally Loaded Piles and Pile Groups. PhD thesis, Faculty of Civil Engi-neering, Technical University of Delft, Netherlands, 1989.
[12] H. Matlock. Correlations for design of laterally loaded piles in soft clay. In2nd Offshore Technology Conference, pages 577–594, Houston, USA, 1970. Paper No. OTC 1204.
[13] R. D. Mindlin. Force at a point in the interior of a semi infinite solid. Physics, 7(195), 1936.
[14] S. Narasimha Rao, Y. V. S. N. Prasad, and C. Veeresh. Behavior of embedded model screw anchors in soft clays. Geotechnique, 4(43):605–614, 1993.
[15] H. G. Poulos. Single pile response to laterally cyclic load. Journal of Geotechnical Engineering, ASCE, 108(GT-3):355–375, 1982.
[16] H. G. Poulos and E. H. Davis.Pile foundation analysis and design. Wiley, New York, 1980.
[17] R. D. Purkayastha and S. Dey. Behaviour of cyclically loaded model piles in soft clay. In2nd International Conference on Recent Advances in Geotechnical Earthquake Engineering and Soil Dynamics, University of Missouri-Rolla, USA, 1991.
[18] M. F. Randolph. Ratz version 4-2: load transfer analysis of axially loaded piles. School of Civil and Resource Engineering, University of Western Australia, 2003.
[19] Substructure preliminary foundation design — goodwyn ‘a’ project. Technical Report Job No. 08043-073-071, Centre for Offshore Foundation Systems, University of Western Australia, 1988. On behalf of Woodside Offshore Petroleum Pty. Ltd., Dames & Moore.
![Figure 1 Comparison of theoretical load-defection response of pile with available field test results and FEA analysis of Kooijman [11].](https://thumb-eu.123doks.com/thumbv2/123dok_br/18884323.423467/4.892.294.647.563.825/figure-comparison-theoretical-defection-response-available-analysis-kooijman.webp)

![Figure 6 Comparison of computed load-deflection response of single pile with available field test results of UWA - Dames & Moore [19].](https://thumb-eu.123doks.com/thumbv2/123dok_br/18884323.423467/7.892.263.581.222.425/figure-comparison-computed-deflection-response-single-available-results.webp)
![Figure 9 Comparison of computed static and cyclic pile bending moments (with assumed degradation model) with available experimental results of Dyson [9].](https://thumb-eu.123doks.com/thumbv2/123dok_br/18884323.423467/8.892.299.646.744.923/figure-comparison-computed-bending-moments-degradation-available-experimental.webp)