Reveals High Genetic Diversity and Contrasting
Recombination Patterns
Sergio A´ lvarez-Pe´rez*¤, Clara de Vega, Carlos M. Herrera
Estacio´n Biolo´gica de Don˜ana, Consejo Superior de Investigaciones Cientı´ficas (CSIC), Sevilla, Spain
Abstract
The genetic and evolutionary relationships among floral nectar-dwellingPseudomonas‘sensu stricto’ isolates associated to South African and Mediterranean plants were investigated by multilocus sequence analysis (MLSA) of four core housekeeping genes (rrs,gyrB,rpoBandrpoD). A total of 35 different sequence types were found for the 38 nectar bacterial isolates characterised. Phylogenetic analyses resulted in the identification of three main clades [nectar groups (NGs) 1, 2 and 3] of nectar pseudomonads, which were closely related to five intrageneric groups:Pseudomonas oryzihabitans(NG 1);P. fluorescens,P. luteaandP. syringae(NG 2); andP. rhizosphaerae(NG 3). Linkage disequilibrium analysis pointed to a mostly clonal population structure, even when the analysis was restricted to isolates from the same floristic region or belonging to the same NG. Nevertheless, signatures of recombination were observed for NG 3, which exclusively included isolates retrieved from the floral nectar of insect-pollinated Mediterranean plants. In contrast, the other two NGs comprised both South African and Mediterranean isolates. Analyses relating diversification to floristic region and pollinator type revealed that there has been more unique evolution of the nectar pseudomonads within the Mediterranean region than would be expected by chance. This is the first work analysing the sequence of multiple loci to reveal geno- and ecotypes of nectar bacteria.
Citation:A´lvarez-Pe´rez S, de Vega C, Herrera CM (2013) Multilocus Sequence Analysis of Nectar Pseudomonads Reveals High Genetic Diversity and Contrasting Recombination Patterns. PLoS ONE 8(10): e75797. doi:10.1371/journal.pone.0075797
Editor:Martin Heil, Centro de Investigacio´n y de Estudios Avanzados, Mexico
ReceivedJuly 3, 2013;AcceptedAugust 20, 2013;PublishedOctober 8, 2013
Copyright:ß2013 A´lvarez-Pe´rez et al. This is an open-access article distributed under the terms of the Creative Commons Attribution License, which permits unrestricted use, distribution, and reproduction in any medium, provided the original author and source are credited.
Funding:This work was supported by funds from Consejerı´a de Innovacio´n, Ciencia y Empresa, Junta de Andalucı´a (Proyecto de Excelencia P09-RNM- 4517 to C.M.H.), and Ministerio de Ciencia e Innovacio´n (Juan de la Cierva Program to C.dV.). The funders had no role in study design, data collection and analysis, decision to publish, or preparation of the manuscript.
Competing Interests:The authors have declared that no competing interests exist.
* E-mail: [email protected]
¤ Current address: Hospital General Universitario ‘‘Gregorio Maran˜o´n’’, Department of Clinical Microbiology and Infectious Diseases, Madrid, Spain
Introduction
Microorganisms find in plants heterogeneous and highly dynamic habitats which can differ widely with regard to nutrient availability and physico-chemical conditions at macro- and microscales [1]. Immigration history and different ecological and selective forces operating at each microhabitat can influence microbial presence and community composition [2–4], thus turning plant individuals into dynamic mosaics of host–microor-ganism assemblages.
Most previous studies on plant microbiology have focused on describing the astonishing diversity of prokaryotic and eukaryotic microorganisms occurring in the rhizosphere and the phyllo-sphere, and their direct and indirect effects on host fitness, community structure and dynamics, and evolutionary processes of host plants [3,5–7]. The importance of other plant parts as microbial habitats remains yet underexplored, but important advances in their study have been made in recent years. In this sense, an emerging focus of plant research is the role of floral nectar as a natural habitat for microorganisms, and their ecological function. Most of these studies have dealt with nectar-dwelling yeasts [4,8–15], but the role of nectar as a reservoir for bacterial diversity, and the possible influence of bacteria on plant fitness, have been also considered recently [16–21].
Floral nectar is complex biological fluid, mainly containing sugars and amino acids that provide a key reward to pollinators. Traditionally, nectar has been considered protected from microorganisms by a high osmotic pressure due to the elevated sugar concentration, a variety of secondary compounds, reactive oxygen species and several proteins with a defence function against microbial invasion [22–26]. However, some groups of yeasts and bacteria can overcome such chemical barriers and colonise floral nectar. Through their metabolic activity, these microorganisms can reduce the nutritional value of floral nectar and release different fermentation by-products, which could have a significant effect on pollinators’ foraging behaviour [9,10,14,21,27,28]. The few yeast and bacterial nectarivorous communities studied so far seem to be characterised by low species richness and moderate phylogenetic diversity, suggesting that only some highly-specialised lineages can cope with the array of limiting factors of microbial growth found in floral nectar [12,13,16,18–20,22,29]. One of the lineages of nectar-inhabiting bacteria that have overcome the chemical and osmotic barriers of nectar is the genusPseudomonas.
and with rather simple nutritional requirements [31–33]. Pseudomonas species thrive in most known natural environments, where they play relevant roles for the functioning of ecosystems and can establish intimate associations with animal and/or plant hosts [31,32,34–36]. Some members of this genus have been recently recovered from floral nectar of cultivated [17] and wild plants [16,18–20], but a detailed analysis of the diversity and ecological significance of the nectar pseudomonads is still pending.
In this study, we explored the phylogenetic and evolutionary relationships among nectar-inhabiting pseudomonads associated to Mediterranean and South African insect-pollinated plants. To this end, a collection of 38 nectar Pseudomonas isolates was characterised by multilocus sequence analysis (MLSA) targeting core housekeeping genes. The relative contribution of mutation and recombination in shaping the diversity ofPseudomonasin floral nectar was assessed. Finally, relevant ecological information was used to infer possible evolutionary links among the identified clades. This is the first work analysing the sequence of multiple loci to reveal geno- and ecotypes of nectar bacteria.
Materials and Methods
Ethics Statement
Field work for this and other related studies (see below) was conducted in several publicly-owned, protected areas in Spain and South Africa, under permits issued by Direccio´n General de Sostenibilidad en la Red de Espacios Naturales (Consejerı´a de Medio Ambiente, Junta de Andalucı´a, Spain), Direccio´n General de Gestio´n del Medio Natural (Consejerı´a de Medio Ambiente, Junta de Andalucı´a, Spain), Iltmo. Ayuntamiento de Hinojos (Huelva, Spain) and Ezemvelo KZN Wildlife (KwaZulu-Natal province, South Africa). Field sampling only involved one protected plant species (Echium gaditanum, Boraginaceae) for which we obtained the collecting permit 1005/MDCG/mect from Direccio´n General de Sostenibilidad en la Red de Espacios Naturales (Consejerı´a de Medio Ambiente, Junta de Andalucı´a, Spain).
Bacterial Isolates
A collection of 38 Pseudomonas ‘sensu stricto’ isolates was included in the present study (Table S1). These isolates were recovered from 30 floral nectar samples of 14 phylogenetically diverse, animal-pollinated wild plant species collected in five western Mediterranean and South African plant communities (22 and 16 isolates in each region, respectively) following the methods described by A´ lvarez-Pe´rez et al. [16]. Except for Convolvulus althaeoides(Convolvulaceae), which seems to be a particularly well-suited host forPseudomonasand other prokaryotic microorganisms [18], the number of isolates recovered from the other 13 plant species included in the present study was very similar (mean = 1.9 isolates/plant species, range = 1–3).
Thirty-five of the studied isolates were from previous studies, in which the genusPseudomonaswas recovered from 16.2231.6% of nectar drops that yielded culturable bacteria [16,18]. The remaining three isolates were recovered from new nectar samples from the same sampling sites (de Vega et al., unpublished data). All bacterial isolates were grown on trypticase soy agar (TSA; Panreac, Castellar del Valle`s, Spain) plates at 25uC and stored at – 20uC in Luria-Bertani (LB) broth (Difco, Sparks, MD, USA) containing 25% glycerol (Sigma-Aldrich, Madrid, Spain) until further characterisation.
PCR Amplification and Sequencing of Selected Loci Genomic DNA was isolated by boiling bacterial colonies in 500ml of ultrapure deionised water at 100uC for 20 min. Cell debris was removed by centrifuging at 8000gfor 2 min.
Four core housekeeping genes were selected for sequence analysis: the 16S rRNA gene (rrs);gyrB, which encodes for theb subunit of the DNA gyrase; andrpoBandrpoD, which encode for theb and D subunits of the RNA polymerase, respectively. All these molecular markers are ubiquitous in bacteria and have been used in a recent comprehensive assessment of the intrageneric structure of the genusPseudomonas[37].
PCR primers used for partial amplification of the studied genes are shown in Table S2. Therrsgene was amplified using the same reaction mixtures and PCR conditions than in A´ lvarez-Pe´rez et al. [16]. For thegyrB,rpoBandrpoDgenes, a typical PCR contained 5ml of NH4 buffer (106, Bioline, London, UK), 1 to 2 mM MgCl2 (Bioline), 0.4 to 0.5mM of each primer (Sigma-Aldrich; Table S2), 250mM of each dNTP (Sigma-Aldrich), 1.5 to 2.5 U Biotaq DNA polymerase (Bioline), and 2 to 5ml of DNA extract in a final volume of 50ml. The same basic protocol was used to amplify these three genes, with some variations in the annealing temperature (Ta) and number of cycles. Following an initial denaturation step of 5 min at 94uC, 35 or 40 PCR cycles were performed (94uC for 30–60 s, Ta for 30–60 s, 72uC for 90–120 s), followed by a final extension step at 72uC for 10 min. The annealing temperature used for each primer pair can be seen in Table S2. PCR products were cleaned up with ExoSAP-IT (USB Corporation, Cleveland, OH, USA) and two-way sequenced using the ABI Prism BigDye Terminator v3.0 Ready Reaction Cycle Sequencing Kit (Applied Biosystems, Madrid, Spain) with the corresponding primers on an automated sequencer (ABI Prism 3130xl, Applied Biosystems). The nucleotide sequences deter-mined in this work have been deposited in the GenBank database under the accession numbers KC822762 to KC822913 (see Table S1 for further details).
Sequence Assembly and Alignment
DNA sequences were assembled and manually edited with the program Sequencher v.4.9 (Gene Codes Corporation, Inc., Ann Arbor, MI, USA) and included in multiple alignments generated by MUSCLE (http://www.ebi.ac.uk/Tools/msa/muscle/, [38]). For therpoDgene, the edited DNA sequences were translated to protein sequences with the Transeq program (http://www.ebi.ac. uk/Tools/st/emboss_transeq/, [39]) before performing the MUS-CLE alignment, and then back-translated to the nucleotide alignment using TranslatorX (http://translatorx.co.uk/, [40]). The resulting alignments were trimmed with BioEdit v.7.0.9.0 [41] to ensure that all sequences had the same start and end point, and analysed with Gblocks v.0.91b [42] to eliminate poorly aligned positions and divergent regions, using ‘allow gap positions = with half’, ‘minimum length of a block’ equal to 5 for therrsgene and 10 for protein-encoding genes, and default settings for all other options.
Analysis of Nucleotide Diversity
non-synonymous substitutions (dN; resulting in a different amino acid) and synonymous substitutions (dS; resulting in the same amino acid) was computed using the Sequence Type Analysis and Recombinational Tests (START) v.2 program [45].
Phylogenetic Reconstruction
Phylogenetic trees for each individual gene and their concat-enation (in the following order: rrs, gyrB, rpoB and rpoD) were constructed using Bayesian inference (BI) and maximum likelihood (ML) methods.
BI analyses were performed with MrBayes v.3.1.2 [46]. The simplest models of sequence evolution among those available in MrBayes that best fitted the sequence data were determined using the Akaike Information Criterion (AIC). These tests were conducted using the jModeltest v.0.1.1 package [47], and resulted in selection of a general time-reversible model with gamma-distributed rate variation across sites and a proportion of invariable sites (GTR+G+I) in all cases. Four Metropolis-coupled Markov chains were run twice for all the datasets, until average standard deviation of split frequencies fall below 0.01 (1?106– 2.2?106 generations). The chains were sampled each 100 generations and chain temperature was set to 0.2. Fifty percent majority rule consensus trees were calculated using the sumt command and discarding the first 25% of the trees to yield the final Bayesian estimates of phylogeny. Posterior probabilities (PP) from the 50% majority rule consensus trees were used as estimates of robustness.
ML analyses were carried out using the online version of PhyML v.3.0 (http://www.atgc-montpellier.fr/phyml/, [48]), under the GTR+G+I model of molecular evolution, with four substitution rate categories, starting trees generated by BIONJ, and SPR tree search algorithms. Model parameters were estimated from the dataset and support for the inferred topologies was tested using 100 bootstrap replications.
The Shimodaira–Hasegawa (SH) test [49], which determines the likelihood of a dataset given alternative trees, was used to test phylogenetic congruence between trees. This analysis was performed with TREE-PUZZLE v.5.2 [50], and tree topologies withp-values,0.05 were considered to be incongruent with the dataset under analysis.
Taxonomy of Nectar Isolates
In order to determine the taxonomic affiliation of nectar Pseudomonas isolates, the EzTaxon-e server (http://eztaxon-e. ezbiocloud.net/, last accessed 28 Mar. 2013; [51]) was used to search for neighbours among validly named bacterial species on the basis ofrrsgene sequences.
Additionally, an alignment of concatenated (rrs+gyrB+rpoB+rpoD) sequences from nectar isolates and 34 reference strains of Pseudomonas (Table S3) was generated by MUSCLE and further analysed with Gblocks following the same procedure as above. A phylogenetic tree was then inferred from this alignment by the neighbour-joining (NJ) method [52], using the Molecular Evolu-tionary Genetics Analysis (MEGA) v.5 program [53]. EvoluEvolu-tionary distances were computed by the Jukes-Cantor (JC) method [54], and the rate of variation among sites was modelled by a gamma distribution, with shape parameters set at the values estimated by PhyML. All ambiguous positions were removed for each sequence pair and 1000 bootstrap replications were used to infer consensus trees. A concatenation of sequences of the studied genes corresponding to the type strain of Cellvibrio japonicus (Table S3) was used to root the tree. Branch support of the NJ tree was also evaluated by the ML and BI methods, which were performed as explained above. Interpretation of the resulting clades and their
intrageneric relationships was in accordance with the recently published overview of genusPseudomonasclassification [37].
Split Decomposition and Recombination Analyses To assess the possibility of reticulate evolution (i.e. networked relationships pointing to incompatibilities within and between datasets), split networks of single-loci and the concatenated dataset were constructed with SplitsTree4 [55] by the Split decomposition method, using default options. For ideal data, this method results in tree-like representations, whereas network-like structures can be interpreted as possible evidence for conflicting phylogenies [56].
The possible presence of recombination in the studied genes was first assessed by the pairwise homoplasy index (PHI) test [57] as implemented in Splitstree4. Furthermore, potential recombination events were identified using the Recombination Detection Program (RDP) v.3.44 [58]. This program implements several methods for the identification of recombinant sequences and recombination breakpoints, of which we chose the seven following ones: RDP [59], BootScan [60], MaxChi [61], Chimaera [62], GeneConv [63], SiScan [64] and 3Seq [65]. Only recombination events that were identified by more than three methods were accepted as evidence of recombination and kept for detailed analyses; a similar conservative approach has been used by other authors [e.g. 66]. In all methods, sequences were considered as linear and statistical significance was set at thep,0.05 level, after considering Bonferroni correction for multiple comparisons. Other common settings were to require phylogenetic evidence, to polish breakpoints, to check alignment consistency, to disentangle overlapping signals and to automask sequences for optimal recombination detection. Potential major and minor parents of recombinant sequences were determined whenever possible.
Linkage disequilibrium was evaluated from allelic data using the standardised index of association (IAS) method, as implemented in
LIAN v3.5 [67]. The null hypothesis of complete linkage equilibrium (i.e. free recombination among sequences; IAS= 0)
was tested by both parametric and Monte Carlo methods (1000 resamplings).
The LDhat module [68] available within RDP was used to estimate recombination and mutation rates (randh, respectively) both for single loci and concatenated sequences. To estimate the initial value ofr, a first preliminary run was set up withr= 30. Then, the previously determinedrwas used as a starting value for subsequent runs. Converging results with a reduction of confidence intervals for the estimated parameters were typically obtained with block penalty values of 30, but other values (10, 20 and 40) were also tested. All other settings were kept as default, and analyses where run with 106 Monte Carlo Markov Chains (MCMC) updates including 105burn-in MCMC updates.
Unifrac Analyses
performed pooling the unique branches for all the environments in the tree or considering each particular environment individually (‘all environments together’ and ‘each environment individually’ options, respectively), with 100 permutations and p-values corrected for multiple comparisons (Bonferroni correction).
On the other hand, we tentatively assessed possible differences in thePseudomonascommunities associated to different pollinators (at the order level: Coleoptera, Diptera, Lepidoptera or Hyme-noptera). In this case, UniFrac analyses were performed as described above, but using the list of pollinator types under analysis (Table S4) as environment information. However, due to the limited number of Pseudomonas isolates recovered from most plant species, host-based UniFrac analyses were not performed.
Results
Sequence Variation in Core Housekeeping Genes The genetic diversity indices calculated from the multilocus data for the whole collection of nectar isolates characterised in this study are shown in Table 1. The length of the sequences analysed ranged from 369 bp for rpoBto 1389 for therrs gene (Table 1). From 38 isolates, 35 different haplotypes (STs) were found. The mean number of haplotypes per locus was 25.5 and ranged from 15 (for rrs) to 31 (rpoD) (Table 1). TherpoD gene exhibited the highest proportion of polymorphic sites (50.8%), followed bygyrB (36.8%) andrpoB(30.1%). Only 95 polymorphic sites (6.8%) were identified in the rrs sequences. Nucleotide diversity (p) varied widely across genes for the entire collection of nectar isolates (between 0.029 and 0.232, forrrsandrpoD, respectively; Table 1). The G+C content of the four gene fragments was similar, and ranged from 53.6% (forrrs) to 62.9% (forrpoD). Tajima’s D values did not deviate significantly from zero in any case (p.0.05), thus suggesting that the studied genes were not subject to selection. The ratio between the number of non-synonymous and synonymous substitutions (dN/dS) for the three protein encoding genes analysed was below 1 in all cases (Table 1).
Phylogeny of Nectar Isolates
The trees based on the concatenation of the four genes analysed (2778 bp in total) grouped the 38 nectar isolates into three major clades, hereafter referred to for convenience as ‘nectar groups’ (NGs) 1, 2 and 3. NGs 1 and 3 were well supported by both ML and BI analyses (100% ML bootstrap support and .0.9 BI posterior probability, in both cases; Fig. 1). ML and BI support for NG 2 was weak, although it included a highly supported subclade (NG 29, Fig. 1). NGs 1 and 2 comprised nectar isolates recovered from both South African and Mediterranean plants, while NG 3 included exclusively isolates from the Mediterranean (6 of the 13
isolates recovered fromC. althaeoidesand 1 of the 2 isolates from E. gaditanum).
Individual ML trees constructed from each independent gene also supported NGs 1 and 3, but not NG 2 nor 29(except forrpoD; Fig. S1). Other smaller subgroups could be recognised within NG 2 but, to simplify subsequent analyses, these were not considered. The NGs defined from phylogenetic analyses displayed extensive variation in their nucleotide diversity indices for the studied genes, with the highest values being observed for NG 2 and the lowest for NG 3 (Table S5).
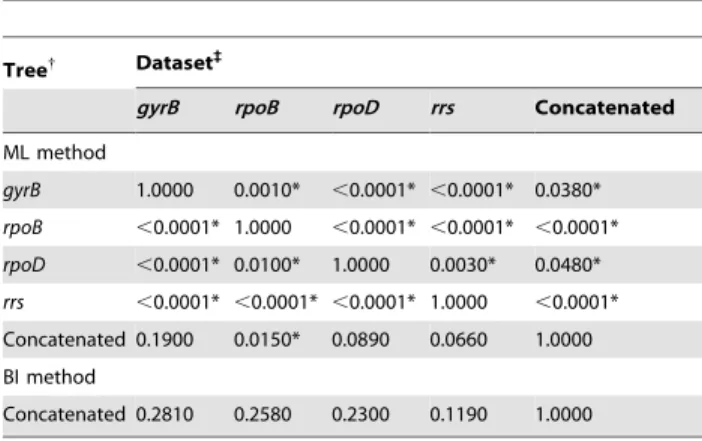
The results of the SH test performed on individual gene sequences and on the concatenated dataset showed that most ML trees were incongruent with each other but, except forrpoB, were not significantly different from the ML tree based on the alignment of concatenated sequences (Table 2). Furthermore, all datasets supported the tree obtained by the BI method for the concate-nation of individual loci (Table 2). Therefore, although the studied genes may not exhibit the same evolutionary history, in general terms the trees based on the alignment of concatenated sequences did not contradict the information brought by each individual locus.
Network and Recombination Analyses
The information obtained for all individual genes and the concatenated dataset by split decomposition suggested some degree of reticulation (i.e. conflicting phylogenetic signals) forrrs, but not forgyrB, rpoB and rpoDdatasets or the concatenation of individual sequences (Fig. S2).
The PHI test showed evidence of recombination forrrsand the concatenation of genes (p,0.001, in both cases), while significant intragenic recombination (p,0.05, detection by.3 methods) was only detected in RDP analyses for rrs and gyrB, with a single recombination event identified for each gene (Table 3). Nearly all recombinant sequences for both genes corresponded to NG 3 isolates (7 of 9 forrrsand 6 of 7 forgyrB; Table 3), with only a few recombinants belonging to NG 2 isolates (2 of 9 and 1 of 7, respectively). Regarding region of origin, all recombinants except one originated from the Mediterranean area. The putative major parents of all recombinant sequences were in NG 29, while the minor parent belonged to NG 1 forrrsand remained unknown for gyrB.
The four loci analysed displayed per site recombination/ mutation rate ratios (r/hw) below 1 (between 0.232 and 0.624,
forrpoDandgyrBrespectively; Table S6), suggesting that mutation occurred more often than recombination in these genes. Accord-ingly, ar/hw ratio ,1 was also observed for the concatenated
dataset (0.190, Table S6).
Table 1.Analysis of the studied loci for the 38 nectar isolates ofPseudomonascharacterised in this study.
Locus
Fragment length (bp)
Number of haplotypes
% Polymorphic
sites* p{ %G+C dN/dS`
Tajima’s D"
gyrB 495 29 36.8 0.140 56.8 0.107 0.312
rpoB 369 27 30.1 0.101 59.8 0.056 –0.207
rpoD 525 31 50.8 0.232 62.9 0.511 0.434
rrs 1389 15 6.8 0.029 53.6 NA 1.816
*Excluding gaps and missing data.
{Nucleotide diversity (average number of nucleotide differences per site between two sequences [98]), after Jukes and Cantor correction.
`
Ratio between the numbers of non-synonymous and synonymous substitutions (dN and dS, respectively). NA, not applicable. "
When the null hypothesis of linkage equilibrium was tested for the 38 nectar isolates and for different groups (defined by geographic or phylogenetic criteria; Table 4), it was rejected in
all cases except for NG 3 isolates. Most of these groups also displayed per siter/hwratios,1 for the concatenated dataset but,
Figure 1. Maximum likelihood (ML) consensus tree from concatenated (rrs+gyrB+rpoB+rpoD) sequences of nectar-inhabiting
Pseudomonasisolates.Bootstrap percentages from ML analysis are shown above lines, and clades with Bayesian posterior probabilities$0.9 are indicated by thick brown lines. The small phylogram is included to illustrate branch length heterogeneity (scale bar = 0.1 nucleotide substitutions per site). The geographic origin of isolates is shown on the leaves: Mediterranean, filled squares; South African, empty squares. Plant hosts and their corresponding families are also indicated, with abbreviations for the latter shown in parentheses. Insect pollinators associated to each plant species are listed in Table S4. Abbreviations for plant species names: AA:Adhatoda andromeda; AO:Ajuga ophrydis; CA,Convolvulus althaeoides; CD:Cycnium adonense; DC:Disa crassicornis; ED:Eriosema distinctum; EG:Echium gaditanum; FL:Fritillaria lusitanica; GI:Gladiolus illyricus; MG:Moraea graminicola; NP:Narcissus papyraceus; OR,Orobanche ramosa; PW,Protea welwitschii; RC,Ruellia cordata. Abbreviations for plant families: Aca, Acanthaceae; Ama, Amaryllidaceae; Bor, Boraginaceae; Con, Convolvulaceae; Fab, Fabaceae; Iri, Iridaceae; Lam, Lamiaceae; Lil: Liliaceae; Orc, Orchidaceae; Oro, Orobanchaceae; Pro, Proteaceae.
on the contrary,r/hwratios.1 were observed for NGs 2 and 3
(Table 4).
Taxonomy of the Nectar Pseudomonads
Searches on the EzTaxon-e server database of almost complete rrs gene fragments confirmed the assignment of all the studied nectar isolates to the genusPseudomonas‘sensu stricto’. However, a conclusive identification to the species level was not possible as all query sequences returned several hits with similarity values above 97% (Table S7), which is a conservative threshold commonly taken for species delimitation in bacteria [71,72].
NJ analysis of the concatenated rrs, gyrB, rpoB and rpoD sequences of the strains characterised in this study and type strains of Pseudomonas allowed the classification of the nectar isolates in different lineages, groups and subgroup (Figs. 2 and S3, and Table S8). All NG 1 isolates clustered withP. psychrotolerans, which belongs to theP. oryzihabitans group. On the other hand, isolates from NGs 2 and 3 clustered within theP. fluorescenslineage, but were close to different taxonomic groups: whereas NG 2 isolates were related to type strains from theP. fluorescens,P. lutea and P. syringae groups, all NG 3 isolates clustered with P. rhizosphaerae. NG 29 was composed by a subset of isolates from NG 2 which clustered with reference sequences from the P.
fluorescensand P. gessardi subgroups (Table S8). In general, these groupings were supported by high bootstrap values (both in NJ and ML analyses) and BI posterior probabilities (Fig. S3).
Association between the Habitat and Phylogeny of Nectar Isolates
The results of the overall UniFrac significance test (‘all environments together’ option) indicated that there was significant (p#0.01) clustering of nectar isolates in the phylogenetic tree on the basis of their biogeographic origin (Mediterranean vs.South African), and that these clusters represented a significant amount of unique branch length. In contrast, no relationship was found between the phylogeny of the nectar isolates and the array of pollinators associated to their host plants.
A subsequent analysis of Unifrac distances determined for individual habitat types (‘each environment individually’ option) confirmed the significant clustering of the nectar isolates associated to Mediterranean plants (p#0.01). On the contrary, South African isolates were not associated by more unique branch length than expected.
Discussion
Microbial diversity arises and is maintained through an intricate interplay of ecological and genetic factors [31,73]. In the case of Pseudomonas, it seems that a long evolutionary history and continual exposure to a range of spatially and temporally complex environments have resulted in an astonishing diversity of genetic lineages and ecotypes [31], some of which are well adapted to thrive in close association to plants [35,74–76]. In particular, some pseudomonads can tolerate relatively high sugar concentrations and thus colonise the sugary exudates of plants, including floral nectar [16,19,20] (but see Ref. [77]).
Following an MLSA approach, in this study we aimed to disclose the genetic diversity and phylogenetic affiliation of nectar Pseudomonas isolates recovered from different floristic regions. Subsequent analyses allowed us to assess the relative importance of mutation and recombination as evolutionary forces underlying the observed diversity of genotypes, and to propose putative ecotypes of nectar pseudomonads. All these aspects are discussed in the following paragraphs.
Genetic Diversity in a Context of Extensive Clonality A first result of the present investigation was the high genetic diversity found for all studied loci, which resulted in the identification of 35 MLSA sequence types among the 38 isolates Table 2.P-values determined using the
Shimodaira-Hasegawa (SH) test of tree topologies.
Tree{ Dataset`
gyrB rpoB rpoD rrs Concatenated
ML method
gyrB 1.0000 0.0010* ,0.0001* ,0.0001* 0.0380*
rpoB ,0.0001* 1.0000 ,0.0001* ,0.0001* ,0.0001*
rpoD ,0.0001* 0.0100* 1.0000 0.0030* 0.0480*
rrs ,0.0001* ,0.0001* ,0.0001* 1.0000 ,0.0001*
Concatenated 0.1900 0.0150* 0.0890 0.0660 1.0000
BI method
Concatenated 0.2810 0.2580 0.2300 0.1190 1.0000
{
Comparisons are based on the trees inferred by the maximum likelihood (ML) and Bayesian inference (BI) methods for individual loci or a concatenation of them.
`Tree topologies not supported (
p,0.05) by the corresponding dataset are marked by an asterisk.
doi:10.1371/journal.pone.0075797.t002
Table 3.Significant recombination events detected using the Recombination Detection Program (RDP) v.3.4.2.
Recombination event Gene Recombinants (NG*) Methods Parents (NG)
Major Minor
1 rrs PN34.1 (NG 2), PN704.1 (NG 3),
PN705.1 (NG 3), PN706.2 (NG 3), PN708.1 (NG 3), PN716.3 (NG 3), PN829.3 (NG 2), PN1008.1 (NG 3), PN1059.1 (NG 3)
RDP, GENECONV, BootScan, MaxChi, Chimaera, SiScan, 3Seq
PN195.2 (NG 29) PN708.2 (NG 1)
2 gyrB PN704.1 (NG 3), PN705.1 (NG 3),
PN706.2 (NG 3), PN708.1 (NG 3), PN716.3 (NG 3), PN1008.1 (NG 3), PN1059.2 (NG 2)
MaxChi, Chimaera, SiScan, 3Seq PN289.1 (NG 29) Unknown
analysed. Although sequencing of additional loci could have resulted in a greater discrimination of isolates, it has been recently demonstrated that the set of four core housekeeping genes included in our MLSA scheme provides enough resolution at the species level [37]. Furthermore, except for a fewPseudomonas species (such as P. aeruginosa; http://pubmlst.org/paeruginosa/), there is not yet any consensus on which markers should be used for typing isolates of this genus.
Despite the high diversity of STs observed, linkage disequilib-rium analyses yieldedIASvalues significantly greater than zero for
the whole collection of nectar isolates and most groups defined by biogeographic or phylogenetic criteria, all of which is suggestive of predominantly clonal population structure. The exception was NG 3, for which the null hypothesis of linkage equilibrium could not be rejected. Interestingly, this latter group only includedPseudomonas isolates recovered from the floral nectar of Mediterranean plants, and mainly associated to the insect-pollinated plantC. althaeoides. Convolvulus althaeoides is a nitrophilous ruderal plant, most commonly found on roadsides and disturbed patches in the Mediterranean and Macaronesic regions (but also occasionally present as an introduced species in North America), and which is visited by a wide array of insects (see Table S4). Plants of C. althaeoides located a few meters apart harboured communities of three differentPseudomonas groups, and a high diversity of other microorganisms (as shown by A´ lvarez-Pe´rez and Herrera [18]), indicating that this plant species is an interesting taxa to study nectar microbial populations.
High genetic diversity despite prevailing or exclusive clonality has been detected for different Pseudomonas species, such as P. stutzeri[78] andP. syringae[79], and for fluorescent pseudomonads that protect plants from soil-borne pathogens through the production of antifungal compounds [80,81]. A similar pattern of high genetic diversity in mostly clonal microorganisms has also been recently revealed for the nectar yeastMetschnikowia gruessii, an observation which was attributed to microsite-dependent, diver-gent selection [82]. Environmental heterogeneity coupled with variable, patch-specific selective pressures would favour the long-term persistence of different clonal lineages of nectar
microorgan-isms across different microsites, thus eventually maintaining overall genotypic diversity [82].
The Nectar Pseudomonads are Phylogenetically Diverse The combined analysis of multiple house-keeping genes strongly suggested extensive phylogenetic diversity and several origins for thePseudomonaslineages adapted to nectar conditions. Most nectar isolates (NGs 2 and 3) clustered in the consensus trees derived from multilocus sequence data with several different species belonging to theP. fluorescenslineage, which represents the largest intragenic division in terms of species number and includes different groups and subgroups for which the relative positions are not fully resolved [37,83]. On the other hand, NG 1 isolates clustered with P. psychrotolerans, which belongs to the P. oryzihabitans group. Together with P. luteola, P. pachastrellae and P. pertucinogena, this latter group has been characterised as the most phylogenetically distant from all other members of the genusPseudomonas[37].
Although the nectar isolates included in this study displayed high similarity in theirrrsgene sequence to previously described Pseudomonasspecies (Table S7), some of them clustered apart from reference strains in the phylogenetic trees (Figs. 2 and S3). Nevertheless, DNA-DNA hybridisations and other complementa-ry tests commonly used in polyphasic taxonomy would be required to confirm the phylogenetic independence of those nectar lineages and, eventually, to propose the recognition of novel bacterial taxa.
Signatures of Recombination among the Nectar Pseudomonads
Diversifying selection needs not to be the only or even the main mechanism allowing clonal bacteria to retain genetic variability, and homologous recombination can also contribute significantly to the maintenance of genomic variation in the face of clonality [84]. Nevertheless, the role of homologous gene exchange in many microbial species remains unclear, as most published studies have focused on pathogenic microorganisms [85].
In the present study, the observation of incongruences in the phylogenies inferred from partial sequences of the individual genes included in the MLSA scheme suggested the possible occurrence Table 4.Linkage equilibrium analysis and recombination and mutation indices for the nectar isolates.
Group of isolates Linkage equilibrium analysis Recombination and mutation indices`
p-value{
n* IAS Parametric Monte Carlo r"(61023) hw1(61022) r/hwm
All isolates 38 0.2977 ,0.001 ,0.001 8.028 (6.81–9.32) 4.221 0.190
Biogeographic groups
Mediterranean 22 0.3655 ,0.001 ,0.001 5.904 (4.871–7.191) 4.791 0.123
South African 16 0.3260 ,0.001 ,0.001 0.010 (0.010–0.020) 4.800 ,0.001
Phylogenetic clusters
NG 1 10 0.2085 ,0.001 0.012 0.070 (0.010–0.250) 1.175 0.006
NG 2 21 0.3165 ,0.001 ,0.001 49.810 (39.16–62.45) 3.899 1.278
NG 29 18 0.3179 ,0.001 ,0.001 17.350 (13.49–24.66) 2.882 0.602
NG 3 7 0.0867 NS NS 26.040 (18.99–35.15) 0.896 2.907
*Number of isolates included in the corresponding group.
{The null hypothesis of complete linkage equilibrium (
IAS= 0) was tested by both parametric and Monte Carlo methods (1000 resamplings). NS: not significantp-value.
`
Based on the concatenated dataset (rrs+gyrB+rpoB+rpoD). "
Rho per site (lower2upper bound, 95thpercentiles).
1Theta per site (Watterson estimator).
mRho/theta per site.
of recombination events among the nectar pseudomonads. This suggestion was further confirmed in some cases (such as therrsand gyrB genes) by split decomposition, the PHI test and/or RDP analyses. However, the number of recombination events detected in RDP analyses of individual loci was low, and mostly affected NG 3 isolates. On the other hand, ther/hwvalues indicated that
mutation occurred more often than recombination in all the genes under study. A similar result (r/hw ,1) was observed in the
analysis of the concatenated dataset for the whole collection of
nectar isolates and most biogeographic and phylogenetic groups, but not for NGs 2 and 3. Nevertheless, in the case of NG 2 the effect of recombination was only limited to a few isolates (Table 3), and seemed to be insufficient to erase all clonal structure, as evidenced by linkage disequilibrium analysis. Therefore, whereas NGs 1 and 2 seem to be mostly clonal complexes, the relative contribution of recombination is predominant over mutation in the evolution of NG 3.
Contrasting recombination patterns among closely related species or phylotypes have also been inferred for other bacteria [86–89] and eukaryotic microorganisms [90,91]. Unfortunately, comparison with bacterial taxa of similar ecology than our set of isolates could not be performed, as this is the first time that MLSA is applied to the study of nectar prokaryotes. The following two aspects, however, should be kept in mind when interpreting the results of the present study. Firstly, although our recombination analyses were based on a modest number of isolates, which presumably resulted in reduced statistical power, substantial evidence of recombination was found. And secondly, subpopula-tions of nectar pseudomonads subjected to differential local adaptation and/or genetic drift might have been lumped together, which can lead to an underestimation of the actual recombination rate [85]. In this regard, the identification of ecologically differentiated populations of microorganisms inhabiting distinct niches and potentially differing in their patterns of homologous recombination (e.g. because of adaptive evolution or environmen-tal constraints) could help to avoid confounding effects which affect the estimation of recombination rates [85].
Identifying NovelPseudomonasEcotypes in Floral Nectar Ecotypes, defined as cohesive groups of organisms that show a history of coexistence as separate, ecologically distinct lineages (as inferred from community phylogeny or other sequence-based approach) and a prognosis for future coexistence (as inferred from their ecological distinctness), are the fundamental units of bacterial ecology and evolution [92]. However, most classification systems in microbiology focus on physiological and/or genotypic traits, overlooking potential differences in ecological roles between microorganisms.
Despite their close relationship to already described species, some of the clades of nectar microorganisms identified in this study by MLSA seem to represent phylogenetically independent clusters within the genus Pseudomonas which share the ability to inhabit floral nectar. Furthermore, the results of the UniFrac significance tests revealed there has been more unique evolution of the nectar pseudomonads within the Mediterranean region than would be expected by chance.
The question which arises is if the aforementioned results are relevant enough to grant the phylogenetically-defined groups of nectar pseudomonads the status of ecotypes.
Both for NGs 1 and 2, the answer to this latter question is unclear, as within each of these groups the isolates clustered together regardless of their biogeographic origin (i.e., nectar samples collected more than 8000 km apart harboured the same Pseudomonas lineages) and type of pollinator. On the contrary, despite the relative low number of isolates analysed, our results suggest that NG 3 may represent a putative novel ecotype, as it is a phylogenetically well defined cluster of Pseudomonas isolates inhabiting the nectar of insect-pollinated Mediterranean plants and sharing a substantial level of recombination. In our view, this interesting possibility should be readdressed by future investiga-tions on the microbial ecology of Mediterranean insect-pollinated flowers.
Figure 2. Unrooted neighbour-joining (NJ) consensus tree, based on phylogenetic analysis of concatenated (rrs +gyrB+
rpoB+rpoD) sequences, displaying the relationships of nectar-inhabiting isolates (shown as red filled circles [nectar group (NG) 1], blue filled triangles [NG 2] or violet filled squares [NG 3]) and reference strains ofPseudomonas‘sensu stricto’ species (shown as numbers, see below). Nectar isolates belonging to subgroup NG 29 are shown within a dotted circle. Evolutionary distances were computed using the Jukes-Cantor method and are in the units of number of base substitutions per site.Cellvibrio japonicum Ueda107Twas used as an outgroup. A complete version of this figure is
provided as supporting information (Figure S3). Numeric codes for reference strains shown in the tree: 1,P. aeruginosaDSM 50071T; 2,P.
agariciLMG 2112T; 3,P.alcaliphilaAL15-21T; 4,P. anguillisepticaNCIMB 1949T; 5,P. aspleniiATCC 23835T; 6,P. azotoformansIAM 1603T; 7,P.
cannabinaCFBP 2341T; 8,P. chlororaphisDSM 50083T; 9,P. corrugata ATCC 29736T; 10,P. extremorientalisKMM 3447T; 11,P. flavescensB62T;
12,P. fluorescensIAM 12022T; 13,P. fragiATCC 4973T; 14,P. gessardiiCIP 105469T; 15,P. guineaeLMG 24016T; 16,P. indicaIMT37T; 17,P. jessenii
CIP 105274T; 18,P. koreensis KACC 10848T; 19,P. luteaOK2T; 20,P. mediterranea CFBP 5447T; 21, P. oleovorans IAM 1508T; 22, P.
oryzihabitans IAM 1568T; 23, P. pachastrellae KMM 330T; 24, P.
palleronianaCFBP 4389T; 25,P. pertucinogenaIFO 14163T; 26,P. poae
DSM 14936T; 27,P. psychrotoleransC36T; 28,P. putidaIAM 1236T; 29,P.
rhizosphaerae IH5T; 30, P. straminea IAM 1598T; 31, P. stutzeri ATCC 17588T; 32, P. syringaeNCPPB 281T; 33, P. tolaasiiLMG 2342T; 34,P.
xanthomarinaKMM 1447T.
Final Remarks: Floral Nectar as a Reservoir of Microbial Diversity
Our understanding of microbial biodiversity associated to flowers in natural habitats is still in an early stage, but in the last years an increasing interest has emerged with respect to the importance of nectar as a reservoir of novel microbial species. Several novel bacteria and yeast species inhabiting floral nectar have been described so far (e.g. [93–96]) and the number of new described species is expected to increase as a higher number of nectars from different angiosperm lineages are sampled.
Part of the recent upsurge in nectar microbiology research stems from the realisation that nectar microbes can play important ecological roles through their effects on plant- pollinator [9–11,21] and plant-pathogen [29,97] interactions, two key elements in the functioning of terrestrial ecosystems. In view of recent demonstra-tions of the ecological roles of nectar microbes and their widespread occurrence, it is likely that nectar microbial ecology may become a hot topic in the next years. Novel approaches will help to reveal the mechanisms that underlie biodiversity patterns in plant-associated microbial organisms and elucidate the factors controlling the presence of particular nectar microbe lineages in any particular locality. These advances will help to understand part of the complex hidden world of microbes, really far from that which Linnaeus described for the first time under the single taxon Chaos infusorium.
Supporting Information
Figure S1 Maximum likelihood (ML) trees inferred from rrs, gyrB,rpoBandrpoDsequences of 38 nectar-inhabitingPseudomonas isolates. The scale bar represents the number of nucleotide substitutions per site. Bootstrap values greater than 50% are shown next to lines, and nodes supported by Bayesian posterior probabilities$0.9 are indicated by asterisks. The positions of the nectar groups (NGs) obtained by phylogenetic analysis of the concatenated dataset (as defined in Fig. 1, see main text) and supported by the corresponding single gene tree are indicated by boxes.
(PDF)
Figure S2 Split decomposition analysis ofrrs,gyrB,rpoBandrpoD sequences, and a concatenation of the four loci for the nectar-inhabitingPseudomonasisolates characterised in this study. (PDF)
Figure S3 Neighbour-joining (NJ) consensus tree, based on concatenated (rrs + gyrB+ rpoB + rpoD) sequences, showing the relationships of nectar-inhabiting isolates and reference (type) strains ofPseudomonas‘sensu stricto’ species. Evolutionary distances were computed using the Jukes-Cantor method and are in the units of number of nucleotide substitutions per site. There were a total of 2601 positions in the final dataset; all positions containing gaps and missing data were eliminated. Node support values (NJ bootstrap percentages, 1000 replicates)$50% are shown next to
the branches. Clades supported by the Maximum Likelihood (ML,
$90% bootstrap) and Bayesian Inference (BI, $0.9 posterior probability) methods are indicated by filled squares and asterisks, respectively. MrBayes and PhyML settings were as explained in the main text, but using a symmetrical model of sequence evolution with gamma-distributed rate variation across sites and a proportion of invariable sites (SYM+G+I) for phylogenetic inference by the BI method. Cellvibrio japonicum Ueda107T was used as an outgroup to root the tree. GenBank accession numbers for nectar isolates are shown in Table S1, and those corresponding to reference strains in Table S3.
(PDF)
Table S1 Details of the Pseudomonas ‘sensu stricto’ isolates characterised in this study.
(PDF)
Table S2 PCR primers used in this study. (PDF)
Table S3 List of reference strains included in phylogenetic analyses.
(PDF)
Table S4 List of pollinator types for the plant species sampled. (PDF)
Table S5 Analysis of the studied loci for the nectar groups (NGs) of pseudomonads identified in phylogenetic analyses.
(PDF)
Table S6 Recombination and mutation indices of the studied loci.
(PDF)
Table S7 Nearest neighbours on the basis of 16S rRNA (rrs) gene sequences among validly named bacterial species of all nectar strains characterised in this study, as obtained through the EzTaxon-e server.
(PDF)
Table S8 Tentative classification of the nectar-inhabiting Pseudomonascharacterised in this study.
(PDF)
Acknowledgments
We thank Prof. S.D. Johnson and S.-L. Steenhuisen for logistic support and hospitality at the University of KwaZulu-Natal, South Africa. S.A.-P. thanks his friends from Prof. Herrera’s lab for their encouragement and moral support during his stay at the EBD-CSIC research institute.
Author Contributions
Conceived and designed the experiments: SA´ P CdV CMH. Performed the experiments: SA´ P. Analyzed the data: SA´P CdV. Contributed reagents/ materials/analysis tools: SA´ P CdV CMH. Wrote the paper: SA´P CdV CMH.
References
1. Andrews JH, Harris RF (2000) The ecology and biogeography of microorgan-isms on plant surfaces. Annu Rev Phytopathol 38: 145–180.
2. Kinkel LL, Andrews JH, Berbee FM, Nordheim EV (1987) Leaves as islands for microbes. Oecologia 71: 405–408.
3. Whipps JM, Hand P, Pink D, Bending GD (2008) Phyllosphere microbiology with special reference to diversity and plant genotype. J Appl Microbiol 105: 1744–1755.
4. Pozo MI, Lachance M-A, Herrera CM (2012) Nectar yeasts of two southern Spanish plants: the roles of immigration and physiological traits in community assembly. FEMS Microbiol Ecol 80: 281–293.
5. Reynolds HL, Packer A, Bever JD, Clay AK (2003) Grassroots ecology: plant– microbe–soil interactions as drivers of plant community structure and dynamics. Ecology 84: 2281–2291.
6. Smith SE, Read DJ (2008) Mycorrhizal symbiosis. 3rd ed. London: Academic Press.
7. Lau JA, Lennon JT (2011) Evolutionary ecology of plant-microbe interactions: soil microbial structure alters selection on plant traits. New Phytol 192: 215–224. 8. Brysch-Herzberg M (2004) Ecology of yeasts in plant–bumblebee mutualism in
9. Herrera CM, Garcı´a IM, Pe´rez R (2008) Invisible floral larcenies: microbial communities degrade floral nectar of bumble bee-pollinated plants. Ecology 89: 2369–2376.
10. Herrera CM, Pozo MI, Medrano M (2013) Yeasts in nectar of an early-blooming herb: sought by bumble bees, detrimental to plant fecundity. Ecology 94: 273–279.
11. Herrera CM, Pozo MI (2010) Nectar yeasts warm the flowers of a winter-blooming plant. Proc R Soc Lond B Biol Sci 277: 1827–1834.
12. Pozo MI, Herrera CM, Bazaga P (2011) Species richness of yeast communities in floral nectar of southern Spanish plants. Microb Ecol 61: 82–91.
13. Belisle M, Peay KG, Fukami T (2012) Flowers as islands: spatial distribution of nectar-inhabiting microfungi among plants ofMimulus aurantiacus, a humming-bird-pollinated shrub. Microb Ecol 63: 711–718.
14. de Vega C, Herrera CM (2012) Relationships among nectar-dwelling yeasts, flowers and ants: patterns and incidence on nectar traits. Oikos 121: 1878–1888. 15. de Vega C, Herrera CM (2013) Microorganisms transported by ants induce changes in floral nectar composition of an ant-pollinated plant. Am J Bot 100: 792–800.
16. A´ lvarez-Pe´rez S, Herrera CM, de Vega C (2012) Zooming-in on floral nectar: a first exploration of nectar-associated bacteria in wild plant communities. FEMS Microbiol Ecol 80: 591–602.
17. Fridman S, Izhaki I, Gerchman Y, Halpern M (2012) Bacterial communities in floral nectar. Environ Microbiol Rep 4: 97–104.
18. A´ lvarez-Pe´rez S, Herrera CM (2013) Composition, richness and non-random assembly of culturable bacterial–microfungal communities in floral nectar of Mediterranean plants. FEMS Microbiol Ecol 83: 685–699.
19. Jacquemyn H, Lenaerts M, Brys R, Willems K, Honnay O, et al. (2013) Among-population variation in microbial community structure in the floral nectar of the bee-pollinated forest herbPulmonaria officinalisL. PLoS One 8: e56917. 20. Jacquemyn H, Lenaerts M, Tyteca D, Lievens B (2013) Microbial diversity in
the floral nectar of sevenEpipactis(Orchidaceae) species. MicrobiologyOpen 2: 644–658.
21. Vannette RL, Gauthier M-PL, Fukami T (2013) Nectar bacteria, but not yeast, weaken a plant–pollinator mutualism. Proc Biol Sci 280: 20122601. 22. Adler LS (2000) The ecological significance of toxic nectar. Oikos 91: 409–420. 23. Nicolson SW, Thornburg RW (2007) Nectar chemistry. In: Nicolson SW, Nepi M, Pacini E, editors. Nectaries and nectar. Dordrecht, The Netherlands: Springer-Verlag. 215–264.
24. Gonza´lez-Teuber M, Heil M (2009) Nectar chemistry is tailored for both attraction of mutualists and protection from exploiters. Plant Signal Behav 4: 809–813.
25. Heil M (2011) Nectar: generation, regulation and ecological functions. Trends Plant Sci 16: 191–200.
26. Escalante-Pe´rez M, Heil M (2012) The production and protection of nectars. Progress in Botany 74: 239–261.
27. de Vega C, Herrera CM, Johnson SD (2009) Yeasts in floral nectar of some South African plants: quantification and associations with pollinator type and sugar concentration. S Afr J Bot 75: 798–806.
28. Peay KG, Belisle M, Fukami T (2012) Phylogenetic relatedness predicts priority effects in nectar yeast communities. Proc Biol Sci 279: 749–758.
29. Sasu MA, Wall KL, Stephenson AG (2010) Antimicrobial nectar inhibits a florally transmitted pathogen of a wildCucurbita pepo(Cucurbitaceae). Am J Bot 97: 1025–1030.
30. De Vos P, Van Landschoot A, Segers P, Tytgat R, Gillis M, et al. (1989) Genotypic relationships and taxonomic localization of unclassifiedPseudomonas
andPseudomonas-like strains by deoxyribonucleic acid:ribosomal ribonucleic acid hybridizations. Int J Syst Bacteriol 39: 35–49.
31. Spiers AJ, Buckling A, Rainey PB (2000) The causes ofPseudomonasdiversity. Microbiology 146: 2345–2350.
32. Moore ERB, Tindall BJ, Dos Santos VAPM, Pieper DH, Ramos J-L, et al. (2006) Nonmedical: Pseudomonas. In: Dworkin M, Falkow S, Rosenberg E, Schleifer KH, Stackebrandt E, editors. The Prokaryotes. 3rd ed. Vol 6. Proteobacteria, Gamma Subclass. New York: Springer-Verlag. 646–703. 33. Silby MW, Winstanley C, Godfrey SA, Levy SB, Jackson RW (2011)Pseudomonas
genomes: diverse and adaptable. FEMS Microbiol Rev 35: 652–680. 34. Zhao BG, Lin F (2005) Mutualistic symbiosis betweenBursaphelenchus xylophilus
and bacteria of the genusPseudomonas. For Path 35: 339–345.
35. Mercado-Blanco J, Bakker PAHM (2007) Interactions between plants and beneficial Pseudomonas spp.: exploiting bacterial traits for crop protection. Antonie Van Leeuwenhoek 92: 367–389.
36. Ryss AY, Kulinich OA, Turitsin VS, Mazurin ES (2011) Mutualistic nematode– bacteria complexes associated with insects. Entomol Rev 91: 908–914. 37. Mulet M, Lalucat J, Garcı´a-Valde´s E (2010) DNA sequence-based analysis of the
Pseudomonasspecies. Environ Microbiol 12: 1513–1530.
38. Edgar RC (2004) MUSCLE: multiple sequence alignment with high accuracy and high throughput. Nucleic Acids Res 32: 1792–1797.
39. Rice P, Longden I, Bleasby A (2000) EMBOSS: the European molecular biology open software suite. Trends Genet 16: 276–277.
40. Abascal F, Zardoya R, Telford MJ (2010) TranslatorX: multiple alignment of nucleotide sequences guided by amino acid translations. Nucleic Acids Res 38: W7–W13.
41. Hall TA (1999) BioEdit: a user-friendly biological sequence alignment editor and analysis program for Windows 95/98/NT. Nucl Acids Symp Ser 41: 95–98.
42. Castresana J (2000) Selection of conserved blocks from multiple alignments for their use in phylogenetic analysis. Mol Biol Evol 17: 540–552.
43. Librado P, Rozas J (2009) DnaSP v5: a software for comprehensive analysis of DNA polymorphism data. Bioinformatics 25: 1451–1452.
44. Tajima F (1989) Statistical method for testing the neutral mutation hypothesis by DNA polymorphism. Genetics 123: 585–595.
45. Jolley KA, Feil EJ, Chan MS, Maiden MC (2001) Sequence type analysis and recombinational tests (START). Bioinformatics 17: 1230–1231.
46. Ronquist F, Huelsenbeck JP (2003) MrBayes 3: Bayesian phylogenetic inference under mixed models. Bioinformatics 19: 1572–1574.
47. Posada D (2008) jModelTest: phylogenetic model averaging. Mol Biol Evol 25: 1253–1256.
48. Guindon S, Dufayard JF, Lefort V, Anisimova M, Hordijk W, et al. (2010) New algorithms and methods to estimate maximum-likelihood phylogenies: assessing the performance of PhyML 3.0. Syst Biol 59: 307–321.
49. Shimodaira H, Hasegawa M (1999) Multiple comparisons of log-likelihoods with applications to phylogenetic inference. Mol Biol Evol 16: 1114–1116. 50. Schmidt HA, Strimmer K, Vingron M, von Haeseler A (2002) TREE-PUZZLE:
maximum likelihood phylogenetic analysis using quartets and parallel comput-ing. Bioinformatics 18: 502–504.
51. Kim OS, Cho YJ, Lee K, Yoon SH, Kim M, et al. (2012) Introducing EzTaxon-e: a prokaryotic 16S rRNA gene sequence database with phylotypes that represent uncultured species. Int J Syst Evol Microbiol 62: 716–721. 52. Saitou N, Nei M (1987) The neighbor-joining method: a new method for
reconstructing phylogenetic trees. Mol Biol Evol 4: 406–425.
53. Tamura K, Peterson D, Peterson N, Stecher G, Nei M, et al. (2011) MEGA5: molecular evolutionary genetics analysis using maximum likelihood, evolution-ary distance, and maximum parsimony methods. Mol Biol Evol 28: 2731–2739. 54. Jukes TH, Cantor CR (1969) Evolution of protein molecules. In: Munro HN, editor. Mammalian Protein Metabolism. New York: Academic Press. 21–132. 55. Huson DH, Bryant D (2006) Application of phylogenetic networks in
evolutionary studies. Mol Biol Evol 23: 254–267.
56. Huson DH (1998) SplitsTree: analyzing and visualizing evolutionary data. Bioinformatics 14: 68–73.
57. Bruen T, Philippe H, Bryant D (2006) A quick and robust statistical test to detect the presence of recombination. Genetics 172: 2665–2681.
58. Martin DP, Lemey P, Lott M, Moulton V, Posada D, et al. (2010) RDP3: a flexible and fast computer program for analyzing recombination. Bioinformatics 26: 2462–2463.
59. Martin D, Rybicki E (2000) RDP: detection of recombination amongst aligned sequences. Bioinformatics 16: 562–563.
60. Martin DP, Posada D, Crandall KA, Williamson C (2005) A modified BOOTSCAN algorithm for automated identification of recombinant sequences and recombination breakpoints. AIDS Res Hum Retroviruses 21: 98–102. 61. Smith JM (1992) Analyzing the mosaic structure of genes. J Mol Evol 34: 126–
129.
62. Posada D, Crandall KA (2001) Evaluation of methods for detecting recombination from DNA sequences: computer simulations. Proc Natl Acad Sci USA 98: 13757–13762.
63. Padidam M, Sawyer S, Fauquet CM (1999) Possible emergence of new geminiviruses by frequent recombination. Virology 265: 218–225.
64. Gibbs MJ, Armstrong JS, Gibbs AJ (2000) Sister-Scanning: a Monte Carlo procedure for assessing signals in recombinant sequences. Bioinformatics 16: 573–582.
65. Boni MF, Posada D, Feldman MW (2007) An exact nonparametric method for inferring mosaic structure in sequence triplets. Genetics 176: 1035–1047. 66. Hasio´w-Jaroszewska B, Czerwoniec A, Pospieszny H, Elena SF (2011)
Tridimensional model structure and patterns of molecular evolution ofPepino mosaic virusTGBp3 protein. Virol J 8: 318.
67. Haubold H, Hudson RR (2000) LIAN 3.0: detecting linkage disequilibrium in multilocus data. Bioinformatics 16: 847–848.
68. McVean G, Awadalla P, Fearnhead P (2002) A coalescent-based method for detecting and estimating recombination from gene sequences. Genetics 160: 1231–1241.
69. Lozupone C, Hamady M, Knight R (2006) UniFrac – An online tool for comparing microbial community diversity in a phylogenetic context. BMC Bioinformatics 7: 371.
70. Lozupone C, Knight R (2005) UniFrac: a new phylogenetic method for comparing microbial communities. Appl Environ Microbiol 71: 8228–8235. 71. Stackebrandt E., Goebel BM (1994) A place for DNA-DNA reassociation and
16S ribosomal-RNA sequence-analysis in the present species definition in bacteriology. Int J Syst Bacteriol 44: 846–849.
72. Stackebrandt E, Ebers J (2006) Taxonomic parameters revisited: tarnished gold standards. Microbiol Today 33: 152–155.
73. Kassen R, Rainey PB (2004) The ecology and genetics of microbial diversity. Annu Rev Microbiol 58: 207–231.
74. Beattie GA, Lindow SE (1995) The secret life of foliar bacterial pathogens on leaves. Annu Rev Phytopathol 33: 145–172.
75. Rainey PB (1999) Adaptation ofPseudomonas fluorescensto the plant rhizosphere. Environ Microbiol 1: 243–257.
77. Pusey PL (1999) Effect of nectar on microbial antagonists evaluated for use in control of fire blight of pome fruits. Phytopathology 80: 39–46.
78. Cladera AM, Bennasar A, Barcelo´ M, Lalucat J, Garcı´a-Valde´s E (2004) Comparative genetic diversity of Pseudomonas stutzeri genomovars, clonal structure, and phylogeny of the species. J Bacteriol 186: 5239–5248. 79. Sarkar SF, Guttman DS (2004) Evolution of the core genome ofPseudomonas
syringae, a highly clonal, endemic plant pathogen. Appl Environ Microbiol 70: 1999–2012.
80. Frapolli M, De´fago G, Moe¨nne-Loccoz Y (2007) Multilocus sequence analysis of biocontrol fluorescentPseudomonasspp. producing the antifungal compound 2,4-diacetylphloroglucinol. Environ Microbiol 9: 1939–1955.
81. Frapolli M, Pothier JF, De´fago G, Moe¨nne-Loccoz Y (2012) Evolutionary history of synthesis pathway genes for phloroglucinol and cyanide antimicrobials in plant-associated fluorescent pseudomonads. Mol Phylogenet Evol 63: 877– 890.
82. Herrera CM, Pozo MI, Bazaga P (2011) Clonality, genetic diversity and support for the diversifying selection hypothesis in natural populations of a flower-living yeast. Mol Ecol 20: 4395–4407.
83. Bodilis J, Meilo SN, Cornelis P, De Vos P, Barray S (2011) A long-branch attraction artifact reveals an adaptive radiation inPseudomonas. Mol Biol Evol 28: 2723–2726.
84. Hao W (2013) Extensive genomic variation within clonal bacterial groups resulted from homologous recombination. Mob Genet Elements 3: e23463. 85. Vos M, Didelot X (2009) A comparison of homologous recombination rates in
bacteria and archaea. ISME J 3: 199–208.
86. Coenye T, LiPuma JJ (2002) Population structure analysis ofBurkholderia cepacia
genomovar III: varying degrees of genetic recombination characterize major clonal complexes. Microbiology 149: 77–88.
87. Octavia S, Lan R (2006) Frequent recombination and low level of clonality withinSalmonella entericasubspecies I. Microbiology 152: 1099–1108. 88. Sorokin A, Candelon B, Guilloux K, Galleron N, Wackerow-Kouzova N, et al.
(2006) Multiple-locus sequence typing analysis of Bacillus cereus and Bacillus
thuringiensis reveals separate clustering and a distinct population structure of psychrotrophic strains. Appl Environ Microbiol 72: 1569–1578.
89. Wicker E, Lefeuvre P, de Cambiaire J-C, Lemaire C, Poussier S, et al. (2012) Contrasting recombination patterns and demographic histories of the plant pathogenRalstonia solanacearuminferred from MLSA. ISME J 6: 961–974. 90. Campbell LT, Currie BJ, Krockenberger M, Malik R, Meyer W, et al. (2005)
Clonality and recombination in genetically differentiated subgroups of
Cryptococcus gattii. Eukaryot Cell 4: 1403–1409.
91. den Bakker HC, VanKuren NW, Morton JB, Pawlowska TE (2010) Clonality and recombination in the life history of an asexual arbuscular mycorrhizal fungus. Mol Biol Evol 27: 2474–2486.
92. Cohan FM (2006) Towards a conceptual and operational union of bacterial systematics, ecology, and evolution. Philos Trans R Soc Lond B Biol Sci 361: 1985–1996.
93. Gime´nez-Jurado G, Kurtzman CP, Starmer WT, Spencer-Martins I (2003)
Metschnikowia vanudeniisp. nov. andMetschnikowia lachanceisp. nov., from flowers and associated insects in North America. Int J Syst Evol Microbiol 53: 1665– 1670.
94. Manson JS, Lachance MA, Thomson JD (2007)Candida gelsemiisp. nov., a yeast of the Metschnikowiaceae clade isolated from nectar of the poisonousCarolina jessamine. Antonie Van Leeuwenhoek 92: 37–42.
95. de Vega C, Guzma´n B, Lachance MA, Steenhuisen SL, Johnson SD, et al. (2012) Metschnikowia proteae sp. nov., a nectarivorous insect-associated yeast species from Africa. Int J Syst Evol Microbiol 62: 2538–2545.
96. A´ lvarez-Pe´rez S, Lievens B, Jacquemyn H, Herrera CM (2013) Acinetobacter nectarissp. nov. andAcinetobacter boissierisp. nov., isolated from floral nectar of wild Mediterranean insect-pollinated plants. Int J Syst Evol Microbiol 63: 1532– 1539.
97. Farkas A, Mihalik E, Dorgai L, Buba´n T (2012) Floral traits affecting fire blight infection and management. Trees 26: 47–66.

![Figure 2. Unrooted neighbour-joining (NJ) consensus tree, based on phylogenetic analysis of concatenated ( rrs + gyrB + rpoB + rpoD ) sequences, displaying the relationships of nectar-inhabiting isolates (shown as red filled circles [nectar group (NG) 1],](https://thumb-eu.123doks.com/thumbv2/123dok_br/18379288.356222/8.918.92.443.87.542/unrooted-neighbour-consensus-phylogenetic-concatenated-displaying-relationships-inhabiting.webp)
