GRAPHICAL ANALYSIS OF LAFFER'S THEORY FOR EUROPEAN
UNION MEMBER STATES
LILIANA BUNESCU
Teaching Assistant Ph.D.
„Lucian Blaga” University of Sibiu, Faculty of Economics, Romania
[email protected]
CARMEN COMANICIU
Professor Ph.D.
„Lucian Blaga” University of Sibiu, Faculty of Economics, Romania
[email protected]
Abstract
Most times the current situation of one or another country depends on the historical development of own tax system. A practical question of any governance is to determine the optimal taxation rate level, bringing to the state the highest tax revenues. A good place to start is with what is popularly known as the Laffer curve. This paper aims to determine in graphical terms the level where European economies ranks by using Laffer curve based on the data series provided by the European Commission and the World Bank. Graphical analysis of Laffer's theory can emphasize only the positioning on one or another side of point for maximum tax revenues, a position that can influence fiscal policy decisions. Conclusions at European Union level are simple. Value of taxation rate for fiscal optimal point varies from one Member State to another, from 48.9% in Denmark to 28% in Romania, with an average of 37.1% for the EU-27.
Key words: Laffer curve, tax optimum, taxation rate
JEL Classification: H 21
1. Introduction
A tax system should ensure an optimum performance for individual initiative in a market economy, but also to take into account the psychological attitudes of citizens. The way in that a tax system from a country combines principles of taxation, choosing one way or another to solve the numerous and complicated contradictory statements, reflects political, economic and social priorities. Although the fiscal optimum was subject to intense debate, it currently remains a vague concept. An important issue that keeps the attention of many economists and policy makers is to optimize the tax system. Entering or changing a tax is an issue that needs attention due to the consequences generated by it at multiple levels: economic, social, financial and, last but not the least, at political level. Only a fiscal policy based on findings can constitute the optimum tax revenues needed to cover public spending. We cannot speak about optimality in taxation without the existence of an optimal fiscal management. Fiscal management should meet five principles, namely: transparency in setting fiscal policy objectives, in their implementation and in provision of results, stability of tax policy and stability of its influences in the economy, responsibility, fairness for future generations of taxpayers and efficiency in implementation. [5, p. 9]
The existence of any modern state is unthinkable without a tax system characterized by efficiency and performance through its pressure on taxpayers. Most times the current situation of one or another country depends on the historical development of own tax system, especially on how it was designed and applied in practice. A practical question of any governance is to determine the optimal taxation rate level, bringing to the state (either Government or local or regional authority) tax revenues as higher as possible. Economists around the world have expressed some interest in establishing an optimal threshold of the tax burden to substantiate decisions. The trend in increasing fiscal pressure and exceeding the limits theoretical established has endangered the functioning of the capitalist economy, but its burden was felt more by an honest taxpayer, that has not stepped back from the payment of all debts to the state. To understand the impacts of tax policy, one needs to know what determines tax revenues. A good place to start is with what is popularly known as the Laffer curve, which shows how tax rates and tax revenues are related. [3]
Annals of the „Constantin Brâncuşi” University of Târgu Jiu, Economy Series, Issue 2/2013
materialized by Arthur Laffer in the 80s. He built a curve exemplifying the relationship between taxation rate and tax base. Some economists continuously dispute the general principle of Laffer curve, although the optimal taxation rate is in itself a controversy. But over time there were found a number of arguments against the Laffer curve. For example, it cannot exist in an economic bubble, countries with very high rates of taxation can register a productive economy, moreover a progressive taxation complicates the calculation of this curve. Determining the optimal tax rate is subject to much controversy because Laffer curve does not provide a clear numerical answer, but rather, we suggest a hypothetical optimal rate of taxation.
The question that we address in this paper is “where are situated the European economies on Laffer curve?” To find an appropriate answer of this question we will plot the Laffer curve for all 27 Member States and we will interpret the results.
The paper is structured in five parts as follows: the first part presents a series of introductory issues, the second details Laffer's theory on optimal taxation, the third part shows the graphical analysis results for 26 Member States of the EU (except Romania), the fourth part focus on the analysis for Romania, and finally the paper outlines the overall conclusions. The main objectives of our research are to determine in graphical terms the level where European economies ranks by using Laffer curve and to reveal the connection between evolution of tax revenues and tax burden. As research methods we used besides own reasoning, deductive logic, documentation as qualitative methods, the graphical analysis performed by MS Office as graphical method.
2. Tax optimum in Arthur Laffer’s view
Historically “Laffer curve” has its roots in an article wrote by Jude Wanniski in 1978 in “The Public Interest” called “Taxes, income and Laffer curve”. The article was published after a dinner attended with Donald Rumsfeld, Dick Cheney and Arthur Laffer, the latter drawing on a napkin a curve illustrating the relationship between taxation rates and tax revenues. Arthur Laffer said in his “Laffer curve. Past, Present and Future” that the origins of the curve does not belong to him, it has been shaped since the fourteenth century by Muslim philosopher Ibn Khaldun, who wrote in his “The Muqaddimah” that: “it should be known that at the beginning of the dynasty, taxation yields meant higher revenues from small assessments. At the end of the dynasty, taxation yields meant smaller revenues from large assessments.” [2]
Using as basis for analysis the U.S. market economy, the economist Laffer shows through a curve the relation between fiscal pressure rate and tax revenues. It claims to reflect the macroeconomic impact of microeconomic effects of taxation demonstrating how tax revenues evolve when tax rates increase. Laffer presented the curve as a normal statistical distribution (central and flattened-looking as a bell section). It was easy to conclude that there is a maximum point of correlation between revenues and tax rates, located in the top point of the curve, named by author as maximum taxation rate. According to many authors Laffer curve has no practical application because it does not know its most important detail, the location of the maximum point. Graphical illustration of this concept shows that at a taxation rate of 0% authorities will not collect any money to the budget as taxes, regardless of the size of the taxable matter. Also, the same goes for a 100% taxation rate when no one would work for the state. [1, p. 246] Between these two extremes there are two rates of taxation that can collect from the population the same amount of tax revenue: a high tax rate applied to a small tax base and a reduced rate of taxation applied to a large tax base.
Specifically, the Laffer curve is divided into two areas: the area on the left, called normal or acceptable which stresses the idea that the growth rate of compulsory levies is lower than the growth rate of tax burden. Allowable area is the area where economic subjects “support” an increasing fiscal pressure because they need higher amounts of public utilities. Tax receipts grow although it took place a gradual reduction of taxable base. Instead, the right side is called the inadmissible one, which shows that any increase in the tax burden is not sufficient to offset the decline in compulsory levies obtained by the public authorities. Consequently, individuals and companies from economy restrict their taxable activities and, directly, the taxable base reduces. As fiscal pressures increase there is a decrease in production and hence in tax revenues. It is desirable that when a country is in the inadmissible area to achieve a large tax base leading to increased tax revenues generated by the incentive effect of the measures that are needed to boost production and investment.
Arthur Laffer exemplifies his anticipated effects by some concrete cases that confirm the theory. For example, to show that cuts in taxes lead to economic leap, Laffer has used statistics from three major periods of tax cuts implemented in the U.S. for over 10 centuries. Laffer noted that Harding-Coolidge cuts in the 1920s, Kennedy cuts in the 1960s and President Reagan's cuts in the 1980s were “remarkable success measured by virtual and public policy”. [2]
curve should not be literally taken as a model for the graphical representation of tax revenue curve. Determining the optimal taxation rate is subject to controversy because Laffer curve does not provide a clear numerical answer, but rather suggests the existence of a hypothetical optimal rate of taxation. Both supporters of Laffer's theory and its opponents have made a number of credible arguments to support their views, but do not forget that most of the times the fiscal policy of a country is directly dependent on policy taken by the politicians in charge. Unfortunately they have not found the optimal tax point, but both admit that Laffer curve theory can be the closest ideea to what we can find.[7]
3. Analysis at the level of 26- EU Member States (except Romania)
Laffer curve is a graphical representation of two economic indicators, namely the annual flow of tax revenues and taxation rates. Approaches may vary according to the flow of tax revenues, including or excluding social contributions, or differentiated by their source of origin, but also depending on the method of calculation of taxation rate, the overall one or by its structure. In analyzing the correlation between tax burden and tax revenues collected by European tax authorities we start with primary statistical database provided by the World Bank indicators as tax revenue (in current prices and local currency) and the GDP deflator (%), by European Commission for indicators as tax burden and social contributions for the period 1995 to 2010. For Romania it has been opted for the INSEE data series for tax revenues centralized from executions of National Public Budget and the inflation rate for the period 1995-2010. Because statistic indicators are expressed in nominal terms, we revealed them in real terms, i.e. under a correction by inflation, namely by the GDP deflator expressing a generalized increase in prices in economy.
We proceeded to plot Laffer curve, on horizontal there can be found taxation rates (including social contributions) for 26 EU Member States and on vertical tax revenues (in real terms) received by countries in the analyzed period, according to Figure no. 1.
Source: Author’s processing based on data series of Eurostat and European Commission
As shown in Figure no. 1, graphics for the 26 EU Member States strengthen Gardner's idea. The Laffer curve is not a linear, smooth and concave curve in any of the cases. Moreover, its representation in each state customizes by alternative mutations in the admissible area and the inadmissible one in the same time with fiscal policy decisions. However, you can verify the claim that by a lower rate of tax burden may be charged higher tax revenues than when applying a higher taxation rate. Depending on how tax revenues respond to changes in the tax burden the fiscal policy of the country can be divided into two areas bounded by Laffer's theory. We focused on the correlation between them since 2007, the last year of economic growth. The year 2008 is a watershed year in the world economy, in general, and in the European economy, in special.
Thus, the pooled data for 2007 indicates the position in non-economic Laffer area, for 11 of the 27 European countries (Belgium, Denmark, Finland, France, Ireland, Latvia, Luxembourg, Netherlands, Slovenia, Sweden, United Kingdom). For all other Member States the taxation rate and tax revenues developed in the same direction, by growing, which allows integration of these countries into admissible area. The year 2008 lead to the removal of most of these countries into non-economic area, even if for the previous year they were cataloged in the economic zone. The number of countries falling in the area where tax revenues have an opposite reaction to the evolution of taxation rate was of 13 EU Member States (Bulgaria, Cyprus, Czech Republic, Estonia, France, Greece, Latvia, Luxembourg, Malta, Poland, Portugal, Romania, Slovenia), of that in 12 EU Member States a decrease in fiscal pressure generated an increase in tax revenues. In 2009, 22 countries recorded a reduction or stagnation in taxation rates that were accompanied by a decrease in tax revenues generating a reaction of admissible area, and in 5 EU Member States (Austria, Germany, Italy, Slovenia, Sweden) additional tax burden generated some losses in tax revenues, a specific reaction of non-economic area. In relation to annual changes between the two areas we can see a steady position in an area or another only for four Member States, three in admissible area (Sweden, Lithuania, Hungary) and Slovenia in non-economic area. These appointments to the left or right side of the point indicating the taxation rate corresponding to maximum tax revenues confers an advantage to fiscal policy decisions because it allows knowing taxpayers’ reaction to any changes in tax system. Differences between the Laffer curves therefore arise solely due to differences in fiscal policy i.e. the mix of distortion taxes, government spending and government debt. [8]
Table no. 1 Taxation rate for maximum level of public tax revenues in the EU (1995-2010)
Country AT BE BG CY CZ DK EE FI FR DE EL HU IE RO
Troptim 42,6 44,5 32,3 39,1 35,5 48,9 35,9 43,1 42,9 39,4 31,7 40,0 31,4 28
Trmax 45,3 45,5 33,3 40,9 37,4 50,8 35,9 47,2 44,9 41,9 34,6 40,8 33,1 31 Country IT LV LT LU MT NL PL PT SK SI ES SE UK
Troptim 43 29,1 30,2 37,1 33,9 39,1 34,3 32,8 29,3 37,2 37,1 47,3 37,5
Trmax 43,7 33,7 31,7 39,8 34,3 40,4 37,1 32,9 40,3 39,2 37,1 51,5 37,5 Source: Data centralized by authors based on data series of Eurostat and European Commission
It is considered that the tax optimum peak is reached when throughout a low tax rate are obtained maximum receipts as tax revenues. In table no. 1 are centralized taxation rates (Tr optim) for the 27 countries of EU providing the largest collections of tax revenue during the 15 analyzed years (1995-2010) and the highest rates of taxation (Tr max) applied in every state in the period under review. The conclusions are simple: the values of the optimal taxation rate for tax optimum peak varies from one Member State to another, from 48.9% in Denmark to 28% in Romania, with an average of 37.1% for the EU-27; moreover taxation rates corresponding to fiscal optimum peak does not coincide with their maximum values in the period under review, except for 4 countries, namely Estonia, Spain, Portugal and the UK. For 23 Member States tax burden expressed as a percentage related to the optimal point is lower than maximum annual tax burden applied during the period, the difference between the two values reach 4.6% in Finland and 4.1% in Latvia.
4. Romania – low taxation rate for high tax revenues
Annals of the „Constantin Brâncuşi” University of Târgu Jiu, Economy Series, Issue 2/2013
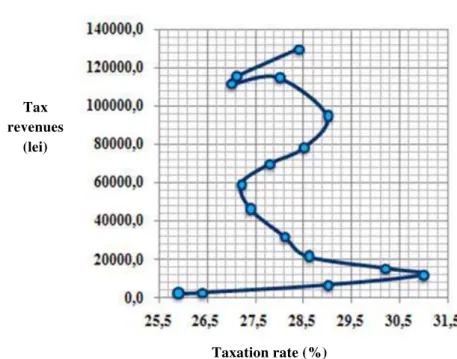
Graphical analysis of Laffer's theory as shown in Figure no. 2 does not reflect for Romania a smooth and concave curvilinear of correlation between tax burden and tax revenues. Laffer curve for Romania consists of a series of fragments, i.e. a succession across admissible area and non-admissible area according to the ruling parties and their fiscal decisions. Since 1996 the rate of taxation in Romania including social contributions recorded a growth phase up to 31% in 1999 accompanied by a significant increase in the rate of real growth in tax revenues, Romania being in the economic area of Laffer curve (quadrant B). Next period, 2000-2004, moves Romania in inadmissible area of Laffer curve characterized by downwards of taxation rate to 27.2% accompanied by increased tax revenue receipts (quadrant A). Years 2005 - 2007 are characterized by the inclusion into admissible area of Laffer's theory, when a light and gradually increase in tax burden of Romanian taxpayers to 29% in 2007 was accompanied by an increase in tax revenues. The year 2008 is characterized by an early reduction of tax revenue to GDP ratio to 27% in 2009 and 2010 (quadrant C).
Figure no. 2 Laffer curve for Romania 1995-2011
Source: Authors, based on Eurostat data series between 1995-2009, Romanian Ministry of Finance Between 2010-2011
Figure no. 3 Laffer's theory dials for Romania 1995 - 2011
Source: Authors, based on Eurostat data series between 1995-2009, Romanian Ministry of Finance Taxation rate (%)
Tax revenues
(lei)
Absolute variation of taxation rate (%
)
Relativ variation of tax revenues
Although the global financial and economic crisis has led to declining tax revenue of our country, Romania is in the admissible area of Laffer curve. In the most cases the level of changes in tax revenues outruns the changes in the tax burden rate. Alternating economic zone with non-economic zone of the American economist theory corresponds in '90s to a period in which Romanian economy suffered a transition to a market economy. This period involved a series of adjustments to tax laws, changes in the structure of markets for goods, a decrease in purchasing power of the domestic market, etc. Graphical representation of neo-Laffer curve shows that taxation rate with the highest degree of optimality, recorded during the 16 analyzed years, stands around 28%, framing our country in the category of EU Member States where taxation rate of optimal point is lower than the highest rate of taxation applied of 31%. Moreover, Romania is the member state that has the lowest taxation rate value corresponding to the highest degree of tax optimality.
5. Conclusions
Graphical analysis of Laffer's theory can emphasize only the position on one or another side of point for maximum tax revenues, a position that can influence fiscal policy decisions. Laffer curve for Romania consists in a series of fragments, i.e. a rotation crossings admissible area or non-admissible area according to ruling parties and their fiscal decisions. The results of our analysis are correlated with the results obtained by other Romanian researchers as Brezeanu P. and Trandafir A. (2011) or Dobrota G. and Chirculescu M.F. (2012). All of them observed the same instability of Romania’s position in admissible side of Laffer’s teory. Brezeanu P. and Trandafir A. (2011) concluded their analysis made between 2000 – 2010 with the idea that the slope of the Laffer curve for the general government budget of Romania in the prohibited area instability finds its explanation in the fiscal area, the weak administrative capacity of the Romanian authorities and the fact that, most times, this area was used as a political tool. [4, p. 68] Dobrota G. and Chirculescu M.F. (2012) underlined in their analysis made between 1991 – 2009 that the real problem for the fiscal systems of Romania isn’t the general level of taxation but the reduced degree of the collection of tax revenues.[9, p. 60]
Conclusions at European Union level are simple. Value of taxation rate for fiscal optimal point varies from one Member State to another, from 48.9% in Denmark and 28% in Romania, with an average of 37.1% for the EU-27. Moreover, taxation rates for fiscal optimal point does not coincide with their maximum values in the analyzed period except 4 states, namely Estonia, Spain, Portugal and the UK, for 23 Member States tax burden expressed as a percentage value corresponding to optimal point is lower than the maximum tax burden yearly imposed, the differences between the two values reaching 4.6% in Finland and 4.1% respectively in Latvia.
Unfortunately, the Laffer curve itself does not tell us whether a reduction in tax rate will increase or decrease tax revenues, but how tax revenues respond to changes in taxation rate depends on existing tax system, on time period considered, on movements in economy, on the prevalence of tax loopholes accounts, etc. Neither supporters, nor opponents have found Laffer tax optimum value, but both admit that the Laffer curve theory can be the closest idea to what we can find.
6. References
[1]. Arnold Roger, 2011, Principles of Economics, 10th International Edition, Cengage Learning Publishing House, South Western, p. 246.
[2]. Arthur Laffer, 2004, The Laffer Curve. Past, Present and Future, available at http://www.heritage.org /Research/ Taxes/bg1765.cfm
[3]. Becsi Zsolt, 2000, The Shifty Laffer Curve, Federal Reserve Bank of Atlanta Economic Review, available at http://www.frbatlanta.org/filelegacydocs/becsi.pdf
[4]. Dragota G., Chirculescu M.F., 2012,Analysis of the Tax Burden in Romania based on the Laffer Curve in the period 1991-2009, Annals of “Dunarea de Jos” University of Galati Fascicle I. Economics and Applied Informatics, No. 1, p. 68, available at http://www.ann.ugal.ro/eco/Doc2012.1/Dobrota_Chirculescu.pdf
[5]. HM Treasury, 1999, Analysing the UK fiscal policy, London, p. 9, http://archive.treasury.gov.uk/pdf/1999/ anfiscalp.pdf
[6]. Lhotak James, 2011, A Grounded Theory Analysis of the Laffer Curve and Its Implications for Supply Side and Demand Side Economics, Walden University, available at http://proquest.umi.com/pqdlink?did=2443948541&Fmt=7&clientI
d=79356&RQT=309&VName=PQD
[7]. Smith Lisa, Laffer Curve Key To Ideal Tax Rate, available at http://www.investopedia.com/ articles/08/laffer-curve.asp
Annals of the „Constantin Brâncuşi” University of Târgu Jiu, Economy Series, Issue 2/2013
[8]. Trabandt Mathias, Uhlig Harald, How Do Laffer Curves Differ Across Countries?, Board of Governors of the Federal Reserve System, International Finance Discussion Papers, Number 1048, May 2012, available at: http://www.federalreserve.gov/pubs/ifdp/2012/1048/ifdp1048.pdf [9]. Trandafir A., Brezeanu P., Optimality of Fiscal Policy in Romania in Terms of Laffer Curve, Theoretical and Applied Economics, No. 8 , 2011, p. 60, available at http://store.ectap.ro/articole/624.pdf