Received November 20th, 2011, Revised September 13th, 2012, Accepted for publication September 18th, 2012.
Copyright © 2012 Published by LPPM ITB, ISSN: 1978-3086, DOI: 10.5614/itbj.ict.2012.6.2.4
Incident and Traffic-Bottleneck Detection Algorithm in
High-Resolution Remote Sensing Imagery
S.M.M. Kahaki1, Md. Jan Nordin2 & Amir Hossein Ashtari3
Department of Information Science and Technology, Universiti Kebangsaan Malaysia, 43600 Bangi, Selangor Darul Ehsan, Malaysia
Email: mousavi@ftsm.ukm.my1, jan@ftsm.ukm.my2, amirhossein@ftsm.ukm.my3
Abstract. One of the most important methods to solve traffic congestion is to detect the incident state of a roadway. This paper describes the development of a method for road traffic monitoring aimed at the acquisition and analysis of remote sensing imagery. We propose a strategy for road extraction, vehicle detection and incident detection from remote sensing imagery using techniques based on neural networks, Radon transform for angle detection and traffic-flow measurements. Traffic-bottleneck detection is another method that is proposed for recognizing incidents in both offline and real-time mode. Traffic flows and incidents are extracted from aerial images of bottleneck zones. The results show that the proposed approach has a reasonable detection performance compared to other methods. The best performance of the learning system was a detection rate of 87% and a false alarm rate of less than 18% on 45 aerial images of roadways. The performance of the traffic-bottleneck detection method had a detection rate of 87.5%.
Keywords: aerial image analysis; incident detection; Radon transform; traffic-bottleneck detection; traffic controlling; vehicle detection.
1
Introduction
Traffic incident detection methods can be divided into two main categories: pattern recognition and statistical methods. Collecting traffic information and effects of lane geometry on incidents are used in many researches [3]. In 1991, volume, occupancy and speed have been introduced as input features for incident detection [5]. A review of the latest researches shows that speed, volume and occupancy are the main input features in recent AID systems [1,2,4]. Sujeeva implemented an artificial neural network (ANN) based AID system in his PhD dissertation, using traffic data, incident data and the ANN to train and test the system [6].
More recently, traffic flow was used in some researches as an incident-detection feature for AID systems. Traffic flow is the basic idea behind AID methods that can analyze measurements taken at different points of a roadway by monitoring continuous streams of traffic [3]. In some researches, real-time detection of incidents on roadways has been proposed based on traffic flow as input for incident detection algorithms [7,8]. Savas has proposed a new method for the prediction of traffic incidents based on a geographic information system (GIS) platform. He used temperature, humidity, and weather conditions as input features based on correlation feature selection [9]. In a similar study, traffic incidents were detected using volume, speed and occupancy to assess the traffic state and make a decision whether an incident happened or not [1].
Compared to other methods, the features of our system show some differences. We cannot use speed because continuous frames are not available in aerial imagery. In [1] volume (vehicle/h) was used, which is the number of vehicles passing a particular part of a roadway, while in our system, in order to find the cause of a traffic jam, we calculated traffic volume in several parts of a roadway, i.e. traffic bottleneck sections.
We have used aerial datasets gathered by the municipality of Tehran (Iran) and also some satellite images provided by Google in Google Earth. We manually picked about 45 aerial images of roads with normal traffic and incidents. Using our eyes it is not difficult to find traffic or accidents/incidents in an image. The proposed system detects incidents/accidents and bottlenecks intelligently. In all cases where the system makes a correct recognition in accordance with manual recognition we call it successful, otherwise the rate of performance is reduced. We will try to collect and publish a dataset as a reference for other investigators who want to do further research in this area.
There are several researches on traffic measurement and road extraction from the past few years that use aerial imagery and remote sensing imagery. Lin and Saripalli have proposed a robust road detection and tracking algorithm for aerial images. They successfully detected roads in 96% of the images [11]. Vehicle detection in low-resolution aerial imagery based on SIFT keypoint features and SVN have been proposed by [12,13]. Even though there are several proposed techniques for road and vehicle detection using aerial imagery from recent years [10-13], we have not found any incident detection algorithm using aerial imagery. Therefore, we have selected and created a number of new features for automated incident detection and developed a new algorithm for incident detection using aerial imagery.
Road extraction and vehicle detection using aerial imagery involves information and data related to GIS and these data need to be updated every certain period of time [14]. Road extraction and vehicle detection for incident detection in aerial imagery is a new, controversial issue in computer vision, which also influences many other projects and operations, such as traffic control and incident detection on highways. Some other real-time applications using sensors [15] or ground cameras have been implemented for traffic control, such as [16-20]. Since the development of new satellite systems such as Quick Bird, IKONOS and Geoeye-2, remote sensing imagery is available with a 0.25 meter resolution. Vehicles can be observed clearly in this type of satellite images. Some vehicle detection methods have been studied using aerial imagery [21,22,23]. The study most closely related to this paper is [14]. In this study the authors have developed a system for traffic incident recognition using aerial imagery. Their approach focused on road extraction and incident detection using the Radon transform method. The main difference between our system and [14] is a new input feature for incident and bottleneck detection. This feature is traffic flow, which helps us improve the detection rate.
in an aerial image are the direction of the vehicles and the traffic flow in the scene. If an incident occurs, the number of vehicles will increase rapidly within a specific time interval, and also there will be one or more vehicles with an irregular angle. Therefore, in order to build our system, these features were measured using image processing and machine vision methods. An example of an aerial image used for incident detection is shown in Figure 1.
Figure 1 An example of an aerial image for incident detection.
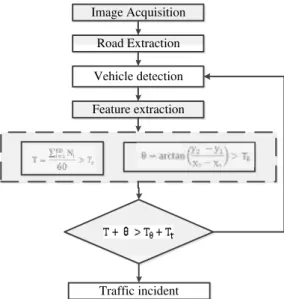
2
Principle of Detection System
Road Extraction Image Acquisition
Vehicle detection
Feature extraction
Traffic incident
Figure 2 Flowchart of the incident detection algorithm (Ɵ: vehicle direction; T: traffic flow).
3
Configuration of Detection System
As shown in Figure 2, the core of the proposed incident detection system consists of two main features to recognize incidents on a roadway. The first one is figuring out the vehicle direction that is defined as Ɵ and the second one is the measuring of traffic flow within a specific time interval defined by T [24]. Before considering these two features, the system needs to extract the roadway, distinguish coordinates of the road district and detect the vehicles.
It is really useful to know that roads are present as a direct district with a different color in the aerial imageries [14]. Therefore, a linear feature can be appropriate for road extraction. Another feature that roads possess are the white lines that are available continuously alongside the road and discontinuously in the middle of the road [14]. Another feature used in this method is the color of the road which distinguishes the road from the completely specified edges.
there are differences in color too. The sharpen operation using a filter leads to an increased difference in color at the edges, which can enhance automatic edge detection. The next step is distinguishing the roads using Hough transforming.
After road extraction, we need to detect the vehicles on the roadway. This is simple because only those objects that are inside the roads have to be handled. One of the important features of vehicles that can help detecting them is the
vehicle’s model. A vehicle can be detected using its model from dataset
examples using neural network classifiers. In order to enhance the performance of the learning system, morphology transform is used to enhance the vehicle’s features. This is defined by gradient as shown in equation 1 until 3 [25,26].
G (f) = (f g) − (f Θ g) (1)
Where g is a structuring element, f is a gray scale source image, f g means dilation, and f Θ g means erosion.
Dilation:
:
ˆ
z
A
B
z
B
A
(2)Erosion: The erosion of by , written A B A B , is given by:
z
A B z | B A (3)
Figure 3 shows a morphology image of the Tehran-Karaj (Iran) highway. In aerial images vehicles usually appear as a rectangular shape, so model-based vehicle detection can be used to discriminate vehicle targets and non-vehicle targets. Figure 4 shows some dataset examples for neural network classifiers.
Another noticeable feature of vehicles in aerial images is their color, which differs significantly from that of other objects. This phenomenon can help us detect vehicles by adaptive threshold processing. The results of threshold simulation indicate that this method can improve detection performance. The mean square error of the learning system for vehicle detection is shown in Figure 5.
For detecting the direction of the vehicles the skeleton algorithm is used to transform the extracted vehicles into a line, and subsequently Radon transform is used to find the direction of vehicles. In the last step of finding the direction of the vehicles, thresholding is used to compare the vehicle angle to a threshold. Those lines (vehicles) that are at an irregular angle are candidates for marking an incident. For this purpose, we should have a mathematical transform that converts line singularities from the original image into characteristic points in the transformed image. These points should be local maxima in order to be able to extract them with some form of post-processing. Radon transform (RT) appears to be a good candidate. Radon transform converts the original image
into a new image space with parameters Ө and t. Each point in this new space
accumulates all information corresponding to a line in the original image with angle Ө and radius t [27]. Thus, when Radon transform localizes a local
maximum near an angle Ө0 and around a slice t0 it means that the original image
has a line in position (Ө0, t0). This is the kind of transform we are looking for.
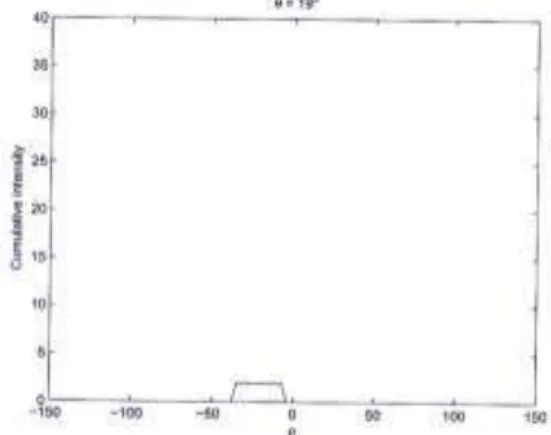
Applying the Radon transform to an image f(x,y), i.e. Figure 6, for a given set of angles can be thought of as computing the projection of the image along the given angles, i.e. Figure 7. The resulting projection is the sum of the intensities of the pixels in each direction, i.e. an integral line. The result is a new image
R(ρ,Ө). This can be written mathematically by defining Eq. (4):
cos sin
x y
(4)
After which the Radon transform can be written as equation 5:
R( , ) f x y( , ) ( xcos ysin ) dxdy
(5)Where
(0)is the Dirac delta function.
Figure 3 Morphology preprocessing result.
Figure 5 Mean Square Error for the Learning System.
Figure 6 As an example, the line in this image will be distributed over a larger interval at Ө = 19.
Figure 7 The result of a Radon transform with Ө = 19 where there is no definite peak.
( ( ))( , ) ( , )
R f g x t Rf t (6)
The effect of rotation on the Radon transform can be seen in Figure 8a and 8b. We can see how, as the image is rotated more, the local maxima of the Radon transform move to the right, while slice t remains constant, i.e. the Radon transform of the rotated images is the same as the original’s, but shifted in the angular direction by the angle of rotation. We can compare the maximum rotation of lines to find irregular direction [28,29].
(a)
(b)
(c)
Figure 8 (a) Rotated images. (b) Local maxima near angles π/4 move away from the red line. (c) Corrected version [27].
Applying the angle detection for an image f(x,y) with a set of angles can be thought of as a computed projection of the input image along the angles in the image, which can be written mathematically by defining Eq. (7) [29,30].
cos sin
x y
(7)
The two polar coordinates r and θ can be converted to the Cartesian coordinates x and y using the trigonometric functions sine and cosine:
cos , sin
xr yr (8)
The two Cartesian coordinates x and y can be converted to polar coordinates r by Eqs. (9) and (10).
2 2
2
2
arctan( ) 0
arctan( ) 0 0
arctan( ) 0 0
0 0
0 0
0 0 0 y x y x y x if x
if x and y
if x and y
if x and y
if x and y
if x and y
(10)
The angle of the vehicles can be calculated using Radon transform properties such as θ, which can be used as one of the traffic incident features. For this goal
θ needs to be compared with Tθ as threshold.
Another feature of traffic incidents is traffic flow in special parts of a roadway, which is commonly used in incident detection algorithms [24]. Traffic incidents affect traffic flow and make the number of vehicles in the scene increase rapidly. In order to detect an incident, the traffic flow is measured and compared. Analyzing the traffic flow under normal traffic conditions and under incident conditions shows that the number of vehicles is different in both situations. Figure 9 shows the different values of traffic flow for different conditions. The red line represents the incident-condition flow and the blue line shows the normal condition of the roadway. The difference between both values can be seen between 35 and 50 seconds after start. After 35 seconds the number of vehicles increases rapidly in the scene. It can be useful to compare traffic flow every single second with a threshold, which is the maximum traffic flow value under normal conditions.
Traffic flow (T) is the number of vehicles present in the scene during a specific time interval and is defined by Eq. 11.
60 i 1N
T 60
i
(11)
where Ni is the number of vehicles in one second within a time interval of one
minute.
The traffic flow within a single minute is calculated, and is then compared to Tt
as the threshold for traffic flow.
4
Bottleneck Detection
Finally, the above features are considered for traffic incident detection, along with bottleneck presence. When a heavy accident happens on a highway, finding the correct direction of each vehicle is quite difficult and in some cases impossible due to traffic jams and vehicles being too close to each other [31]. On the other hand, if an accident occurs in the middle of a road or in the vehicles intake sides, finding global traffic flow is not useful and global traffic flow shows a normal traffic situation [32,33]. Bottleneck detection is a useful way to find an incident area. No efficient previous study has been done on aerial images to find bottlenecks, while [34] used surveillance cameras for vehicle tracking to extract traffic information on freeways. Their system relies on video to track vehicles and follow their path to measure traffic flow. Vehicle tracking is a time-consuming and process-intensive task and does not perform well during traffic jams, because vehicle detection from a congregation of vehicles via surveillance cameras is quite difficult. A system that can detect traffic using a single image is economical, fast, accurate and useful. In our system, which uses images received during a specific time interval, for example every fifteen minutes, and aerial images, the traffic flow and bottlenecks are distinguishable.
Figure 10 Sites on highways for normal surveillance (courtesy of [35]).
There is a relation between the capacity of a freeway and the density/flow of vehicles [36,37]. Using capacity and density it is easy to detect flowing traffic, when the proposed system cannot detect it. However, our system can find traffic/number of vehicles within a specific zone without any initializing and is therefore able to detect bottlenecks. Our method of finding traffic is approximately the same as in other studies, such as [36,37], but the detection of cars is an image processing system that is intelligent and finds normal/heavy traffic using feedback.
figures can be calculated in each zone separately; each zone is shown by a green rectangle in Figure 11.
Figure 11 Traffic flow zones on the right side of a road.
Without any incident, the traffic flow in each zone should be equal to the global traffic flow. In case of an incident, the traffic flow in some zones will have an obvious difference with the global traffic flow or in other zones. Eq. 12 shows how to calculate the global traffic flow using traffic zones.
T
global=
���
1
� , ∀��=
Ni 60 i=1
60
(12)
For incident detection, each zone should be compared to its neighboring zones. If there is an obvious difference, higher than a predefined threshold, a traffic bottleneck has been found. For confirmation, traffic zone comparison will continue for all zones. If an incident is present in a road image, two groups of zones, one high-flow and one low-flow, will be formed. In some cases, there can be two or three accidents in one image. Consequently, there will be three groups that show three separate bottlenecks. Finding bottlenecks using zones is quite easy, like a projection line, zones are swept one after another orderly and each transformation from high-flow to low-flow suggests a bottleneck and can be a sign of an incident on the road. Figure 12 shows a bottleneck on a road. The bottleneck in Lane A can be discovered by first separating two groups of zones. The bottleneck is recognized when we compare traffic flow in zone X5
with traffic flow in zone X6. Lane B (the return lane) has low-flow traffic in all
zones and is in a normal situation.
Lane A Lane B
Figure 12 Traffic-flow zones added to a highway image.
G1 G2
X
1X
2 … …X
5X
6X
7 … … ..X
15X
16In Figure 12, thirty-six zones are set on both sides of a highway. This means traffic flow is shown inside each of the sixteen separate zones on each side. In lane A, zone X1 to X16 , and, similarly, in lane B, zone Y1 to Y16.
Figure 13 Recognizing a bottleneck in lane A. Finding bottlenecks is the same as finding a threshold value in binarization by separating independent peaks.
Obviously, the traffic-flow in lane B is quite low and near zero. As shown in Figure 12, in lane A there is a high traffic-flow in zones X6 to X16 and a low
traffic-flow in zones X1 to X5. The key is in the traffic-flow changing from low
to high from G1 to G2. Changing traffic-flow from low to high begins in X6 and
continues until X16. X6 to X16 make up G2 group with a high traffic flow,
against X1 to X5 making up G1 with a low traffic flow. For noise removal and
preventing false bottleneck detection, making groups such as G1 and G2 is necessary.
Finding bottlenecks has the same algorithm as establishing a threshold value in binarization. Finding entropies in Figure 13 leads us to discover the bottlenecks. In other words, the place that separates two independent peaks in a vector is the bottleneck place.
Calculating standard traffic flow needs a series of aerial images and object tracing to count how many vehicles pass a window/zone in a specific time/period. Meanwhile, bottleneck detection can be done offline and without processing a number of concatenated aerial images. Furthermore, taking and transforming aerial images is time-consuming, involves extra expenses, while processing offline and without a series of images is economical and fast. This bottleneck detection method can find incidents on a highway using one image, not a connected series of images.
In bottleneck detection, junctions and traffic lights should be selected and marked. Commonly, there is a high traffic flow before junctions and traffic lights and there is definitely low traffic flow after them. In traffic-bottleneck detection this can lead to a wrong decision. This is a drawback of bottleneck detection because without supervising this method, traffic lights and junctions are assumed to be bottlenecks and incidents. We should know where the hot spots are (junctions, traffic lights, bumps, etc.) and make a “does not matter” comparison zone there. There is still one drawback, because if an incident/accident happens in a hot spot, the system cannot recognize it with
5 10 15
0 2 4
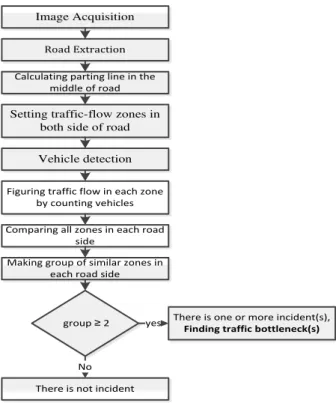
traffic-bottleneck detection and needs to fall back on angle and standard traffic flow (number of cars per time period). The flowchart for traffic-bottleneck detection and incident detection is shown in Figure 14.
Image Acquisition
Road Extraction
Calculating parting line in the middle of road
Setting traffic-flow zones in both side of road
Vehicle detection
Figuring traffic flow in each zone by counting vehicles Comparing all zones in each road
side
Making group of similar zones in each road side
There is one or more incident(s),
Finding traffic bottleneck(s)
group ≥ 2
There is not incident yes
No
Figure 14 Flowchart for traffic bottleneck detection.
5
Results
results of this study with the bagging-based SVN implementation in [2], which achieved a DR of 84.78%, shows that even though they used ground-camera images with a high resolution, the results of our system showed a better performance. Another comparison: [9] implemented a GIS based AID system and achieved an accurate-detection percentage of 67.42%, which is also lower than our results. Finding and counting vehicles with bottleneck detection windows/zones in high-resolution aerial images produced acceptable results. It had the same result as the normal method using vehicle angle and time/period traffic flow. Using low-resolution aerial images, the method is inefficient, while traffic-bottleneck detection is efficient enough to achieve a reasonable and acceptable result.
Table 1 Incident detection results.
Site Number of vehicles
Number of detected vehicles
Incident detection result (True/False)
Traffic bottleneck Detection (true/False)
Road1 8 7 T T
Road2 52 47 F T
Road3 31 24 T T
Road4 30 27 T T
Road5 19 17 T T
Road6 55 44 F F
Road7 23 23 T T
Road8 10 10 T T
(a)
(b)
(c)
(d)
6
Conclusions
In this paper, we focused on the issue of vehicle detection, road extraction and incident detection using high-resolution aerial imagery for traffic analysis. A traffic-bottleneck detection method was proposed by adding zones to calculate traffic flow within these zones and comparing the results with each other. Finding traffic incidents with this method is economical due to needing only one image and no permanent connection to the image source. Previous methods usually use live video images or a series of images from a road for a specific period/time; therefore a long-time connection or permanent connection to satellite or balloon is required. Using our bottleneck detection method, one image per surveillance-period is enough and a permanent connection or using video processing to calculate traffic flow is not necessary.
Further work could include more training samples for the neural network classifier and using more information such as edge shapes to improve the detection rate. This method can also use other features for incident detection from high-resolution satellite images. Nowadays, xerographic satellites and special airplanes provide aerial images. We can control road traffic from a traffic balloon, which has more flexibility. There is the possibility of following the road via traffic balloon on autopilot. Also, there can be several balloons in one road district, which is a separate issue.
References
[1] Lu, J., Chen, S., Wang, W. & Zuylen, H.V., A Hybrid Model of Partial
Least Squares And Neural Network For Traffic Incident Detection,
Expert Systems with Applications, ISSN 0957-4174, pp. 4775-4784, DOI: 10.1016/j.eswa.2011.09.158, 2011.
[2] Chen, S., Wang, W. & Zuylen, H.V., Construct Support Vector Machine
Ensemble To Detect Traffic Incident, Expert System with Applications,
Elsevier, ISSN 0957-4174, PP. 10976-10986, DOI: 10.1016/ j.eswa.2009.02.039, 2009.
[3] Wen, H., Yang, Z., Jiang G., & Shao, C., A New Algorithm of Incident
Detection on Freeways, Vehicle Electronics Conference, IVEC 2001.
Proceedings of the IEEE International, pp.197-202, DOI: 10.1109/ IVEC.2001.961753, 2001.
[4] Chen, S.Y. & Wang, W., Decision Tree Learning For Freeway
Automatic Incident Detection, Expert System with Applications, Elsevier,
ISSN 0957-4174, pp. 4101-4105, DOI: 10.1016/j.eswa.2008.03.012, 2008.
[5] Masters, P.H., Lam, J.K. & Wong, K., Incident Detection Algorithms for
Navigation and Information Systems Conference, 2, pp. 295- 310, DOI: 10.1109/VNIS.1991.205776, 1991.
[6] Sujeeva A.W., An Application of Artificial Neural Networks In Freeway
Incident Detection, PhD. Dissertation, University of South Florida, 1998.
[7] Skorput, P., Mandzuka, S. & Jelusic, N., Real-Time Detection Of Road
Traffic Incidents, Promet-Traffic & Transportation, 22, pp. 273-283,
2010.
[8] Moynihan, G.P., Fonseca, D.J., Brumback, T. & Fernandes, H., Evacuation Decision Support System for Road Incident Detection and
Characterization, Journal of Homeland Security and Emergency
Management 6, 2009.
[9] Durduran, S.S., A Decision Making System To Automatic Recognize of
Traffic Accidents on The Basis of A GIS Platform, Expert System with
Application, pp. 7729-7736, 2010.
[10] Jin, H., Feng, Y.M. & Li, Z.R., Extraction of Road Lanes from High-Resolution Stereo Aerial Imagery Based on Maximum Likelihood
Segmentation And Texture Enhancement, Digital Image Computing:
Techniques and Applications, pp. 271-276, DOI: 10.1109/DICTA. 2009.52, 2009.
[11] Lin, Y.C. & Saripalli, S., Road Detection and Tracking from Aerial Desert Imagery, Journal of Intelligent & Robotic Systems 65, pp. 345-359, DOI: 10.1007/s10846-011-9600-6, 2012.
[12] Sahli, S., Ouyang, Y., Sheng, Y.L. & Lavigne, D.A., Robust Vehicle
Detection in Low-Resolution Aerial Imagery, Airborne Intelligence,
Surveillance, Reconnaissance (ISR) Systems and Applications, DOI: 10.1117/12.850387, 2010.
[13] Sahli, S., Duval, P.L., Sheng, Y.L. & Lavigne, D.A., Robust vehicle Detection In Aerial Images Based On Salient Region Selection And
Superpixel Classification, Airborne Intelligence, Surveillance,
Reconnaissance (ISR) Systems And Applications, DOI: 10.1117/ 12.883890, 2011.
[14] Kahaki, S.M.M. & Nordin, M.J. Highway Traffic Incident Detection
Using High-Resolution Aerial Remote Sensing Imagery. Phys. Int., 1, pp.
110-114, DOI: 10.3844/pisp.2010.110.114, 2010.
[15] Higashikubo, M., Hinenoya, T. & Takeuchi, K., Queue Length
Measurement Using an Image Processing Sensor, Universal Traffic
Management Society of Japan, 2005.
[16] Juozapavicius, A., Blake, R. & Kazimianec, M., Image Processing in
Road Traffic Analysis, Nonlinear Analysis: Modeling and Control,
Lithuanian Association of Nonlinear Analysts Journal, 10(4), pp. 315-332, 2005.
[17] Ho, L. W. & Kleeman, L., Real Time Object Tracking using Reflectional
[18] Hirzallah, N., Automated Camera Monitoring System for Selective Areas
of Interest, J. Comput. Sci., 3, pp. 62-66. DOI: 10.3844/jcssp.2007.62.66,
2007.
[19] Panich, S., Method of Object Detection for Mobile Robot, J. Comput. Sci., 6, pp. 1151-1153. DOI: 10.3844/jcssp.2010.1151.1153, 2010. [20] Lairong, C., Yuan, C. & Ronghua, J., Automatic Incident Detection
Algorithm Based on Support Vector Machine. Natural Computation
(ICNC), Sixth International Conference. DOI: 10.1109/ICNC.2010. 5583920, 2010.
[21] Hong, Z.A. & Li, L., Artificial Immune Approach for Vehicle Detection
from High Resolution Space Imagery, IJCSNS, 7(2), pp. 67-72, February
2007.
[22] Hinz, S., Automatic Road Extraction in Urban Scenes-and Beyond, International Archives of Photogrammetry and Remote Sensing, 2005. [23] Zhenfeng, Z., Hanqing, L., Hu, J. & Keiichi, U., Car Detection Based on
Multi-Cues Integration, IEEE, 2004. DOI: 0-7695-2128-2/04.
[24] Kahaki, S.M.M. & Nordin, M.J., Vision-Based Automatic Incident
Detection System Using Image Sequences For Intersections, Pattern
Analysis and Intelligent Robotics (ICPAIR), pp. 3-7, 2011. DOI: 10.1109/ ICPAIR.2011.5976902.
[25] Gonzalez, R.C. & Woods, R.E., Digital Image Processing, 2nd ed., New Jersey: Prentice Hall, pp. 68-70, 2002.
[26] Gonzalez, R.C., Woods, R.E. & Eddins, S.L., Digital Image Processing
Using MATLAB, 1st ed., Prentice Hall, pp. 102-105, September 5, 2003.
[27] Oriol, R.T. & Valveny, E., Radon Transform for Lineal Symbol
Representation, IEEE, icdar, 1, pp.195, 2003.
[28] Beylkin, G., Discrete Radon Transform, IEEE Transactions on Acoustics, Speech and Signal Processing, 35(2), pp. 162-172, 1987. [29] Sanz, J.L.C., Hinkle, E.B. & Jain, A.K., Radon And Projection
Transform-Based Computer Vision, Springer-Verlag, pp. 132-138, 1987.
[30] Jafari-Khouzani, K. & Soltanian-Zadeh, H., Radon Transform
Orientation Estimation For Rotation Invariant Texture Analysis, IEEE
Transactions on Pattern Analysis and Machine Intelligence, 27(6), pp. 1004-1008, June 2005.
[31] Zeller, K., Hinz, S., Rosenbaum, D., Leitloff, J. & Reinartz, P. Traffic
Monitoring without Single Car Detection from Optical Airbone Images,
ISPRS Hannover Workshop, July 2009.
[32] Reinartz, P., Lachaise, M., Schmeer, E., Krau, T. & Runge, H., Traffic
Monitoring with Serial Images from Airborne Cameras, ISPRS Journal of
Photogrammetry and Remote Sensing, 61, pp. 149-158, 2006.
Angle Camera System, European Transport Research Review, Vol. 1, Springer, ISSN 1867-0717, pp. 11-21, 2009.
[34] Coifman, B., Beymer, D., McLauchlan, P. & Malik, J., A Real-Time
Computer Vision System for Vehicle Tracking and Traffic Surveillance,
Transportation Research Part C: Emerging Technologies, 6(4), pp. 271-288, 1998.
[35] Cassidy, M.J. & Bertini, R.L., Some Traffic Features at Freeway
Bottlenecks, Transportation Research Part B: Methodological, 33(1), pp.
25-42, 1999.
[36] Bertini, R.L. & Cassidy, M.J., Some Observed Queue Discharge Features
At A Freeway Bottleneck Downstream of A Merge, Transportation
Research Part A: Policy and Practice, 36(8), pp. 683-697, 2002.
[37] Chung, K., Rudjanakanoknad, J. & Cassidy, M. J., Relation between
Traffic Density and Capacity Drop at Three Freeway Bottlenecks,


![Figure 10 Sites on highways for normal surveillance (courtesy of [35]).](https://thumb-eu.123doks.com/thumbv2/123dok_br/17173082.241402/12.893.178.697.183.648/figure-sites-highways-normal-surveillance-courtesy.webp)