! "
#
# $ % &' # ( ) *
! "
!
"
#
$
% #
&
'
% # (
)
This paper presents the experimental analysis of the propagation of a disturbance with a fixed frequency in the incidence velocity of the cross flow through a tube bank, and its influence on the velocity fluctuations inside the bank. The disturbance is generated outside the bank by vortex shedding from an obstacle. The tube banks investigated had square arrangement and aspect ratio P/D = 1.60 and 1.26. Air was the working fluid. Measurements were performed with hot wires. Behavior of fluctuating velocities is described by means of autospectral density. The results show that the frequency of the disturbance remains unchanged as it passes through the bank, and subsists until the 4th row in spite of the high turbulence intensities and of the fact that flow velocity inside the bank varies with the position. This fact indicates that external excitations can be transferred to the solid boundaries of the bank maintaining their original frequency. Continuous Wavelet Transforms of the signals show that, in time domain, the frequency of the disturbance has an almost steady behavior.
Keywords: tube bank, turbulent flow, velocity fluctuations
Introduction
Motivation
1Banks of tubes or rods are found in the nuclear and process
industries, being the most common geometry used in heat exchangers. Tube banks are the usual simplification for fluid flow and heat transfer in the study of shell-and-tube heat exchangers, where the coolant is forced to flow transversely to the tubes by the action of baffle plates. Geometric characterization of a tube bank is made by the P/D-ratio, being D the tube diameter, and P the pitch, which is the distance between the centerlines of adjacent tubes. Tube arrangement is also equally important in the characterization of fluid flow and heat transfer of a tube bank.
Attempts to increase heat exchange ratios in heat transfer equipments do not consider, as a priority of project criteria, structural effects caused by the turbulent fluid flow. Induction to vibration is, therefore, not a priority factor in the design of tube bank structures, at least unless failures occur (Païdoussis, 1982).
In general, fluid flow loads in a tube bank (and any other structure submitted to a flow) can be classified as static and dynamic. The former due to the mean pressure variation along the flow through the bank, and the latter due to pressure and velocity fluctuations of the turbulent flow, of which characteristics are strongly influenced by the geometry of the bank (Endres and Möller, 2001-a). Dynamic loads are produced by phenomena like vortex shedding, turbulence buffeting as well as acoustic resonances in tube banks submitted to gas flow, which can induce vibration on the banks (Blevins, 1990).
Turbulence excitation is also important in cross flow, since it generates pressure fluctuations around the surface of the components forcing them to vibrate, so that long-time fretting wear damage can occur. Turbulence excitation can be generated locally by the fluid as it flows around the components of interest, which is called near field excitation. If the turbulence is generated by upstream components such as inlet nozzles, elbows and other piping elements, it gives raise to far-field excitation (Pettigrew et al., 1997).
Paper accepted April, 2009. Technical Editor: Francisco R. Cunha
Fluidelastic instability and vortex shedding are assumed to be distinct, but it may not always be so, and resonance with a flow periodicity and fluidelastic instability may occur simultaneously. In this case, instead of two separate excitation mechanism, there may be a complex interaction of the two mechanisms (Price, 1995).
Vorticity shedding in tube banks with intermediate tube spacing (longitudinal P/D-ratio between 1.75 and 2.7) and in-line arrays are generated by a global jet mode and persist over the whole depth of the tube bank. Acoustic resonance is then caused by the coupling between the resonant acoustic mode and the instability of the shear layer which separates from the tubes. When tube spacing is made smaller (longitudinal P/D < 1.5), the jet instability becomes weaker, and it occurs at the upstream rows only. As in intermediate tube spacing, acoustic resonance in this case is also excited by the shear layer instability (Ziada and Oengören, 1993).
Tube banks have being widely studied in the last decades. The first systematic studies of fluid flow distribution and pressure drop in tube banks of shell and tube heat exchangers and steam generators, known to the Authors, are the work of E. Grimison and the doctoral thesis of P. Wiemer, both in 1937. Both works dealt mainly with friction factors, but Wiemer made a very interesting flow visualization study using sand boxes models of heat exchangers and steam generators. His results show the strong influence of baffle plates in the whole flow pattern due to boundary-layer separation and recirculation processes.
Fitzpatrick et al. (1988) investigated autospectral densities of velocity fluctuations in the so called “through flow” region of a tube bank with square arrangement and P/D = 1.73. The purpose of their experimental work was to evaluate Strouhal number values in tube banks with a large number of rows. Periodicities arising from vortex shedding and turbulence buffeting from the alternation of the width of the passages were analyzed. In the first rows, they found that vortex shedding predominates which results in more defined peaks on frequency spectra with higher Strouhal numbers than in the inner rows, where the influence of turbulence buffeting was found to be higher than in the first rows. The value of the Strouhal number is, according to this study, function of the position inside the bank, as well as of the Reynolds number and of the geometry of the bank.
buffeting cannot produce peaks in spectra since the energy of this phenomenon is distributed in its whole frequency range.
Žukauskas et al. (1980) consider that in a heat exchanger, the forces induced by the flow on the tubes and the vibrations generated by these forces are controlled by the upstream flow structures in the shell region of the heat exchanger. In this study, the tubes could vibrate while tube wall pressure fluctuations and vibration amplitudes were measured. The results show that, due to the complexity of the flow, there are small differences between the vibration frequencies of the tubes in different rows, which are very close to the natural frequency of the tubes.
Weaver et al. (2000) present an overview on flow-induced vibration problems, considering the several excitation mechanisms and presenting a list of the most important references at that time and suggested areas for future research. Careful experimentation is required to improve the understanding of excitation mechanisms, establish more precise guidelines, and providing benchmark for evaluating codes that were not still developed, due to the complexity of the problems and the limitation of the current computer technology. The lack of information on the space time coherence of the random forcing function in tube banks is attributed to the difficulty in installing small sensors inside tubes.
In an earlier paper, Weaver (1993) emphasizes also that care must be taken while comparing results of Strouhal numbers of vortex shedding and acoustic resonances of different researchers because different definitions of flow velocity and array geometry have been used.
By means of velocity and pressure measurements, as well as flow visualization in presence or not of acoustic resonance, Ziada (2006) describes the vorticity shedding excitation in tube bundles with in-line and staggered arrangements and its relation to the acoustic resonance mechanism. Vorticity shedding excitation is shown to be generated either by jet, wake, or shear layer instabilities. The tube bank arrangement, the spacing ratio, and Reynolds number determine which instability mechanism will prevail, and thereby the relevant Strouhal number for design against vorticity shedding and acoustic resonance excitations.
Other sources of disturbances, which are not considered in most of the studies performed in laboratory conditions, may be also present in actual flows through tube banks. They can be produced by boundary-layer separation at the heat exchanger entrance or at any other structural element present in the plant, or even by flow pulsations due to the pump blades.
In spite all the efforts devoted by many authors concerning the several aspects of the flow through tube banks, the need of deeper understanding physics of fluid structure interaction, including the turbulent flow through tube bundles in cross flow, still remains.
Background
The concern about heat transfer equipment integrity is due to the close relationship between fluid flow around a solid surface and the vibrations induced by the flow in the structure by wall pressure fluctuations. Pressure fluctuations result from velocity fluctuations at several points of the flow field. The resulting pressure field is described by the Poisson's equation obtained from the divergence of the Navier-Stokes equation (Willmarth, 1975) which demonstrates that the pressure fluctuation field is not a local quantity, but depends on an integral over the entire velocity field in its surroundings. Pressure fluctuations are, thus, produced by the interaction of velocity gradients with velocity fluctuations and Reynolds stresses (Rotta, 1972).
The search of form and magnitude of pressure and velocity fluctuations and the interdependence between these quantities is
necessary for the comprehension of the complex phenomena in tube banks. According to Townsend (1976), the amplitude of the pressure fluctuations may be influenced by velocity fluctuations at a distance comparable to the wave length of these fluctuations. By increasing the turbulence intensity, pressure fluctuations will also be increased, therefore, it is to expect that when an external disturbance is transported by the main flow through the tube bank, influencing the flow characteristics, it will also influence the fluctuating pressure field on the solid boundaries.
Objectives
In an open flow, a disturbance in the flow field, like a von Kármán vortex street, moves with a velocity of which value is smaller than the velocity of the main flow (Schlichting, 1976). In a tube bank, this disturbance will be accelerated as the flow passes through the narrow gaps between the tubes, or, conversely, decelerated in the wider regions between two rows.
The purpose of this paper is to present the study of the propagation of a disturbance with a fixed frequency, in the incidence velocity of the cross flow through a tube bank with square arrangement and its influence on the pressure and velocity fluctuations inside the bank. The disturbance is generated by an obstacle, which acts as a vortex generator, placed upstream of the bank. Similar measurements were also performed in the channel without tube banks and with only one tube for comparison and interpretation of the results of the measurements in the tube bank.
Nomenclature
A = Width of the vortex generator, Fig. 2, m
A/S = Vortex generator geometric parameter, dimensionless Cxy(τ) = Correlation coefficient, dimensionless
D = Diameter, m
e = Base of natural logarithm, dimensionless f = Frequency, Hz
fD = Shedding frequency, Hz
φxx(f) = Autospectral density function, [x(t)] 2
/Hz L = Length, m
P = Pitch, m p = Pressure, Pa
P/D = Tube bank aspect ratio, dimensionless
ReG = Reynolds number: ReG=UGDν, dimensionless ReR = Reynolds number: ReR=URDν, dimensionless RMS(x) = Root mean square value, [x]
Rxy(τ) = Correlation function, [x(t).y(t)] S = Gap spacing (P-D), m
StrG, = Strouhal number: Str= fDUG, dimensionless StrR = Strouhal number: Str=fDUR, dimensionless t = Time, s
U , v = Velocity, m.s-1
u i , j = Velocity components, m.s-1 UR = Incidence (reference) velocity, m.s
-1 1 UG = Measured gap velocity, m.s-1 x i , j = Spatial coordinates, m
x(t), y(t) = Generic time functions, [x(t), y(t)] [...] denotes units of ....
Greek Symbols
ν = Kinematic viscosity, m2.s-1
τ = Time delay, s
θ = Integration time, s Subscripts
x, y relative to x, y
G, R relative to gap, reference
Experimental Technique
The test section is the same described in Endres and Möller (2001-a;b), it being a 1370 mm long rectangular channel, of 146 mm height and a maximal (adjustable) width of 193 mm. Air, at room temperature, is the working fluid, driven by a centrifugal blower, passed by a settling chamber and a set of honeycombs and screens. The upstream turbulence intensity was about 2 %.
Inside the test section, a tube bank was placed. The tube bank was five rows deep and four lines wide, had square arrangement and an aspect ratio (P/D) of 1.60. The tubes were smooth with 32.1 mm outside diameter. They were rigidly mounted in the channel and not heated.
To generate a far-field disturbance, a vortex generator was placed on the centerline of the channel. Therefore, the disturbance was a wake produced by the vortex generator. The position of the vortex generator was carefully chosen, so that the resulting wake reached the tube bank between the second and third lines of the first row. The axis of the vortex generator was parallel to the axes of the tubes in the bank.
The angle of incidence of the flow on the tubes and on the vortex generator was 90o. Before the tube bank, a Pitot tube was placed at a fixed position to measure the incidence velocity which was taken as reference velocity for the experiments. A scheme of the test section is shown in Fig. 1.
Vortex
generator
40 93
Fixed probe
Moving
probe
0 1 2 3 4 5 6 7 8
Locations
Flow
Location of an
isolated
instrumented
tube
Locations of
the tube
instrumented
with the
pressure
transducer
Figure 1. Schematic representation of the location of measurements (dimensions in mm).
For the study of the propagation of a disturbance in the tube bank, three different experiments were performed. The first one was the measurement of the propagation of the disturbance in the channel without tube bank, named “free channel”, this being a reference experiment for the subsequent ones. No measurement of pressure fluctuations were performed in this experiment. The second experiment had the purpose of studying the effect on a single isolated cylinder of a disturbance transported by the flow.
The Reynolds number (ReR), based on the tube diameter and the
incidence velocity, was 2.0•104 for the experiment with the single
cylinder and 1.7•104 for the tube bank experiment. By taking the
velocity measured in the center of the narrow gap between the rods,
the value of the Reynolds number of the flow in the tube bank (ReG)
is 5.1•104. Subscripts R and G denote reference velocity and the
velocity in the narrow gaps between the tubes, respectively (Endres and Möller, 2001-b).
For all the measurements in the free channel, the single cylinder and the tube banks, the vortex generators were placed at the same location. They were mounted in the channel so that the flow impinged normally to the flat surface. The width of the vortex generators was different for the tube bank and the free channel experiments, so that the same shedding frequency could be obtained in both situations investigated to compensate velocity differences in the free channel and in the channel with the tube bank, due to the additional pressure drop produced by the bank. Figure 2 shows a scheme of the cross section of the vortex generators used. The main dimensions are given in Table 1. A third vortex generator was used in the additional measurements described below. Table 1 presents also dimensionless relationships between the width “A” (Fig. 2) of the vortex generator, the tube diameter and the gap width S (P-D). The characteristic Strouhal number defined with the incidence velocity and the width “A” for this geometry of vortex generators is 0.14 (Blevins, 1990).
A
C B
Flow
Figure 2. Schematic view of the cross section of the vortex generators (impinging flow from left to right).
Table 1. Main dimensions of the vortex generators used. Dimension Vortex generator # /Purpose
1 2 3
“Free Channel”
“Tube Bank”, “Additional Measurements”
“Additional Measurements”
A (mm) 37.7 32.8 20.5
B (mm) 18.0 13.4 9.0
C (mm) 2.8 1.6 1.2
Length (mm)
146 146 146
A/D 1.17 1.02 0.64
A/S P/D = 1.6
- 1.70 1.06
A/S P/D = 1.26
- 3.93 2.46
For the measurement of velocity and velocity fluctuations, DANTEC constant temperature hot wire anemometers were applied. One probe was placed at a fixed position downstream of the vortex generator, while a second one could be displaced to several positions in the channel or in the bank, where applied. Care was taken to avoid placing the moving probe directly in the wake of the fixed probe.
mounted flush to the walls. Prior measurements in pipe flow showed that this mounting technique was adequate to the measurements to be performed. Discrepancies appear only after a frequency of 1500 Hz (Endres and Möller 1994, 2001-b). The amplifying effect is in accordance with predictions by the method proposed by Holmes and Lewis (1987).
Figure 3 shows a scheme of the pressure transducer mounting technique inside the tube. The tube instrumented with the pressure transducer was placed in several rows of one of the central lines Fig. 1.
wiring
1.7 mm (int.) tubing
L=24 mm
pressure transducer
Figure 3. Instrumented tube (schematic).
In order to characterize the fluctuating pressure field the central tube of the third row, instrumented with the pressure transducer, could be rotated to perform measurements at each 10º. These angles are measured clockwise between the direction of the main flow and the position of the pressure tap. Zero degree (0º) corresponds to the position where the pressure tap faces the main flow.
Data acquisition of pressure and velocity fluctuations was performed simultaneously by a Keithley DAS-58 A/D-converter board with a sampling frequency of 4 kHz, and a low pass filter set at 2 kHz. To eliminate the DC part of the signal, a high pass filter, set at 1 Hz, was also used.
Analysis of uncertainties in the results showed a contribution of 1.4 % from the measurement equipment (including hot wire, pressure transducer and A/D converter). In the measurements of pressure fluctuations, tubings are responsible for 5 % of the uncertainties, leading to a total value for the spectra of pressure fluctuations, up to 1000 Hz, of 6.4 %.
Results
Preliminary Measurements
Before starting the experiments, the flow distribution and the turbulence intensity in the test section were measured, showing an uniform velocity profile and a turbulence intensity of about 2%. This value was almost the same of the work of Zdravkovich and Stonebanks (1988), but higher than of the work of Ziada and Oengören (1993), which was 1%. Results of velocity measurements showed an uniform flow distribution in the gaps between the tubes.
Measurements of vibrations of the test section (including the tubes of the tube bank) were also performed with help of a METRA accelerometer, to identify possible influence produced by the blower or by its electrical motor. Two important resonance frequencies of the test section were detected, with values about 2 and 8 kHz.
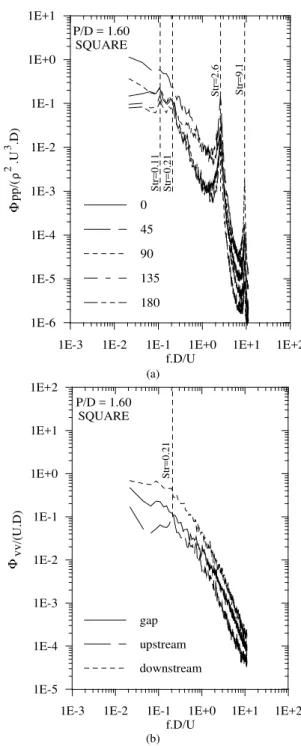
The next step was the measurement of the mean velocity field as well as pressure and velocity fluctuations inside the tube bank without the presence of the turbulence promoters. The central tube of the third row was instrumented with the pressure transducer. Experimental results of spectra, shown in Fig. 4, are presented as functions of the dimensionless frequency in form of the Strouhal number, defined with the tube diameter and the velocity in the
narrow gaps between the rods. This velocity was measured with the hot wire probe. Velocity and velocity fluctuations were measured in three positions: in the center of the narrow gap between the tubes, directly in front of the pressure tap at position 90º, and at a half row distance upstream and downstream of that point. These positions are marked “gap”, “upstream” and “downstream”, respectively, in Fig. 4-b. For the determination of the results in Fig. 4, the sampling frequency was of 16.1 kHz, while the signals of the instruments were high pass filtered at 1 Hz and low pass filtered at 8.05 Hz.
1E-3 1E-2 1E-1 1E+0 1E+1 1E+2
f.D/U 1E-6
1E-5 1E-4 1E-3 1E-2 1E-1 1E+0 1E+1
pp
/(
.
U
.
D
)
0
45
90
135
180 P/D = 1.60
SQUARE
2
3
ρ
Φ
S
tr
=
0.
11
S
tr
=
0.
21
S
tr
=
2.
6
S
tr
=
9.
1
(a)
1E-3 1E-2 1E-1 1E+0 1E+1 1E+2
f.D/U 1E-5
1E-4 1E-3 1E-2 1E-1 1E+0 1E+1 1E+2
vv
/(
U
.D
)
gap
upstream
downstream P/D = 1.60
SQUARE
Φ
S
tr
=
0.
21
(b)
Spectra of velocity fluctuations in P/D = 1.60 show, in the positions “upstream”, the presence of peaks at Str = 0.21, corresponding to a frequency of 152 Hz, which coincides with the value expected in the case of a single cylinder. This is also observed in the spectra of pressure fluctuations. This value is not in accordance with Fitzhugh’s compilation, presented in Blevins, 1990 (Str = 0.31).
Spectra of pressure fluctuations show peaks at Str = 0.11 and 0.21. Pronounced peaks are found also at about Str = 2.0 and 9.0, which correspond to the calculated resonance frequencies, as mentioned before.
A more detailed discussion about the spectral results can be found in Endres and Möller, 2001-a.
With the knowledge of the frequencies generated by the bank, the determination of the shedding frequency of vortex generators #1 and #2 was then performed. Vortex generators were constructed so as the resulting frequencies did not coincide with the frequencies of the bank. Free channel flow and the flow in the channel with the tube bank had different velocities since the blower operated with the same speed, resulting different pressure drops and thus different flow rates. The resulting shedding frequencies (fD) were, for the vortex generator #1 applied to free channel flow (without and with a single tube) 42 Hz and for the channel with the tube bank 45 Hz, this being vortex generator #2. A Strouhal number calculated with this frequency, the tube diameter and the gap velocity has a value of 0.060, different of the marked Strouhal numbers corresponding to the frequencies generated in the bank as shown in Fig. 4.
In the case of vortex generator #1, the spectra showed a second peak at 84 Hz. The occurrence of this second peak is an inherent feature of separated flows. According to nonlinear hydrodynamic stability theory and experimental findings, higher harmonics are generated when the amplitude of the fundamental component exceeds about 4% of the mean flow (Ziada, Oengören, 1992). This effect will appear also in all results in this work.
The transversal length scale of the disturbance is of the same order of the width of the vortex generator, which relation to the tube diameter is given in Table 1.
All the above frequencies are far below from the natural frequencies of transverse acoustic modes of closed rectangular volumes with rigid walls, which can be calculated with the methodology given by Blevins (1990). The obtained resonance frequencies lie between 769 and 881 Hz for the first mode, corresponding to values of the Strouhal number from 1.0 to 1.2. For the second mode, resonance frequency values range from 1539 to 1761 Hz.
Free Channel and Flow on a Single Tube
The first experiment was performed in the free channel, without the tube bank. A hot wire probe was placed in a fixed location at a distance of 40 mm of the vortex generator, in the region of the wake. A second wire probe was placed in the locations numbered 0 to 8. Location “0” was 133 mm far from the vortex generator. The distance between two subsequent locations was 20.5 mm. Measurements of velocity fluctuations were performed simultaneously with both the fixed and the moving probe as the latter was moved to each new location.
Transit velocity of the disturbance in the free channel was obtained by dividing the distance between two simultaneous measurement points by the time lag of cross-correlations between velocity fluctuations at the fixed probe and at the moving probe. The results showed an increasing transport velocity from location “0” to location “7” with values ranging from 54 % to 73 %, respectively, of the main flow velocity of 9.70 m/s.
After this measurement was completed, a single tube was placed in the location indicated in Fig. 1. The pressure transducer was installed so that the pressure tap was oriented to a position of 90o with respect to the main flow (0o corresponds to the position facing the main flow). Cross-correlations between velocity fluctuations from hot wire probes, as well as between velocity and pressure fluctuations were then determined.
Results show that the disturbance influences the fluctuating pressure field as it influences the velocity field. The frequency of the disturbance is detected in the flow and at the solid boundaries, with lesser intensities as the distance is increased. As the distance from the generating point increases, the propagation velocity of the disturbance also increases, tending to the main flow velocity.
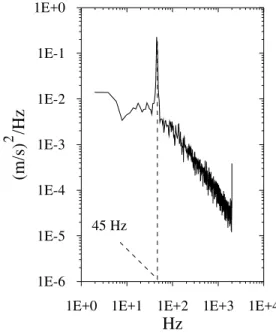
Channel with a Tube Bank
Figure 5 presents autospectral density of the velocity fluctuation after the vortex generator. This is the spectrum of the disturbance before entering the tube bank. A very pronounced peak at 45 Hz is observed, this being the shedding frequency from the vortex generator #2. This frequency value, and thus the vortex generator width, was chosen so as to be different from the frequencies observed in the bank, Fig. 4. For the results in this section, the width “A” of the vortex generator, normalized by the gap spacing “S” (P-D), is A/S=1.7.
1E+0 1E+1 1E+2 1E+3 1E+4
Hz
1E-6 1E-5 1E-4 1E-3 1E-2 1E-1 1E+0
(m
/s
)
/H
z
2
45 Hz
Figure 5. Autospectral density functions of velocity fluctuations measured with the fixed probe after the vortex generator in the channel with tube bank.
1E+0 1E+1 1E+2 1E+3 1E+4 Hz
1E-11 1E-10 1E-9 1E-8 1E-7 1E-6 1E-5 1E-4 1E-3 1E-2
(m
/s
)
/H
z
2
0 1
2
3
4 5
6 7
45
H
z
90
H
z
Figure 6. Autospectral density functions of velocity fluctuations measured with the moving probe inside the tube bank with P/D = 1.60, vortex generator #2, A/S = 1.7, ReG = 5.1••••104. Spectral values are successively divided by 10. . Dashed lines indicate values of the disturbance frequency and its first harmonic.
Autospectral densities of pressure fluctuations measured on the instrumented tube are shown in Fig. 7. The presence of the peaks at 45 Hz and at the first harmonic, 90 Hz, can be clearly observed. In contrast with the results of velocity fluctuations shown in Fig. 6, spectra of pressure fluctuations have, in general, a more uniform distribution throughout the bank. In the first and second rows, the first harmonic (90 Hz) is much more pronounced than the shedding frequency of the vortex generator (45 Hz). This can be originated by a contribution of every vortex generated by the vortex generator passing at the measurement location, producing a frequency which coincides with the first harmonic (pairs of vortices). After position 4, the first harmonic vanishes and the peak at the shedding frequency becomes very pronounced, with increasing values until position 6. At the last row (position 8) the value of the peak intensity is strongly reduced, probably due to the increasing distance from the point of generation of the disturbance and of the influence of the exit conditions. The peak appearing at the maximum frequency corresponds to the calculated resonance and can be completely disregarded in this analysis.
The behavior of the peaks observed in Figs. 6 and 7 can be explained by the fact that in this longitudinal P/D range, between small and intermediate (Ziada and Oengören, 1993), the flow starts forming eddies after the second row, with an established regime after the third row, as observed in the interesting flow visualizations by Ziada et al. (1989), and Ziada and Oengören (1992). Therefore, because the frequency of the disturbance remains unaltered, the wavelength of the disturbance is increased, due to the narrowing of the flow passage after the first row and the consequent acceleration of the flow. This may also increase the amplitude of the disturbance in that region. Due to vortex shedding produced by the interaction of the flow lane with the wake region, after the third row, the raise in the turbulence level causes the reduction of the peaks of the disturbance.
Comparison with the results of the preliminary measurements, Fig. 4, shows that the observed frequency of 45 Hz is not generated in the tube bank, but transported through the bank. As shown in Section 3.2, the frequency generated solely by the flow in this bank has a value of 152 Hz, corresponding to a Strouhal number of 0.21. The value of Str = 0.11 observed in the spectra corresponds to the half of this frequency value.
1E+0 1E+1 1E+2 1E+3 1E+4 Hz
1E-6 1E-5 1E-4 1E-3 1E-2 1E-1 1E+0 1E+1 1E+2 1E+3
P
a
/H
z
2
0
2
4
6
8
45
H
z
90
H
z
Figure 7. Autospectral density functions of pressure fluctuations in the channel with tube bank with P/D = 1.60, vortex generator #2, A/S = 1.7, ReG = 5.1••••104 (pressure transducer at 90o). Spectral values are successively divided by 10. Dashed lines indicate values of the disturbance frequency and its first harmonic.
Cross-correlations between velocity fluctuations measured with the fixed and the moving probe are shown in Fig. 8. Transport velocity of the wake is obtained by means of the time lag of the maximum correlation value (transit time) and the distance between the probes. The second probe is now displaced from position “0” to “7” between second and third lines of the tube bank. The period of the cross-correlations is of 22 ms, showing that the shedded vortexes are transported throughout the bank, maintaining their original frequency as they pass through the successive rows. The value of the transport velocity related to the main flow velocity impinging on the bank, in this case 8.35 m/s, increase from 75% at position “0” to 177% at position “7”. Due to uncertainties in the positioning of the
probe (± 1 mm) and to the fact that the correlations become rough as
the distance from tube bank entrance increases, the value from Pos. 7 should be discarded. Therefore, after the third row the velocity of the disturbance can be considered constant, assuming a mean value of 12.15 m/s, 45.5% higher than the reference velocity. This value corresponds to 48.6% of the velocity measured in the narrow gap between the tubes, in this case 25 m/s. Transit times and corresponding velocities are given in Table 2.
-30 -20 -10 0 10 20 30
ms -0.5
0.0 0.5
C
vv
0 1
2 3 4 56
7
Table 2. Transit velocities of the disturbance obtained from cross-correlations between velocity fluctuations measured with the fixed and the moving probe shown in Fig. 8, P/D = 1.60, vortex generator #2.
Position Distance Transit time velocity Transit % of U
R
% of UG
(mm) (ms) (m/s)
0 93 14.75 6.31 76 25
1 118.7 14.5 8.19 98 33
2 144.4 15.5 9.32 112 37
3 170.1 16.75 10.16 122 41
4 195.8 16.75 11.69 140 47
5 221.5 17.25 12.84 154 51
6 247.2 20.75 11.91 143 48
7 272.9 18.5 14.75 177 59
Discussion
Some very important questions arose from the results presented in this paper: The first one is whether the observed frequencies can be generated in the bank, triggered by the external disturbance, and amplified by the tube bank.
The second one comes from the fact that tube banks are turbulence generators. Therefore, as the flow passes through the bank, the turbulence will grow, dissipating or at least covering the disturbance.
The gap spacing and its relation to the scale of the disturbance may also play an important role. If the width “A” of the vortex generator can be taken as a scale for the vortex size of the disturbance, its amplification or dissipation will be related to the gap width “S”. In this case, the A/S-ratio is the factor for determining whether a disturbance will be dissipated.
However, previous results show also that the observed frequencies were not generated by the bank itself, since measurements of pressure and velocity fluctuations in the tube bank without the vortex generator, Fig. 4, show in spectra of velocity fluctuations small peaks at a value of a Strouhal number of 0.21. This value corresponds to a shedding frequency of 152 Hz in the bank for the Reynolds number investigated.
It is also clear that the observed peaks are also not related to acoustical resonance frequencies, since their frequencies are far below the acoustical resonance frequencies calculated for the test section.
Therefore, additional experiments are necessary to confirm the results and for the correct interpretation of the phenomena observed, focusing on a tube bank with different (smaller) P/D-ratio and another vortex generator.
Complementary Measurements
Four additional experiments were performed, being only velocity fluctuations measured in the same locations given in Fig. 1. A second tube bank with P/D = 1.26 was also used. This tube bank had 5 lines of tubes, and was also five rows deep.
Results of measurements of pressure and velocity fluctuations (without vortex generator) performed in the tube bank with P/D = 1.26 can be found in Endres and Möller, 2001-a. The features of the results are similar to the results of P/D = 1.6, shown in Fig. 4, but no peaks were observed in both spectra of pressure and velocity fluctuations. The exceptions are the peaks in spectra of pressure fluctuations caused by the resonance frequencies of the tubings.
Vortex generators #2 and #3 were used in the tube banks with P/D = 1.26 and P/D = 1.60. The values of the shedding frequency and of the first harmonic, the corresponding Strouhal numbers and the Reynolds numbers of each experiment were previously measured and are listed in Table 3.
Table 3. Shedding frequencies of vortex generators #2 and #3 for all tube banks investigated. Vortex generator P/D A/S Frequencies (Hz) UG
m/s ReG StrG = fD/UG m/s UR StrR = fD/UR ReR
2 1.26 3.93 42.969 32.976 6.46E+04 0.042 6.351 0.217 1.24E+04 85.938 32.976 6.46E+04 0.084 6.351 0.434 1.24E+04 3 1.26 2.46 54.688 31.984 6.75E+04 0.055 6.065 0.289 1.28E+04 109.375 31.984 6.75E+04 0.110 6.065 0.579 1.28E+04 164.063 31.984 6.75E+04 0.165 6.065 0.868 1.28E+04 2 1.6 1.7 58.594 27.317 5.35E+04 0.069 10.222 0.184 2.00E+04 117.188 27.317 5.35E+04 0.138 10.222 0.368 2.00E+04 3 1.6 1.06 85.938 27.496 5.42E+04 0.100 9.933 0.278 1.96E+04 171.875 27.496 5.42E+04 0.201 9.933 0.555 1.96E+04
Results of spectra from the moving probe, positions 0 to 7, are shown in Figs. 9 to 12 for both geometries and vortex generator analyzed. The spectral values of Pos. 1 are divided by 10, of Pos. 2 are divided by 100 and so forth.
Figure 9 shows spectra of velocity fluctuations for P/D = 1.60 and vortex generator #2. The A/S ratio is 1.7. At Pos. 0 and 1 both the shedding frequency and its first harmonic are observed, with higher values of the latter. The peaks increase until Pos. 2, but the spectra show increasing energy until Pos. 4. After this point, the turbulence remains almost constant, and the peak is clear until Pos. 5, that means, the 4th row. It is observed, from the behavior of the spectra at Pos. 3 to 4 and 5 to 6, that the reduction of the flow area reduces the
turbulence intensity in the narrow gap, compared to the preceding wider region between the rows.
By using the smallest vortex generator (#3), A/S = 1.06, Fig. 10, the behavior of the spectra is very similar to the preceding case, but the peak of the shedding frequency is still clear, although small, at Pos. 6.
Figure 9. Autospectral density functions of velocity fluctuations measured with the moving probe inside the tube bank with P/D = 1.60, vortex generator #2, A/S = 1.7, ReG = 5.35••••104. Dashed lines indicate values of the disturbance frequency and of the first harmonic. Spectral values are successively divided by 10.
Figure 10. Autospectral density functions of velocity fluctuations measured with the moving probe inside the tube bank with P/D = 1.60, vortex generator #3, A/S = 1.06, ReG = 5.42••••104. Dashed lines indicate values of the disturbance frequency and of the first harmonic. Spectral values are successively divided by 10.
Figure 11. Autospectral density functions of velocity fluctuations measured with the moving probe inside the tube bank with P/D = 1.26, vortex generator #2, A/S = 3.93, ReG = 6.46••••104. Dashed line indicates value of the disturbance frequency. Spectral values are successively divided by 10.
Figure 12. Autospectral density functions of velocity fluctuations measured with the moving probe inside the tube bank with P/D = 1.26, vortex generator #3, A/S=2.46, ReG=6.75••••104. Spectral values are successively divided by 10.
101 102 103
10-9 10-8 10-7 10-6 10-5 10-4 10-3 10-2 10-1 100
Hz (
m/s )
2/H
z
0 1
3 2
4 5
6
7
54.7 Hz
101 102 103
10-9 10-8 10-7 10-6 10-5 10-4 10-3 10-2 10-1 100
Hz (
m/s )
2H/
z
0 1
2 3
4 5
6 7
43 Hz
101 102 103
10-9 10-8 10-7 10-6 10-5 10-4 10-3 10-2 10-1 100
Hz (
m/s )
2/H
z
0 1 2 3
4 5
6 7
85.9 Hz 171.9 Hz
101 102 103
10-9 10-8 10-7 10-6 10-5 10-4 10-3 10-2 10-1 100
Hz (
m/s )
2H/
z
0
1
2
3
4
5
6
7
Results in Fig. 11 show also that the vortex generator #2, A/S = 3.93, produces a peak in the first harmonic in spectrum measured at Pos. 0. This peak almost vanishes after Pos. 1, while the shedding frequency remains until Pos. 3 only. In Fig. 12, A/S = 2.46, spectrum taken at Pos. 0 shows the shedding frequency, the first and second harmonics (54.7, 109.4 and 164.1 Hz), but only the shedding frequency appears in spectrum measured at Pos. 1 and subsequent locations.
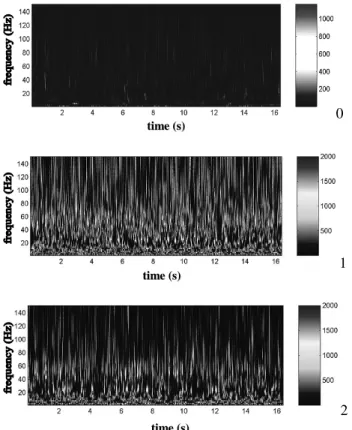
The behavior of the peaks observed in spectra can be explained by the fact that, in this longitudinal P/D range, the flow starts forming eddies after the second row, with an established regime after the third row, as observed by Ziada (2006). Therefore, because the frequency of the disturbance remains unaltered, both wavelength and amplitude of the disturbance are increased, due to the narrowing of the flow passage after the first row and the consequent acceleration of the flow. Due to vortex shedding produced by the interaction of the flow lane with the wake region, after the third row, the raise in the turbulence level causes the reduction of the peaks of the disturbance. Continuous Wavelet Transforms of the signals show that in time domain the frequency of the disturbance has an almost steady behavior, Fig. 13.
Cross-correlations between velocity fluctuations measured with the fixed and the moving probe were also calculated. The period of the cross-correlations corresponds to the observed frequencies, with predominant influence of the shedding frequency, although second mode also appears in the correlations corresponding to spectra where the first mode is present. This confirms that the wake produced by the vortex generator is transported throughout the bank, maintaining its original characteristic frequency as it passes through the successive rows.
By reducing the P/D-ratio, significant values of the correlations occur only up to Pos. 3. Due to the strong increase in the turbulence intensity observed in the spectra at positions 1 and 2, the disturbance is more rapidly dissipated as in the largest P/D-ratio studied.
Transit times and corresponding velocities are given in Table 4. Data were obtained similarly to Table 2 from cross-correlation measurements, by means of the time lag (transit time) and the distance between the probes.
Summary and Discussion
Experimental results in this paper show that a disturbance generated upstream of the investigated tube banks is amplified as it passes the first row of tubes. The disturbance in this work is a wake from a vortex generator. The frequencies of the disturbance were carefully chosen to avoid being confused with the frequencies generated in the bank, vibrations of the test section or due to acoustic resonances. Results of spectra of velocity fluctuations show the presence of peaks from the disturbance in the wake frequency until the 4th or 5th tube rows. The values of the spectra measured in the wider region between the first and the second row have higher values than the original disturbance. This raise in the amplitude of the disturbance is accompanied by the growth of the turbulence intensity. After passing the second row, turbulence levels remain with almost constant values as the flow passes through the successive rows, while the disturbance vanishes, in some cases only after the 4th or the 5th tube row.
Table 4. Transit velocities of the disturbance obtained from cross-correlations between velocity fluctuations measured with the fixed and the moving probe.
Position Distance Transit time velocity Transit % of U
R
% of UG
(mm) (ms) (m/s)
0 93 10.75 8.65 87 31
1 118.7 16.00 7.42 75 27 2 144.4 17.50 8.25 83 30 3 170.0 14.25 11.93 120 43 4 195.7 15.50 12.63 127 46 5 221.4 17.25 12.83 129 47 6 247.1 18.50 13.36 134 49 7 272.8 18.00 15.16 153 55
a) P/D = 1.60, vortex generator #3.
Position Distance Transit time velocity Transit % of U
R
% of UG
(mm) (ms) (m/s)
0 93 12.00 7.75 76 28
1 118.7 13.50 8.79 86 32
2 144.4 13.50 10.70 105 39
3 170.0 15.25 11.15 109 41
4 195.7 15.75 12.43 122 45
5 221.4 16.75 13.22 129 48
6 247.1 17.25 14.32 140 52
7 272.8 17.75 15.37 150 56
b) P/D = 1.60, vortex generator #2.
Position Distance Transit time velocity Transit % of U
R
% of UG
(mm) (ms) (m/s)
0 93 20.00 4.65 73 14
1 113.2 25.50 4.45 70 13
c) P/D = 1.26, vortex generator #2.
Position Distance Transit time velocity Transit % of U
R
% of UG
(mm) (ms) (m/s)
0 93 19.25 4.83 80 13
1 113.2 20.50 5.52 91 15
2 133.4 20.00 6.67 110 18
0
1
2
Figure 13. Continuous wavelet transform of the signals at locations 0, 1 and 2. Tube bank with P/D = 1.26, vortex generator #2, ReG = 6.46••••104 (spectra of Fig. 11).
The dissipation of the disturbance occurs later when the ratio between the vortex generator width and the gap spacing A/S is reduced. The width “A” can be considered as a scale of the disturbance. For large A/S values, the scale of the disturbance is so large compared to the gap spacing that, even after being amplified, the dissipation process starts in the early rows together with other processes like vortex stretching.
From spectra and transit time results it became evident that, although the disturbance can be observed in spectra measured in the smallest P/D-ratio investigated, the turbulence generated by the bank reduces correlation values. The consequence is that, in the smallest P/D-ratio, it was not possible to obtain transit velocities after the second row from correlation measurements.
The question that arises is: why was the disturbance not immediately annihilated by the turbulence generated by the tube bank after passing the first row?
An explanation can be found by analyzing the convective terms of the Navier-Stokes equation. By taking only the first term and rewriting it in a more convenient form
x u x u u
∂ ∂ = ∂
∂ 2
2
1 (1)
it is observed that the velocity is squared. If the Reynolds decomposition for the velocity is applied, it is evident that the raise in the mean velocity due to continuity, as the flow passes through the gap between tubes of the first row, is accompanied by the raise of the turbulence intensities. This happens because all instantaneous velocity vectors have their values increased, due to continuity, and squared, as shown in Eq. (1).
It must be also considered that three-dimensional effects, like
the other velocity components. As the flow speeds up in the contraction between tubes, vorticity is amplified because angular momentum has to be conserved (Tennekes, Lumley, 1987). Nevertheless, this three-dimensional effect cannot be captured by the experimental technique adopted, mainly due to the difficulty of introducing more complex probes in the narrow spaces between the tubes. Besides, the fact that the flow is restrained by the presence of upper and side channel walls and by the presence of the tubes may limit the amplitude of the components out of the mean stream direction.
Concluding Remarks
This paper presents the study of the propagation of disturbances with fixed frequency values, transported by the incidence velocity of the cross flow through tube banks with square arrangement and its influence on the pressure and velocity fluctuations inside the bank. Hot wire technique and a pressure transducer, mounted inside the tubes, were applied. The frequencies of the disturbances were carefully chosen so that they were clearly distinguished and separated from the frequencies generated in the bank, acoustic resonance frequencies and the natural frequencies of the test section. For reference, measurements of the influence of the disturbance in the test channel (without any obstacle) and on a single cylinder were previously performed. Since these are very well known flows, effects of the disturbance were clearly identified.
In general, experimental results presented in this paper show that an external disturbance, generated in conditions which can strongly differ from those found in the tube bank flow, will maintain its original frequency while transported through the bank. The propagation frequency is the shedding frequency or its first harmonic. The value of the predominant frequency in spectra seems to depend on the P/D-ratio and the Reynolds number, but in the cross-correlation measurements the period of the oscillation corresponded only to the shedding frequency. The ratio of the scale of the disturbance to the size of the gap spacing between the tubes of the rows seems to play an important role too. By reducing the gap spacing, the disturbance was dissipated after the second row for the largest vortex generator used (#2), while with the smallest vortex generator (#3) as well as with both vortex generators (#2 and #3) in the largest P/D-ratio studied, it subsisted until the 4th or 5th rows.
These measurements were performed in the main flow passage between the tubes. As the disturbance keeps its original frequency, while the velocity is successively increased and decreased, a change in the wave number of the disturbance may also occur, so that, its wave length is increased as the flow velocity increases in the tube bank.
The expected raise in the turbulence intensity in the first rows of the banks does not overwhelm the disturbance; on the contrary, it is accompanied by the raise in the amplitude of the disturbance.
Characteristic shedding frequencies from the tubes in the bank were not found in these measurements, probably due to the P/D-ratios studied and to the square arrangement. For these P/D-ratios, vortex shedding from the tubes in the bank appears more likely in triangular arrays (Fitzpatrick et al., 1988; Endres and Möller, 2001-a).
Spectra of velocity and pressure fluctuations in the tube banks investigated show that the observed peak frequencies are clearly not related to any frequency generated in the banks investigated. They cannot be associated to acoustic resonances, since all the observed frequencies were far below the natural frequencies of transverse acoustic modes of closed rectangular volumes with rigid walls.
The combination of the effects of the external disturbance with the increasing turbulence levels of the flow inside the bank lead, therefore, to an initial raise in the amplitudes as they influence the walls of the bank in form of pressure fluctuations. This is due to the
t
tiimmee((ss))
t
tiimmee((ss)) t
acceleration of the flow as it passes the first row of the bank until it reaches the second row. After the second row, the energy of the disturbance starts to decay as the distance from the generator increases. The effect of this process appears in the spectra of pressure fluctuations at the tube walls where the kinetic energy of the disturbance, converted to pressure energy, is transferred to the solid boundaries of the tubes. Although the investigated tube banks were only 5 rows deep, in practical heat exchangers, which have a larger number of rows, the disturbance will be dissipated in the early tube rows, persisting for the geometries investigated until the 4th or the 5th tube rows. The parameter for this process is the ratio between the width of the vortex generator and the gap spacing, A/S. As the value of A/S increases, the disturbance is dissipated at the earlier tube rows, while for the smaller A/S-ratios, it can subsist until the 4th or 5th rows.
Acknowledgements
Authors gratefully acknowledge the support by CNPq – Brazilian Scientific and Technological Council.
References
Blevins, R. D. 1990. “Flow Induced Vibration”, Van Nostrand Reinhold, New York.
Endres, L. A. M. and Möller, S. V. 1994. “Experimental study of the influence of connections between pressure taps and transducers.” (In Portuguese). Proceedings of SIBRAT - 8th Brazilian Symposium of Pressure Vessels and Piping, pp. 416-424, Gramado-RS, Brazil.
Endres, L. A. M. and Möller, S. V. 2001-a. “On the fluctuating wall pressure field in tube banks”, Nuclear Engineering and Design, Vol. 201, pp.
13-26.
Endres, L. A. M. and Möller, S. V. 2001-b. “Looking for correct dimensionless parameters for tube bank flow analysis”, Journal of Fluids and Structures, Vol. 15, pp. 737-750
Fitzpatrick, J. A., Donaldson, I. S. and McKnight, W. 1988. “Strouhal numbers for flows in deep tube array models”, Journal of Fluids and Structures, Vol. 2, pp. 145-160.
Grimison, E. D. 1937. “Correlation and utilization of new data on flow resistance and heat transfer for cross flow of gases over tube banks.”
Transactions of the American Society of Mechanical Engineers, New York:
Process Industries Division, pp. 583-594.
Grover, L. K. and Weaver, D. S. 1978. “Cross-flow induced vibrations in a tube bank - vortex shedding”, Journal of Sound and Vibration, Vol. 59, pp. 263-276.
Holmes, J. D. and Lewis, R. E. 1987. “Optimization of dynamic-pressure-measurement systems, I Single point dynamic-pressure-measurements”, Journal of Wind Engineering and Industrial Aerodynamics, Vol. 25, No. 3, pp. 249-273.
Païdoussis, M. P. 1982. “A review of flow-induced vibrations in reactors and reactor components”, Nuclear Engineering and Design, Vol. 74, pp. 31-60.
Pettigrew, M. J., Taylor, C. E., Fisher, N. J., Yetisir, M. and Smith, B. A. W., 1997, “Flow-induced vibration: recent findings and open questions”, Transactions of SMiRT 14, 14th International Conference on Structural Mechanics in Reactor Technology, pp. 19-48, Lyon.
Price, S. J. 1995. “A review of theoretical models for fluidelastic instability of cylinder arrays in cross flow”, Journal of Fluids and Structures, Vol. 7, pp. 661-687.
Rotta, J. C. 1972. “Turbulente Strömungen”. B. G. Teubner: Stuttgart. Schlichting, H., 1976, “Boundary Layer Theory”, 6th Ed., McGraw-Hill, New York.
Strasberg, M., 1963, “Measurement of Fluctuating ‘Static’ and Total-Head Pressure in a Turbulent Wake”. NATO Report - AGARD-R-464, Paris.
Tennekes, H. and Lumley, J. L., 1987. “A First Course in Turbulence”. The MIT Press, Cambridge, MA.
Townsend, A. A. 1976. “The Structure of Turbulent Shear Flow”. Cambridge U. P., Cambridge, UK.
Weaver, D. S. 1993. “Vortex shedding and acoustic resonance in heat exchanger tube arrays”, in: Technology for the 90’s, Au-Yang, M. K., Editor, Part III, Chap. 6, pp. 339-348, ASME, New York.
Weaver, D. S., Ziada, S., Au-Yang, M. K., Chen, S. S., Païdoussis, M. P. and Pettigrew, M. J. 2000. “Flow-induced vibrations in power and process plant components – progress and prospects”, Journal of Pressure Vessel Technology, Vol.122, pp. 339-348.
Wiemer, P. 1937. “Untersuchung über den Zugwiederstand von Wasserrohrkesseln”, Dissertation, RWTH - Aachen, Aachen, GER.
Willmarth, W. W. 1975. “Pressure fluctuations beneath turbulent boundary layers”. Ann. Rev. of Fluid Mech., Vol. 7: pp. 13-88.
Zdravkovich, M. M. & Stonebanks, K. L. 1988. “Intrinsically nonuniform and metastable flow in and behind tube arrays”, Proceedings of ASME International Symposium on Flow Induced Vibration and Noise, Vol. 1 pp.23-46. Chicago, USA.
Ziada, S., Oengören, A. and Bühlmann, E. T., 1989, “On acoustical resonance in tube arrays – part I: experiment”, Journal of Fluids and Structures, Vol. 3, pp. 293-314.
Ziada, S. and Oengören, A. 1992. “Vortex shedding and acoustic resonance in an in-line tube bundle – part I: vorticity shedding”, Journal of Fluids and Structures, Vol. 6, pp. 271-292.
Ziada, S. and Oengören, A. 1993. “Vortex shedding in an in-line tube bundle with large tube spacings”, Journal of Fluids and Structures, Vol. 7,
pp. 661-687.
Ziada, S., 2006. “Vorticity shedding and acoustic resonance in tube banks”, Journal of the Brazilian Society of Mechanical Sciences and Engineering, Vol. 28, No. 2, pp. 186-199.