Talanta 74 (2007) 91–103
Screening of volatile composition from Portuguese multifloral
honeys using headspace solid-phase microextraction-gas
chromatography–quadrupole mass spectrometry
M. Pontes, J.C. Marques, J.S. Cˆamara
∗Centro de Qu´ımica da Madeira, Departamento de Qu´ımica da Universidade da Madeira, Campus Universit´ario da Penteada, 9000-390 Funchal, Portugal
Received 15 March 2007; received in revised form 14 May 2007; accepted 18 May 2007 Available online 26 May 2007
Abstract
The volatile composition from four types of multifloral Portuguese (produced in Madeira Island) honeys was investigated by a suitable analytical procedure based on dynamic headspace solid-phase microextraction (HS-SPME) followed by thermal desorption gas chromatography–quadrupole mass spectrometry detection (GC–qMS). The performance of five commercially available SPME fibres: 100m polydimethylsiloxane, PDMS; 85m polyacrylate, PA; 50/30m divinylbenzene/carboxen on polydimethylsiloxane, DVB/CAR/PDMS (StableFlex); 75m car-boxen/polydimethylsiloxane, CAR/PDMS, and 65m carbowax/divinylbenzene, CW/DVB; were evaluated and compared. The highest amounts of extract, in terms of the maximum signal obtained for the total volatile composition, were obtained with a DVB/CAR/PDMS coating fibre at 60◦C
during an extraction time of 40 min with a constant stirring at 750 rpm, after saturating the sample with NaCl (30%). Using this methodology more than one hundred volatile compounds, belonging to different biosynthetic pathways were identified, including monoterpenols, C13-norisoprenoids,
sesquiterpenes, higher alcohols, ethyl esters and fatty acids. The main components of the HS-SPME samples of honey were in average ethanol, hotrienol, benzeneacetaldehyde, furfural,trans-linalool oxide and 1,3-dihydroxy-2-propanone.
© 2007 Elsevier B.V. All rights reserved.
Keywords: Honey; Volatile compounds; Solid-phase microextraction; GC–qMS
1. Introduction
Honey is a natural product produced byApis melliferabees from the nectar of plants and has for long been an excellent nutritional option for many generations due to its health benefits (one of the traditional sources for treatment of flue and com-mon cold in the region)[1], has been reported to be effective in gastrointestinal disorders, in healing of wounds and burns, as an anti-microbial agent[2]. The healing effect of honey is due to the enzyme glucose oxidase, this enzyme is virtually inactive in full-density honey but becomes active in diluted honey pro-ducing hydrogen peroxide and gluconic acid from glucose. In addition, many natural antibacterial compounds have been iden-tified from different types of honey[2]. Honey, as a source of antioxidants has been proven to be effective against deterioative
∗Corresponding author. Tel.: +351 291705112; fax: +351 291705149.
E-mail address:[email protected](J.S. Cˆamara).
oxidation reaction in food[3]. The antibacterial activity of honey is attributed both to physical factors, acidity and osmolarity and chemical factors, hydrogen peroxide, volatiles, beeswax, nectar, pollen and propolis[2,3].
Honey includes over 400 different chemical compounds, more than 95% mainly formed by sugars and water, whereas pro-teins, vitamins (mainly vitamin B6, thiamin, niacin, riboflavin, and pantothenic acid), essential minerals (including calcium, copper, iron, magnesium, manganese, phosphorus, potassium, sodium, and zinc), pigments, flavours, free amino acids and volatile compounds constitute minor components[4]. The sug-ars present in honey are mainly fructose (about 38.5%) and glucose (about 31.0%). The remaining carbohydrates include maltose, sucrose, and other complex carbohydrates.
The chemical composition of honey is highly dependent to the nectar source and the botanical origin of the nectar for-aged by bees [1]. Aroma compounds are present in honey at very low concentrations as complex mixtures of volatile com-ponents of different chemical families belonging, in general, to
monoterpenes, C13-norisoprenoids, sesquiterpenoids, benzene derivatives [5] and in lowest content, higher alcohols, esters, fatty acids, ketones, terpenes and aldehydes. Some of these substances are present in honey collected by bees, and have been described as characteristics of the floral source (could be related to plant characteristics), and other compounds, like some alcohols, branched aldehydes, and furfural derivatives, may be related to the microbial purity of processing and storage conditions of honey [6]. The quantitative analysis of volatile compounds present in such samples is extremely demanding due: (1) to complex chemical composition of the volatile frac-tion and (2) the fact of individual volatile compounds can be present in a wide range of concentration. Honey volatile frac-tions have been used as quality markers for the authenticity of the floral origin[7,8]. It also prevents overpayment and helps to identify frauds[7].
Traditional analytical methods employing organic sol-vents such as liquid–liquid extraction [9], simultaneous distillation–extraction (SDE)[10], supercritical fluid extraction (SFE) [11], solid-phase extraction (SPE) [12] and ultrasound extraction [13] were commonly used. These are hazardous since requires large amounts of toxic and expensive solvents, are labour-intensive and time-consuming and requires the pre-concentration of the extract. Each procedure of the sample preparation is subject to inconveniences, but offers specific advantages under determined circumstances. Nowadays, alter-native to these classical methods that may overcome their disadvantages, more easier and selective, are used such as solid-phase microextraction (SPME), developed by Pawliszyn and coworker[14,15]in the early 1990s and more recently stir bar sorptive extraction (SBSE) developed in the late 1990s by Bal-tussen et al. [16]. This technique uses a TwisterTM, a glass stir bar onto which is bonded a sorptive phase, often poly-dimethylsiloxane (PDMS), in quantities far in excess of those found on SPME fibres [17]. SPME is an equilibrium tech-nique that requires a previous optimisation of the extraction parameters that can affect extraction efficiencies, in order to obtain high recoveries of volatiles. SPME sampling can be per-formed in three basic modes: direct extraction (the analytes were transported directly from matrix to the extracting phase), headspace extraction (the analytes are extracted from the gas phase equilibrated with the sample) and extraction with mem-brane protection (the fibre is separated from the sample with a selective membrane). The selection of the sampling mode is dependent of the nature of the compounds to be analysed and the sample type. Bearing in mind that one of the goals of this study was to screen volatile compounds from hon-eys, the headspace sampling mode was the most appropriate. The headspace SPME process protects the fibre from adverse effects caused by non-volatile compounds present in the sam-ple matrix namely sugars, and allows modifications, as for example: pH, with no effect in the fibre. Moreover, the equi-libration times for volatile compounds are shorter for headspace SPME extraction than for direct extraction under the same con-ditions.
Since the first SPME fibres becomes commercially avail-able, it has been more and more used and the fields of
application have been continuously growing, including a wide range of food analysis, namely the volatile composition of wines [18–22], beers [23], whiskeys [24–26], several kinds of fruits [27–31] and honeys [32–36], with nowadays about 3000 research papers published. The technique gained grow-ing acceptance and increasgrow-ing use in routine laboratories and industrial applications. This method shows clear advantages compared with traditional techniques, eliminates the use of (toxic) organic solvents, allows the quantification of a large number of molecules, no or little manipulation/preparation of samples, substantially shortness the time of analysis and moreover are simple and faster techniques, and covers a wide range of sampling techniques, including field, in situand air sampling. Generally accepted disadvantages are relatively lot-to-lot variations, sensitivity against organic solvents and the limited range of stationary phases which are commercially available.
In this study, headspace SPME combined with GC–qMS, was developed and applied to evaluating the volatile composi-tion profile of different multifloral honey samples (H1–H4). A preliminary screening of fibre of various polarities was carried out in order to select the best coating for the matrix. Comparison between the performance of the five sorbent materials is given. To confirm the applicability of the SPME, comparative study on the characteristic GC–qMS volatile honey profiles were per-formed. The possibility of differentiation from the investigated honeys was evaluated.
2. Experimental
2.1. Chemicals and materials
All reagents used were analytical quality and all solvents were HPLC grade. Sodium chloride (99.5%) used to obtain the adequate ionic strength (decrease the solubility of the aroma molecules which then partition more readily into the headspace improving the adsorption of analytes in SPME analysis), was supplied by Merck (Darmstadt, Germany). Water was puri-fied through a Milli-Q purification system (Millipore). The C8–C20 n-alkanes series, and the chemical standard used as internal standard, 3-octanol, were supplied by Sigma–Aldrich (Spain).
2.2. Honey samples
This study was carried out on 16 multifloral honeys, H1–H4 (four samples from each honey) from four different regions of Madeira Island (Portugal) where predominates the wild flora, eucalyptus, hissed and rosemary. All samples were obtained from local stores and were processed using the traditional pro-cedures. None of these samples underwent any treatment that could alter their composition.
All samples were contained in glass bottles and stored at 4◦C until analysis. All analysis, were carried out four times.
2.3. SPME methodology
In order to select the best fibre for honey volatile composition, five SPME coatings of different polarity and extraction mecha-nisms were tested. The methodology developed and optimised by Cˆamara et al.[37]for the volatile compounds extraction using manual SPME was used in this study with minor modifications. The H1 honey sample was selected as the matrix for compar-ison of the performance of the fibres. The fibre that presented the most complete profile of H1 honey volatile compounds was chosen for the study. The extraction was carried out at 60◦C (controlled temperature) and each measurement was repeated four times.
For each extraction 15 g of sample was diluted 1:1 with deionised water (Milli-Q). The dilution decrease the density of the matrix making easy the evaporation of analytes of the interest otherwise retained for sugars. For headspace sampling, 30 mL of the sample was immediately placed in a 60 mL ambar glass vial (volume ratio headspace/solution was 1:1) hermetically sealed and spiked with 3-octanol (250L at 422 mg L−1) and 4-methyl-2-pentanol (125L at 422 mg L−1) (Sigma–Aldrich) used as internal standards, and equilibrated during 40 min in a thermo-static bath on a stirrer. The extractions were carried out without adjust of pH. The ionic strength was increased using NaCl (30%, w/v) to improve the extraction efficiency by decreasing the sol-ubility of hydrophilic compounds in the aqueous phase. The SPME fibre was then exposed to the headspace of the sample and kept for 40 min at 60◦C. As stirring usually improves the extraction, because the static layer resistant to mass transfer is destroyed (facilitate mass transport between the bulk of the aque-ous sample and the fibre), all the experiments were performed under constant stirring velocity (750 rpm).
After sampling, the SPME fibre was withdrawn into the nee-dle, removed from the vial and inserted into the hot injector port (260◦C) of the GC–qMS system for 6 min where the extracted analytes were thermally desorbed and transferred directly to the analytical column.
2.4. Gas chromatography–quadrupole mass spectrometry detection (GC–qMS)
The volatile compounds extracted by dynamic headspace SPME procedure from honey, were tentatively identified using an Agilent 6890N (Palo Alto, CA, USA) gas chromatograph sys-tem coupled to an Agilent 5975 quadrupole inert mass selective
detector equipped with a 30 m×0.25 mm i.d., with a 0.25m film thickness, BP-20 fused silica capillary column, according to the method described by Cˆamara et al.[37]. Helium (Helium N60, Air Liquid, Portugal) was used as the carrier gas at a flow rate≈1 mL min−1(column-head pressure: 13 psi). An insert of 0.75 mm i.d. was used and the injector temperature was fixed at 260◦C. Splitless injections were used. The temperature used included the following settings: initial temperature of 50◦C was held for 1 min and then increased in three steps: 50–100◦C, at 2.5◦C min−1; 100–180◦C, at 2◦C min−1 and 180–220◦C, at 15◦C min−1. Each step was preceded by a small period at constant temperature for 2, 1 and 10 min, respectively. The mani-fold, GC–qMS interface and quadrupole temperatures were held at 180, 220 and 180◦C, respectively. The detection was per-formed by a 5975 mass spectrometer in the electronic impact (EI) mode (ionization energy, 70 eV; source temperature, 180◦C). The electron multiplier was set to the auto tune procedure. The mass acquisition range, made in full scan mode, was 30–300m/z; 1.9 spectra/s.
Compounds were identified by comparing the MS fragmenta-tion pattern with those of the pure standards and mass spectrum of the unknown peaks with those stored in the NIST GC/MS library, retention time of the pure standards obtained under the same conditions, and Kov´ats retention indices (RI). For the determination of the RI a C8–C20 n-alkanes series was used. The relative amounts of individual components are expressed as percent peak areas (RPA, %) relative to the total peak area.
2.5. Statistical analysis
Significant differences among the honey samples were deter-mined by one-way analysis of variance (ANOVA) using a SPSS Program, Version 14.0 (SPSS Inc., 2006). Principal compo-nent analysis (PCA) and stepwise linear discriminant analysis (SLDA) were performed using the same SPSS program. These techniques were applied to the normalized total peak areas from different chemical classes.
3. Results and discussion
Sixteen honey samples from different multifloral origins were analysed with the objective to identify and compare their volatile compounds profiles. Differences in the total ion current (TIC) chromatographic profiles were observed when comparing the studied honeys. TIC chromatograms from H1–H4 samples were compared in terms of total areas of the volatile compounds and number of compounds. The identified compounds were organized in different groups according to their chemical structure. This was done for C13 -norisoprenoids/monoterpenes, sesquiterpenoids, higher alco-hols, fatty acids, ethyl esters, furanic compounds, carbonyl com-pounds, aliphatic and aromatic hydrocarbons, while compounds of different structures were considered together as the class “miscellaneous”.
-norisoprenoids/monoterpenes, constitute a main part of flavour studied honeys, and they probably play a significant role in their flowery notes. These founds are in good agreement with previ-ous reports[34,35]. As predominant compoundstrans-linalool oxide, furfural, hotrienol and in minor extent, 1,3-dihydroxy-2-propanone, 5-hydroxymethylfurfural, benzeneacetaldehyde, ethyl decanoate, ethyl dodecanoate, o-methoxyacetophenone and 2-ethyl hexanoic acid were found. The two fatty acid ethyl esters may contribute with sweety and fruity notes while ben-zeneacetaldehyde may contribute with flowery, rose and honey notes.
Furanic compounds such as furfural, 1-(2-furanyl)-ethanone and 5-hydroxymethylfurfural were presented in all samples. Several aliphatic and aromatic hydrocarbons arise from bee wax which has not been completely separated during harvest and processing, were identified.
3.1. Selection of SPME fibre coating
The fibre coating used influences the chemical nature of the extracted analyte that is established by their characteris-tic polarity and volatility. To evaluate the extraction yields of the honey volatile components by HS-SPME, and taking account of the physico/chemical characteristics of the targets under consideration, we tested five types of fibre (CAR/DVB, CW/PDMS, PDMS, PA, and DVB/CAR/PDMS) among those used most routinely for assaying volatiles. A few key experi-mental factors which influence the HS-SPME extraction yield, namely time required for the target analytes to reach equilib-rium and extraction temperature, were previously evaluated by Cˆamara et al.[37], and applied in this work. Bearing in mind the obtained results, each fibre was exposed to the headspace at the same temperature (60◦C) during the same extraction time (40 min). For reasons of comparability all tests were car-ried out with the same honey sample (H1). The comparison of the SPME fibre performance was made in terms of extrac-tion efficiency, number of identifiable compounds in the extract and reproducibility. The chromatographic profiles presented in
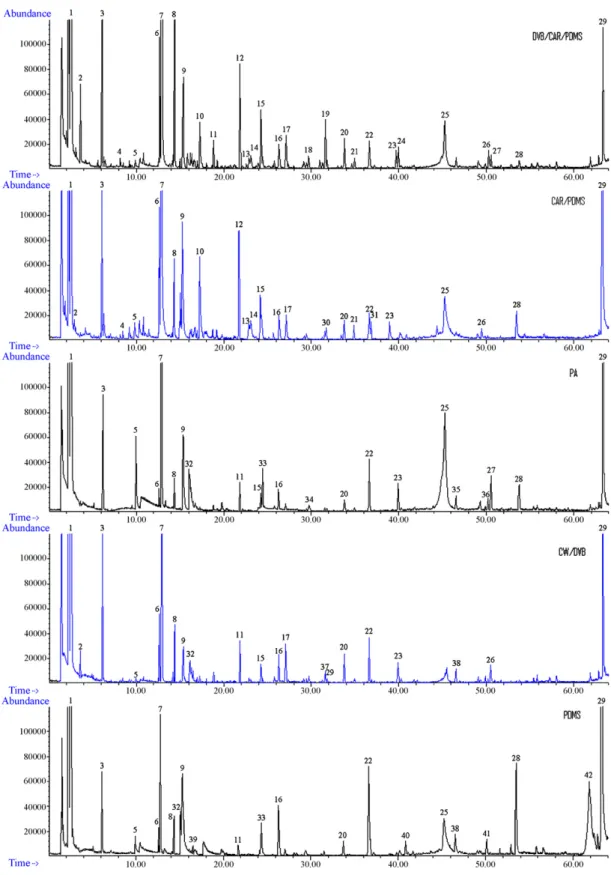
Fig. 1, obtained for a H1 honey sample by using different coatings in same experimental conditions, shows the different extraction efficiency of the fibres. The results obtained using the five fibres on the same H1 sample, in rigorously repro-duced temperature and exposure time conditions, are reported in Table 1 . The qualitative composition of honey volatiles and the number of identified compounds using the five fibres under study is very different. As can be seen in Table 1
with DVB/CAR/PDMS fibre a total of 46 compounds were identified whilst with the PA, CW/DVB, CAR/PDMS and PDMS coatings, were detected only, 32, 30, 35 and 17 com-pounds, respectively. The semi-polar DVB/CAR/PDMS fibre allowed the best efficiency of extraction for volatile com-pounds while under the same conditions PDMS fibre had the lowest sorption capacity. The former fibre provided the best sensitivity in terms of total compound peak areas, high-est number of detected compounds and high reproducibility, hence this fibre was chosen for evaluation of volatile com-pounds in honeys (Table 2 ). PA fibre coating extracted
71.8% of DVB/CAR/PDMS while PDMS coating extracted the lowest amount (about 32.0% of DVB/CAR/PDMS). Sim-ilar amounts of volatiles (57.4–60.2% of DVB/CAR/PDMS) were extracted when using either, CW/DVB or CAR/PDMS coatings (Table 2). From Fig. 2, it can be observed that the fibres show different selectivity to different target compounds.
Higher alcohols (HA) have a larger affinity for PA fibre. This coating also present better sensitivity for furanic com-pounds (FC), carbonyl comcom-pounds (CaC) and miscellaneous. DVB/CAR/PDMS coating showed a strong extraction capacity for aliphatic and aromatic hydrocarbons (HSHAr), C13 -norisoprenoids/monoterpenes (NT), sesquiterpenoids (S) and ethyl esters (EEs).
Some characteristic honey compounds were isolated by the five fibres, such as toluene, trans-linalool oxide, fur-fural, linalool, hotrienol, benzeneacetaldehyde, 1,3-dihydroxy-2-propanone, 2,3-dihydro-3,5-dihydroxy-6-methyl-4H -pyran-4one (DDMP) and 5-hydroxymethylfurfural.
3.2. Volatile compounds in honey samples
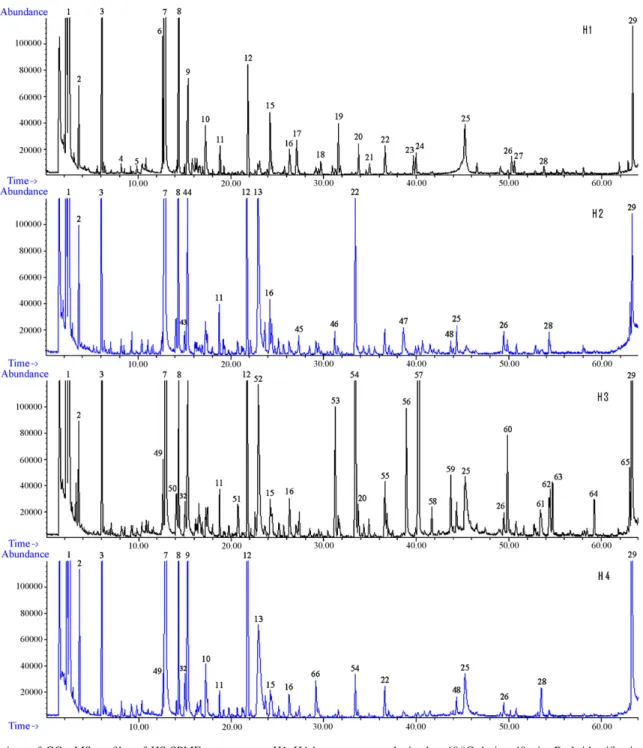
The proposed HS-SPME method, previously optimised and validated, was applied to determine the content of volatile pat-terns in four commercial available Portuguese honeys. Each honey was analysed four times using the best sampling con-ditions described above. A characteristic GC–qMS profile of each honey obtained with DVB/CAR/PDMS using the exper-imental conditions discussed above is shown inFig. 3. More than 100 volatile compounds belonging to several chemi-cal classes were positively identified, including monoterpenes, C13-norisoprenoids, sesquiterpenoids, higher alcohols, fatty acids ethyl esters, fatty acids, furanic compounds, carbonyl compounds and aliphatic/aromatic hydrocarbons. Most of the volatile compounds were identified by a library search NIST. In some cases a comparison with authentic compounds was per-formed. The Kov´ats retention indices were calculated for each peak and compared with the literature in order to ensure the correct identification of the compounds.Table 3summarises the average (n= 4) relative composition determined in the mutiflo-ral studied honeys. The relative composition of every flavour compound was calculated as the percent ratio of the respective peak area relative to the total peak area (RPA, %) and rela-tive to the compound with highest peak area in each honey (RPC, %).
A total of 110 volatile compounds were identified in investigated honey samples. Fifteen of these volatiles: ethanol, toluene, 1-methyl-2-(1-methylethyl)-benzene, trans -linalool oxide, acetic acid, furfural, 1-(2-furanyl)-ethanone, linalool, hotrienol, benzeneacetaldehyde, 1-nonanol, 1,3-dihydroxy-2-propanone, nonanoic acid, DDMP and 5-hydroxymethylfurfural, were detected in all samples (Table 3) but the ratio between the single components were different for each honey. Some of these 15 compounds ethanol, toluene,
Fig. 1. Chromatograms obtained by SPME analysis of H1 honey with different fibres using in the headspace sampling mode with 30% NaCl and at 60◦C during 40 min. Peak identification: (1) ethanol; (2) toluene; (3) 4-methyl-2-pentanol (IS); (4) 1,3-butanediol; (5) 1-hydroxy-2-propanone; (6) nonanal; (7) 3-octanol (IS); (8)trans-linalool oxide; (9) furfural; (10) benzaldehyde; (11) linalool; (12) hotrienol; (13) benzeneacetaldehyde; (14) acetophenone; (15) 1-nonanol; (16) eicosane; (17) naphthalene; (18) 3-ethyl-2-pentene; (19) 2-methyl-2-phenylethyl ester propanoic acid; (20)E-6,10-dimethyl-5,9-undecadien-2-one; (21) ␣-2-propenyl-benzenemethanol; (22) heptadecane; (23) 2-ethyl-hexanoic acid; (24) 1-ethyl-2-hepthyl-cyclopropane; (25) 1,3-dihydroxy-2-propanone; (26) nonanoic acid; (27)
Table 1
Volatile compounds identified in H1 honey after dynamic headspace solid-phase microextraction using different coatings (extraction temperature: 60◦C; extraction time: 40 min)
RT (min) KIa Compound Identityb SPME coating
PA CW/DVB CAR/PDMS PDMS DVB/CAR/PDMS
2.575 929 Ethanol A, B x x x x x
3.614 1023 Toluene A, B x x
4.186 1064 Hexanal A, B x
6.295 1178 Heptanal A, B x x
8.259 1254 1,3-Butanediol A x
8.481 1261 1-Methyl-3-(1-methylethyl)-benzene A, B x x x
9.233 1285 2,4,6,8-Tetramethyl-1-undecane B x x
9.942 1307 1-Hydroxy-2-propane B x x x x
10.864 1337 Linalool B x x
12.668 1389 Nonanal A, B x x x x
12.796 1392 (E)-2-Nonen-1-ol A, B x x
14.130 1432 Heptanoic acid ethyl ester B x x x
14.274 1436 1,4-Diclorobenzene A, B x x x x
14.401 1439 Trans-linalool oxide B x x x x x
15.025 1457 Acetic acid B x x x
15.368 1466 Cis-linalool oxide B x
15.368 1466 Furfural A, B x x x x
15.767 1477 ␣-Cubebeno A, B x
16.149 1486 Methyl ester nonanoic acid A, B x x
16.578 1497 Hexadecane B x x
16.764 1502 1-(2-Furanyl)-ethanone A, B x x x
17.009 1508 TBHc B x x
17.009 1508 (E,E,E)-2,4,6-Octatriene A, B x x
17.300 1515 Benzaldehyde A, B x x x
18.849 1549 (S)-Linalool B x x
18.849 1549 5-Methyl-1,3,6-heptatriene A, B x x
19.248 1558 3-Methyl-1,5-pentenediol B x
19.248 1558 1-Hexene A, B x x
19.801 1569 5-Methylfurfural B x
20.052 1574 -Elemene B x
21.343 1600 ␣-4-Dimethyl-3-cyclohexene-1-acetaldehyde B x
21.840 1611 Hotrienol B x x x x x
22.144 1617 Dihydro-cis-␣-copaene-8-ol B x
22.589 1626 Pulegone B x
22.893 1633 Phenylacetaldehyde B x x x x
23.122 1637 Acetophenone B x x x x
23.475 1644 3-Carene A, B x
23.981 1654 1-Nonanol A, B x x x x
24.252 1660 2-Furanmethanol A, B x x x x x
25.472 1683 d-Germacrene B x
26.312 1698 Heptadecane B x x x x x
27.090 1714 Naphthalene A, B x x x x
28.038 1733 -Cubebene A, B x
29.198 1756 Methyl ester 2-hidroxy-benzoic acid A,B x
29.368 1759 Cis-␣-bisabolene A, B x
29.368 1759 ␣-Ocimene B x
29.734 1766 (Z)-Heptene A, B x
31.591 1801 DPEPAd B x
31.591 1801 -Damascenone A, B x
31.591 1801 TMCHBe B x x
31.819 1805 ␣-Methyl-benzenemethanol A, B x x x x
33.474 1839 Ethyl ester dodecanoic acid B x x
33.774 1845 (E)-6,10-Dimethyl-5,9-undecadien-2-one B x x x x x
35.010 1869 ␣-2-Propenyl-benzenemethanol B x x x
36.628 1898 Nonadecane B x x x x x
36.918 1904 ␣-Ionol A, B x
36.918 1904 DDMMPf A, B x
40.004 1967 2-Ethyl-hexanoic acid A, B x
42.142 2008 2-Methyl-pentanal B x
45.000 2068 1,3-Dihydroxy-2-propanone A, B x x x x
Table 1 (Continued )
RT (min) KIa Compound Identityb SPME coating
PA CW/DVB CAR/PDMS PDMS DVB/CAR/PDMS
49.500 2162 Nonanoic acid B x x x x
53.494 2225 DDMPg A, B x x x x
55.814 2251 2,3,4-Trimethyl-hexane A, B x x
58.057 2275 2-Acetylbenzoic acid B x
61.825 2345 4-Hydroxy-benzenmethanol B x
63.381 2395 5-Hydroxymethylfurfural B x x x x
64.113 2418 2,6-Dimethoxy-4-(2-propenyl)-phenol B x
65.352 2457 Dihydro-4-hydroxy-2(3H)-furanone A, B x
Total compounds identified by fibre
32 30 35 17 50
aExperimentally determined Kov`ats indices on the BP-20 column, relative to C
8–C20hydrocarbons.
b (A) Components identified on the basis of the retention time and EI mass spectra of pure standard; (B) components identified on the basis of their EI mass spectra only.
c1,7,7-Trimethyl-bicyclo[2.2.1]hepten-2-ene. d 2,2-Dimethyl-2-phenylethyl ester propanoic acid. e1-(2,6,6-Trimethyl-1,3-cyclohexadien-1-yl)-2-buten-1-one. f4,6-Di(1,1-dimethylethyl)-2-methylphenol.
g 2,3-Dihydro-3,5-dihydroxy-6-methyl-4H-pyran-4one.
Each type of honey showed a typical composition. H1 honey (Fig. 3) is characterized by a high amount of ethanol, furfural, nonanal, 1,3-dihydroxy-2-propanone,
trans-linalool oxide, benzaldehyde, hotrienol, and nonanol.
Some identified compounds are specific of this sample. Therefore, heptanal, ethyl heptanoate, ␣- and -cububene, (Z)-heptene, ␣-propenyl-2-benzenemethanol, pulegone, ace-tophenone, 3-carene,d-germacrene and 2,3,4-trimethylhexane,
were identified only in this honey sample. This sample is also characterized by the lowest level of 5-hydroxymethyl-furfural.
H2 (Fig. 3) is characterized by a high amount of hotrienol. This compound was identified in each honey analysed but at lower levels. Also 5-hydroxymethylfurfural, benzeneac-etaldehyde, furfural and trans-linalool oxide, are present in significantly high amounts, when compared with the H1,
H3 and H4 honey samples. 1,3,8-p-menthatriene, 1-ethyl-2-methylcyclopropane, cycloheptane, and -phenylethanol, are present only in H2 honey type.
In H3 honey were identified 60 volatile compounds. As shows Fig. 3, the most intense peaks correspond to
o-methoxyacetophenone, benzeneacetaldehyde, hotrienol, fur-fural, ethyl dodecanoate and 2-ethyl hexanoic acid.o -methoxy-acetophenone and 2-ethyl hexanoic acid can be used to dif-ferentiate these honey type from H1, H2 and H4 samples, since were detected, at high levels, only in this sample. 5-Hydroxymethylfurfural, 1,3-dihydroxy-2-propanone, trans -linalool oxide, furfural, hotrienol and benzeneacetaldehyde, are the dominating components found in the H4 sample. Forty-eight compounds were positively identified in this honey with the experimental conditions used. 3-Methyl-1-butanol, (E )-2-hexen-1-ol, 3-methyl-1-pentanol, 5-acetoxymethylfurfural and
Table 2
Sorption capacity of different fibres for extraction of H1 honey volatile compounds during dynamic HS-SPME extraction, expressed as peak area (40 min at 60◦C with salt saturation)
Class of compounds SPME fibre
PA CW/DVB DVB/CAR/PMS PDMS CAR/PDMS
Higher alcohols 1.10×10⁸ 1.12
×108 8.07×10⁷ 5.34×10⁷ 1.00×10⁸
Fatty acids 7.78×10⁶ 3.53
×106 1.23×10⁶ 8.04×10⁵ 5.71×10⁵
Ethyl esters – – 2.85×10⁶ – 6.70
×105
NTa 2.16
×106 6.08×10⁶ 8.95×10⁶ 1.99×10⁶ 8.34×10⁶
Sesquiterpenoids – 5.21×10⁵ 1.63
×106 – –
Furanic compounds 1.04×10⁸ 1.43
×107 7.16×10⁶ 1.33×10⁷ 3.60×10⁷
Carbonyl compounds 4.71×10⁷ 3.05
×106 1.19×10⁷ 5.75×10⁵ 1.91×10⁷
HSHArb 2.98
×106 7.57×10⁶ 1.38×10⁷ 5.06×10⁶ 5.67×10⁶
Miscellaneous 1.95×10⁶ – 5.64
×105 – 3.10×10⁵
Sum 2.04×10⁸ 1.63
×108 2.84×10⁸ 9.09×10⁷ 1.71×10⁸
% R.S.D. (n= 4) on sum 4.66 4.89 2.81 1.67 11.63
aC
Table 3
Volatile compounds identified in different types of Portuguese honeys after dynamic headspace solid-phase microextraction using DVB/CAR/PDMS coating (extraction temperature: 60◦C; extraction time: 40 min)
RT (min) KIa Compound RPA (%) RPC (%)
H1 H2 H3 H4 H1 H2 H3 H4
2.575 929 Ethanol 56.16 41.86 44.27 29.30 51 69 100 98
3.228 992 Tricloromethane – – 1.25 – – – 100 –
3.614 1023 Toluene 3.99 2.95 2.32 1.61 48 72 80 100
5.941 1162 2,6-Dimethyl-4-heptanone – – – 0.09 – – – 100
6.295 1178 Heptanal 0.60 – – – 100 – – –
7.105 1212 3-Methyl-1-butanol – – – 0.16 – – – 100
8.187 1252 3-Octanone – 0.35 – 0.10 – 100 – 80
8.252 1254 Styrene – – 0.16 – – – 100 –
8.259 1254 1,3-Butanediol 0.25 – – – 100 – – –
8.481 1261 1-Methyl-2-(1-methylethyl)-benzene 0.19 0.14 0.13 0.12 35 41 58 100
9.377 1289 1-Methoxy-2-methyl-propane – – – 0.26 – – – 100
9.942 1307 1-Hydroxy-2-propane 0.95 0.54 – 0.22 100 55 – 96
10.387 1322 2-Heptanol – – – 0.14 – – – 100
12.524 1385 Methyl ester octanoic acid – – 0.49 0.15 – – 100 57
12.668 1389 Nonanal 6.94 – – – 100 – – –
12.629 1388 (E)-2-Hexen-1-ol – – – 0.36 – – – 100
12.796 1392 (E)-2-Nonen-1-ol 0.93 1.25 1.55 – 17 53 100 –
14.100 1431 1-Methyl-4-(1-methylethenyl)-benzene – 0.67 1.05 0.36 – 43 100 64
14.13 1432 Heptanoic acid ethyl ester 0.20 – – – 100 – – –
14.267 1436 1,4-Dichloro-benzene 1.05 – – – 100 – – –
14.401 1439 Trans-linalool oxide 4.99 7.83 4.92 3.90 30 73 69 100
14.469 1441 1,3,8-p-Menthatriene – 0.39 – – – 100 – –
15.025 1457 Acetic acid 1.12 2.11 0.90 0.78 35 99 66 100
15.368 1466 Furfural 8.09 11.31 6.10 3.62 32 100 82 88
15.767 1477 ␣-Cubebene 1.67 – – – 100 – – –
16.13 1486 Methyl ester nonanoic acid – – 0.55 0.13 – – 100 43
16.241 1489 2-Ethyl-1-hexanol – – 0.29 – – – 100 –
16.358 1492 Decanal – 0.86 0.31 0.14 – 100 53 45
16.535 1496 Benzofuran – – 0.85 – – – 100 –
16.578 1497 Hexadecane 0.34 – – 0.19 29 – – 100
16.764 1502 1-(2-Furanyl)-ethanone 0.20 0.92 0.60 0.27 14 100 98 80
16.917 1505 1-(1,4-Dimethyl-3-cyclohexen-1-yl)-ethanone – – 0.41 0.18 – – 100 79
17.009 1508 1,7,7-Trimethyl-bicyclo[2.2.1]hepten-2-ene 0.35 – – – 100 – – –
17.3 1515 Benzaldehyde 4.60 2.80 0.80 – 73 100 44 –
17.47 1518 2-Nonanol – – 0.76 – – – 100 –
18.009 1531 Ethyl ester octanoic acid – – 0.34 – – – 100 –
18.849 1549 (S)-Linalool 1.46 0.78 1.16 0.56 51 44 100 88
19.189 1557 Cis-1-ethyl-2-methyl-cyclopropane – 0.37 – – – 100 – –
19.192 1557 (S)-(+)-3-Methyl-1-pentanol – – – 0.17 – – – 100
19.801 1569 5-Methylfurfural 0.32 0.5 0.32 – 28 99 100 –
20.774 1589 2-Methyl benzofuran – – 0.86 – – – 100 –
21.343 1600 ␣-4-Dimethyl-3-cyclohexene-1-acetaldehyde 0.10 0.84 – 0.17 21 100 – 55
21.840 1611 Hotrienol 3.79 30.33 7.20 4.98 8 100 36 45
22.144 1617 Dihydro-cis-␣-copaene-8-ol 0.02 – – – 100 – – –
22.562 1626 1-Ethenyl-4-methoxybenzene – – 0.72 – – – 100 –
22.589 1626 Pulegone 0.14 – – – 100 – – –
22.893 1633 Phenylacetaldehyde 0.50 12.44 7.92 3.69 2 100 89 82
23.122 1637 Acetophenone 1.24 – – – 100 – – –
23.475 1644 3-Carene 0.29 – – – 100 – – –
23.661 1648 2-Hydroxy-3,5,5-trimethyl-cyclohex-2-enone – 0.87 – 0.50 – 68 – 100
24.252 1660 1-Nonanol 4.04 1.18 1.00 0.66 100 60 83 99
24.436 1663 2-Furanmethanol 1.52 1.51 – 1.32 27 36 – 100
25.105 1676 2,6,6-Trimethyl-2-cyclohexene-1,4-dione – 0.38 0.55 0.27 – 60 100 89
25.472 1683 d-Germacrene 0.60 – – – 100 – – –
25.681 1687 1-Methyl-4-(1-methylethylidene)-cyclohexene – – 0.20 – – – 100 –
25.703 1687 2,6-Dimethyl-5,7-octadien-2-ol – 0.14 – 0.11 – 10 100 16
26.272 1697 Eicosane – 1.22 1.26 – – 100 95 –
26.312 1698 Heptadecane 2.40 – – 0.64 84 – – 100
27.011 1712 8-Heptadecane – – 0.29 – – – 100 –
27.090 1714 Naphthalene 4.45 – 0.14 – 100 – 11 –
Table 3 (Continued )
RT (min) KIa Compound RPA (%) RPC (%)
H1 H2 H3 H4 H1 H2 H3 H4
27.328 1719 2-Tetradecanol – 0.26 – – – 100 – –
27.357 1720 1,2-Dihydro-3,6,8-trimethyl-naphthalene – 0.46 – – – 100 – –
28.038 1733 -Cubebene 0.35 – – – 100 – – –
29.172 1756 2-Hydroxy methyl ester benzoic acid – 2.02 – 0.36 – 100 – 48
29.198 1756 Methyl ester 2-hidroxy-benzoic acid 0.52 – – – 100 – – –
29.368 1759 Cis-␣-bisabolene 0.25 – – – 100 – – –
29.446 1761 Cycloheptane – 0.56 – – – 100 – –
29.453 1761 2-Methyl-cyclopentanone – – – 0.33 – – – 100
29.734 1766 (Z)-Heptene 0.96 – – – 100 – – –
30.400 1779 4-Hydroxy-acetophenone – – 0.25 – – – 100 –
31.182 1793 Methyl ester dodecanoic acid – – 0.81 – – – 100 –
31.587 1800 2-Phenylethyl ester propanoic acid – – 0.33 0.30 – – 61 100
31.591 1801 2,2-Dimethyl-2-phenylethyl ester propanoic acid 4.99 – – – 100 – – –
31.819 1805 (S)-␣-Methyl-benzenemethanol 0.57 – 0.42 – 55 – 100 –
33.395 1837 Ethyl ester dodecanoic acid – 1.38 6.80 – – 15 100 –
33.424 1838 Ethyl ester decanoic acid – – – 0.22 – – – 100
33.594 1841 ␣-4-Trimethyl-benzenemethanol – – – 0.11 – – – 100
33.774 1845 (E)-6,10-Dimethyl-5,9-undecadien-2-one 2.15 – 0.96 – 91 – 100 –
34.336 1856 3-Methylbuthyl ester pentadecanoic acid – – 0.24 – – – 100 –
34.901 1866 Phenol – – 0.64 – – – 100 –
35.010 1869 ␣-2-Propenyl-benzenmethanol 0.78 – – – 100 – – –
36.565 1897 -Phenylethanol – 1.84 – – – 100 – –
36.628 1898 Nonadecane 2.53 – 1.90 0.89 54 – 100 85
36.830 1902 ␣-Ionol – – 0.56 – – – 100 –
36.918 1904 4,6-Di-(1,1-dimethylethyl)-2-methyl phenol 1.80 – – – 100 – – –
37.052 1907 Benzyl nitrile – – 0.26 0.16 – – 91 100
38.602 1939 2,3,4,5-Tetramethyl-1,4-hexadiene – – – 0.97 – – – 100
38.951 1946 2-Ethyl hexanoic acid – – 6.08 – – – 100 –
40.203 1971 o-Methoxyacetophenone – – 19.25 – – – 100 –
40.664 1979 MFPOEb – – – 0.29 – – – 100
40.906 1984 Furyl hydroxymethyl ketone – – – 0.41 – – – 100
41.71 1999 Methyl tetradecanoate – – 0.48 – – – 100 –
43.727 2042 Ethyl ester tetradecanoic acid – – 0.55 – – – 100 –
44.358 2055 Octanoic acid – 0.81 1.61 0.68 – 46 100 78
45.355 2075 1,3-Dihydroxy-2-propanone 6.20 6.97 5.61 6.90 18 53 45 100
46.548 2098 10-Methyleicosane 0.75 – – – 100 – – –
49.862 2170 Cyclododecane – – 0.42 – – – 100 –
50.189 2176 5-Acetoxymethylfurfural – – – 0.29 – – – 100
50.679 2186 Nonanoic acid 0.70 0.75 1.01 0.34 26 57 100 63
51.673 2204 15-Methyl ester hexadecanoic acid – – 0.40 – – – 100 –
53.461 2225 Ethyl ester hexadecanoic acid – – 0.72 – – – 100 –
53.824 2229 DDMPc 1.61 2.23 0.70 1.61 24 57 25 100
54.464 2236 Ethyl esterE-11 hexadecanoic acid – – 1.02 – – – 100 –
54.732 2239 2,3-Dimethoxy-naphthalene – – 1.67 – – – 100 –
55.814 2251 2,3,4-Trimethyl-hexane 6.06 – – – 100 – – –
59.217 2287 3,5-Dimethoxy methyl ester benzoic acid – – 0.82 – – – 100 –
63.074 2345 Dodecanoic acid – – 1.12 – – – 100 –
63.381 2395 5-Hydroxymethylfurfural 0.31 14.71 4.86 10.93 1 59 29 100
65.352 2457 Dihydro-4-hydroxy-2-(3H)-furanone 0.33 – – 0.37 21 – – 100
Total compounds identified by honey
50 37 60 48
Sum of total area 2.8×10⁸ 4.3
×108 5.2
×108 5.12 ×10⁸
% R.S.D. (n= 4) 2.81 1.95 7.35 7.30
aExperimentally determined Kov`ats indices on the BP-20 column, relative to C
8–C20hydrocarbons. b 1-[3-[2-Methyl-2-[5-methyl-2-furanyl]propyl]oxiranyl]-ethanone.
Fig. 2. Comparison of the performance of different SPME coatings on the carbonyl compounds, monoterpenoids, furanic compounds and sesquiterpenoids extraction (hex: hexane; hep: heptane; benz: benzaldehyde; benzacet: benzeneacetaldehyde; diprop: 1,3-hydroxy-2-propanone; Lin O: linalool oxide; T Lin:trans-linalool oxide; C Lin:cis-linalool oxide; Lin: linalool; OHT: hotrienol; fur: furfural; furet: 1-(2-furanyl)-ethanone; furan: furanmethanol; DDMP: 2,3-dihydro-3,5-dihydroxy-6-methyl-4H-pyran-4-one; HMF: 5-hydroxymethylfurfural; ele:-elemene; car: 3-carene; cub:-cubebene; bis:␣-bisabolene; ger:d-germacrene).
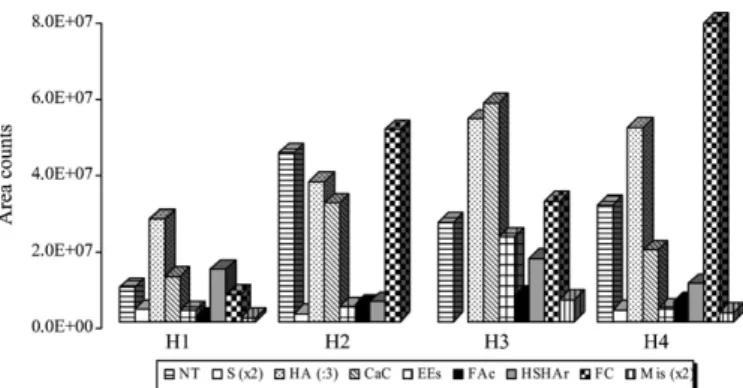
2-methylcyclopentanone, has been detected only in this honey sample.Fig. 4presents the distribution of compounds classes by honey sample.
The presence of several honey constituents found in this study have been previously reported. The presence of hotrienol in the
Eucryphia lucidahoney[38]. We have also found, for instance aromatic aldehydes such as benzaldehyde and benzeneacetalde-hyde, which have been reported as common components of various unifloral honey[39].
3.3. Multivariate analysis
The proposed headspace SPMEDVB/CAR/PDMS method was applied to four different commercial honeys. Evidently, the dif-ferent concentrations of the volatile constituents determined in these samples allow their differentiation. Although the volatile compounds studied showed important data for the characteri-zation of honey samples, the differentiation is quite difficult to establish from the direct observation of Table 3. Multivariate
techniques of data analysis represent a powerful statistical tool to explain this differentiation. The total peak area of each chem-ical group, higher alcohols (HA), fatty acids (FAc), ethyl esters (EEs), C13-norisoprenoids/monoterpenols/sesquiterpenoids (NTS1), furanic compounds (FC), carbonyl compounds (CaC) and aliphatic/aromatic hydrocarbons (HSHAr), were used as variable vectors for multivariate analysis in order to obtain more detailed information. When PCA was applied to the total peak area different chemical classes, three factors were extracted and 98.3% of the total variance was explained (Table 4). As can be seen in Fig. 5a, a clear separation can be observed. Considering the factor loadings of the variables (Table 5), the most influential variables (chemical groups) to the first component (PC1, 50.1%), are carbonyl com-pounds, ethyl esters and fatty acids, while NTS1, HSHAr (25.9%) and furan derivatives (22.3%), are the variables that most contribute to the PC2 and PC3, respectively. Fig. 5a shows the scores scatter plot of the first two principal com-ponents (50.1% of the total variability) that represents the
Table 4
Percentage of variance and percentage of cumulative variance explained by the three first principal components Component Total variance explained
Extraction sums of squared loadings Rotation sums of squared loadings
Total % of variance Cumulative % Total % of variance Cumulative %
1 3.771 53.877 53.877 3.509 50.124 50.124
2 2.449 34.988 88.864 1.814 25.917 76.041
3 0.664 9.491 98.355 1.562 22.314 98.355
Fig. 3. Comparison of GC–qMS profiles of HS-SPMEDVB/CAR/PDMS H1–H4 honey extracts obtained at 60◦C during 40 min. Peak identification: (1) ethanol; (2) toluene; (3) 4-methyl-2-pentanol (IS); (4) 1,3-butanediol; (5) 1-hydroxy-2-propanone; (6) nonanal; (7) 3-octanol (IS); (8)trans-linalool oxide; (9) furfural; (10) benzaldehyde; (11) linalool; (12) hotrienol; (13) benzeneacetaldehyde; (14) acetophenone; (15) 1-nonanol; (16) eicosane; (17) naphthalene; (18) 3-ethyl-2-pentene; (19) 2-methyl-2-phenylethyl ester propanoic acid; (20)E-6,10-dimethyl-5,9-undecadien-2-one; (21)␣-2-propenyl-benzenemethanol; (22) heptadecane; (23) 2-ethyl-hexanoic acid; (24) 1-ethyl-2-hepthyl-cyclopropane; (25) 1,3-dihydroxy-2-propanone; (26) nonanoic acid; (27)N-(4-hydroxyphenyl)acetamide; (28) 2,3-dihydro-3,5-dihydroxy-6-methyl-4H-pyran-4-one; (29) 5-hydroxymethylfurfural; (31)␣-ionol (32) acid acetic; (33)–(42) (compounds from 33 to 42 were not detected with this fibre); (43) 1-methyl-4-(1-methylethyl)-benzene; (44)cislinalool oxide; (45) 2-undecanol; (46) 2-methyl-cyclopentanone; (47) 2,3,4,5-tetramethyl-1,4-hexadiene; (48) octanoic acid; (49) 2-nonen-1-ol; (50) ethyl ester octanoic acid; (51) methyl ester decanoic acid; (52) ethyl ester decanoic acid; (53) methyl ester dodecanoic acid; (54) ethyl ester dodecanoic acid; (55) phenol; (56) 2-ethyl hexanoic acid; (57)o-methoxyacetophenone; (58) methyl tetradecanoate; (59) ethyl ester tetradecanoic acid; (60) cyclododecane; (61) ethyl ester hexadecanoic acid; (62) ethyl ester hexadecanoic acid E11; (63) 5,7,8-trimethyl coumarin; (64) 3,5-dimethoxy-methyl ester benzoic acid; (65) dodecanoic acid; (66) 2-hydroxy methyl ester benzoic acid.
distinction among the honey samples. Fig. 5b represents the corresponding loadings plot that established the relative importance of each chemical group. H1 and H2 honeys (third quadrant) are characterized by the carbonyl compounds (CaC), ethyl esters (EEs) and in lower extent, by fatty acids
Fig. 4. Distribution of compounds classes by honey samples (NT: C13 -norisoprenoids and monoterpenoids; S: sesquiterpenoids; HA: higher alcohols; CaC: carbonyl compounds; EEs: ethyl esters; FAc: fatty acids; HSHAr: aliphatic and aromatic hydrocarbons; FC: furanic compounds; Mis: miscellaneous).
Table 5
Loadings of volatiles in the first three principal components Rotated component matrixa
Component 1 Component 2 Component 3
CC 0.994 0.081 −0.019
EE 0.960 −0.220 −0.060
FA 0.783 0.208 0.579
Alc 0.781 −0.169 0.556
NTS 0.186 0.938 0.284
HSHA 0.579 −0.802 −0.124
F −0.057 0.403 0.904
(1) PC1; (2) PC2 and (3) PC3; rotation method: Varimax with Kaiser nor-malization; CC: carbonyl compounds; EE: ethyl esters; FA: fatty acids; Alc: higher alcohols; NTS: C13-norisoprenoids, monoterpenoids and sesquiter-penoids; HSHA: aliphatic and aromatic hydrocarbons; F: furanic compounds. Extraction method: principal component analysis. Rotation method: Varimax with Kaiser normalization.
aRotation converged in five iterations.
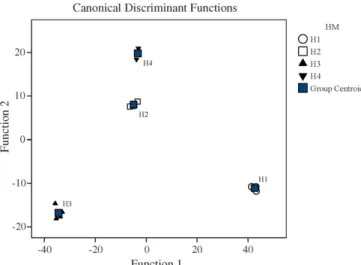
After PCA, a linear discriminant analysis (LDA) was run, using the above-mentioned variables, in order to obtain suitable classification rules.Fig. 6shows a projection of the honeys in two-dimensional space, generated by the two first discriminate
Table 6
Prediction abilities for the different honeys, using stepwise discriminant analysis HM Classification resultsa,b
Predicted group membership Total
H1 H2 H3 H4
Original
CountH1 4 0 0 0 4
H2 0 4 0 0 4
H3 0 0 4 0 4
H4 0 0 0 4 4
% H1 100.0 0 0 0 100.0
H2 0 100.0 0 0 100.0
H3 0 0 100.0 0 100.0
H4 0 0 0 100.0 100.0
Cross-validatedc
CountH1 4 0 0 0 4
H2 0 4 0 0 4
H3 0 0 4 0 4
H4 0 0 0 4 4
% H1 100.0 0 0 0 100.0
H2 0 100.0 0 0 100.0
H3 0 0 100.0 0 100.0
H4 0 0 0 100.0 100.0
a 1000% of original grouped cases correctly classified. b 1000% of cross-validated grouped cases correctly classified.
c Cross-validation is done only for those cases in the analysis. In cross-validation, each case is classified by the functions derived from all cases other than that case.
functions that explain 97.9% of the total variance. Four groups representing each honey, H1–H4, were clearly observed. The good agreement achieved indicates that very acceptable classifi-cation functions can be deduced. The leave one out method was used as cross-validation procedure to evaluate the classification performance (Table 6).
From the results it can be concluded that headspace SPME coupled to GC–qMS and chemometrics is a very appropriate sampling technique to distinguish the different Portuguese hon-eys studied based on their volatile profile.
Fig. 6. Differentiation between H1–H4 honeys by applying LDA.
4. Conclusions
Headspace solid-phase microextraction sampling followed by GC–qMS analysis provides an appropriate and selective way to characterize the volatile compounds in honey. Is a simple pro-cedure of extraction with a great capacity of concentration and combines extraction to a rapid, sensitive and solvent-free method suitable for determination of volatile and semivolatile com-pounds. The chromatographic profiles obtained after extraction with PDMS, PA, CAR/PDMS, CW/DVB and DVB/CAR/PDMS coatings suggest that the later was the most suitable for the SPME analysis of honey volatiles. The more polar fibre, PA, shows no more effective extraction for polar such as higher alcohols, fatty acids, furan derivatives and carbonyl compounds, while DVB/CAR/PDMS favours the extraction of less polar compounds like ethyl esters, C13-norisoprenoids/monoterpenes, sesquiterpenoids and aliphatic and aromatic hydrocarbons. More than 100 volatile compounds, including higher alcohols, ethyl esters and fatty acids, were identified. The higher alcohols, fatty acids and C13-norisoprenoids/monoterpenes constitute impor-tant aroma groups compounds which contributes with “fruity”, “cheese/fatty” and “flowery” notes to honey sensory properties. Using a chemometric approach (PCA and LDA), the volatile composition in terms of average peak areas, provides a suitable tool to differentiate between the analysed honeys.
References
[1] L. Cuevas-Glory, J. Pino, L. Santiago, E. Sauri-Duch, Food Chem. 103 (2007) 1032.
[2] M. Al-Mamary, A. Al-Meeri, M. Al-Habori, Nutr. Res. 22 (2002) 1041.
[3] S. Buratti, S. Benedetti, M. Cosio, Talanta 71 (2007) 1387.
[4] E. Alissandrakis, P. Tarantilis, P. Harizanis, M. Moschos, J. Sci. Food Agric. 85 (2005) 91.
[5] B. D’Arcy, G. Rintoul, C. Rowland, A. Blackman, J. Agric. Food Chem. 45 (1997) 1834.
[6] R. P´erez, C. S´anchez-Brunete, R. Calvo, J. Tadeo, J. Agric. Food Chem. 50 (2002) 2633.
[7] F. Bianchi, M. Carreri, M. Musci, Food Chem. 89 (2005) 527. [8] C. Guyot, V. Scheirman, S. Collin, Food Chem. 64 (1999) 3.
[9] V. Ferreira, N. Ortin, A. Escudero, R. Lopez, J. Cacho, J. Agric. Food Chem. 50 (2002) 4048.
[10] J. Nu˜nez, H. Bemelmans, Chromatogr. A 294 (1984) 361.
[11] G. Blanch, G. Reglero, M. Herraiz, J. Agric. Food Chem. 43 (1995) 1251. [12] R. L´opez, M. Aznar, J. Cacho, V. Ferreira, J. Chromatogr. A 966 (2002)
166.
[13] C. Cocito, G. Gaetano, C. Delfini, Food Chem. 52 (1995) 311. [14] H. Lord, J. Pawliszyn, J. Chromatogr. A 885 (2000) 153. [15] Z. Zhang, J. Pawliszyn, Anal. Chem. 65 (1993) 1843.
[16] E. Baltussen, P. Sandra, F. David, C. Cramers, J. Microcolumn Sep. 11 (1999) 737.
[17] R. Alves, A. Nascimento, J. Nogueira, Anal. Chim. Acta 546 (2005) 11. [18] E. Coelho, S.M. Rocha, I. Delgadillo, M.A. Coimbra, Anal. Chim. Acta
563 (2006) 204.
[19] S.M. Rocha, P. Coutinho, A. Barros, I. Delgadillo, M.A. Coimbra, J. Chro-matogr. A 1114 (2006) 188.
[20] J. Demyttenaere, C. Dagherb, P. Sandra, S. Kallithraka, R. Verh´e, N. Kimpe, J. Chromatogr. A 985 (2003) 233.
[21] M. Begala, L. Corda, G. Podda, M. Fedrido, P. Traldi, Rapid Commun. Mass Spectrom. 16 (2002) 1086.
[22] M. Burmeister, C. Drumond, E. Pfiesterer, D. Hysert, J. Am. Soc. Brew. Chem. 50 (1992) 53.
[23] O. Pinho, I. Ferreira, L. Santos, J. Chromatogr. A 1121 (2006) 145. [24] J. Cˆamara, J. Marques, R. Perestrelo, F. Rodrigues, L. Oliveira, P. Andrade,
M. Caldeira, J. Chromatogr. A 1150 (2007) 198.
[25] J. Demyttenaere, C. Dagherb, P. Sandra, S. Kallithraka, R. Verh´e, N. Kimpe, J. Chromatogr. A 985 (2003) 221.
[26] J. Pino, M. Mart´ı, M. Mestres, J. P´erez, O. Busto, J. Guasch, J. Chromatogr. A 954 (2002) 51.
[27] J. Pino, R. Marbot, C. V´azquez, J. Agric. Food Chem. 49 (2001) 5883. [28] J. Pino, R. Marbot, C. V´azquez, J. Agric. Food Chem. 50 (2002) 6023. [29] M. Lopez, G. Guzm´an, A. Dorantes, J. Chromatogr. A 1036 (2004) 87. [30] A. Gioacchini, M. Menotta, L. Bertini, I. Rossi, S. Zeppa, A. Zambonelli,
G. Piccoli, V. Stocchi, Rapid Commun. Mass Spectrom. 19 (2005) 2365. [31] F. Augusto, A. Valente, E. Tada, S. Rivellino, J. Chromatogr. A 873 (2000)
117.
[32] E. Alissandrakis, P. Tarantilis, P. Harizanis, M. Polissiou, Food Chem. 100 (2007) 396.
[33] M. Baroni, M. Nores, M. D´ıaz, G. Chiabrando, J. Fassano, C. Costa, D. Wunderlin, J. Agric. Food Chem. 54 (2006) 7235.
[34] A. Soria, I. Mart´ınez-Castro, J. Sanz, J. Sep. Sci. 26 (2003) 793. [35] I. Jerkovi´c, J. Masteli´c, Z. Marijanovi´c, Chem. Biodivers. 3 (2006) 1307. [36] R. Pe˜na, J. Barciela, C. Herrero, S. Garcia-Mart´ın, J. Sep. Sci. 27 (2004)
1540.
[37] J.S. Cˆamara, M.A. Alves, J.C. Marques, Anal. Chim. Acta 555 (2006) 191.
[38] C.Y. Rowland, A.J. Blackman, B.R. D’Arcy, G.B. Rintoul, J. Agric. Food Chem. 43 (1995) 753.