UNIVERSITE CATHOLIQUE DE LOUVAIN
LOUVAIN SCHOOL OF MANAGEMENT
and
NOVA SCHOOL OF BUSINESS AND ECONOMICS
RETURN MIGRATION AND ENTREPRENEURSHIP: AN IV APPROACH
Supervisor at LSM: William Parienté Supervisor at NOVA SBE: Pedro Vicente
Research Master’s Thesis
Submitted by: Diogo Silva Pereira Teles Machado With a view of getting the degrees
I would like to express my special appreciation and thanks to my supervisors
Professors Pedro Vicente and William Parient´e for sharing their experience
and knowledge with me. In addition, my thanks to Professor C´atia Batista
for helping me handling the data-set and Professor Fr´ed´eric Docquier for
his useful insights. I am also grateful to Mariana, Ana and Marco for their
presence and understanding. Finally, this thesis is dedicated to my parents
for their unconditional support.
The main data-set used in this master thesis was made available by C´atia
Batista and Pedro Vicente for the sole purpose of submitting it at Nova SBE
Contents
1 Introductory Framework 1
1.1 Introduction . . . 1
1.2 Literature Review . . . 2
1.2.1 Entrepreneurship and Development . . . 2
1.2.2 Entrepreneurship and Migration . . . 6
1.3 Cape Verde: Introduction to the Country . . . 11
2 Empirics 13 2.1 Estimation Methods . . . 13
2.1.1 Econometric framework . . . 13
2.1.2 Identification Strategy . . . 15
2.1.3 Estimation Strategy . . . 18
2.2 Data Description . . . 20
2.2.1 Household Survey . . . 20
2.2.2 Descriptive Statistics . . . 21
2.3 Results . . . 25
3 Final Remarks 35 3.1 Discussion . . . 35
3.2 Conclusion . . . 37
4 Bibliography 40
1
Introductory Framework
1.1
Introduction
Business creation is a critical process in a market economy. As systematized
by Wennekers and Thurik (1999), besides being a source of employment and
physical capacity, it contributes to improve market efficiency through
effec-tive or potential competition, and it also prompts innovation by exploring
new market spaces. Thus, the study of entrepreneurship is important for
economic growth and development.
Nevertheless, developing countries have higher rates of entrepreneurship
than developed economies, which could look counterintuitive. Banerjee et al.
(2011) suggest that it is due to the fact that most of the entrepreneurs in
developing nations are probably forced into that occupation, acting in the
informal sector. Indeed, as shown in the report by WBCSD and SNV (2007),
the unofficial labor market varies from an estimated 4% – 6% in developed
countries to over 50% in developing economies. Moreover, it is almost certain
that forced entrepreneurs do not have the motivation, ambition and skills that
formal entrepreneurs have. As a result, despite not undervaluing the role of
this forced/survival entrepreneurship on poverty reduction, it is likely not to
be contributing to economic development as formal entrepreneurship.
Migration may be a possible source of formal entrepreneurs, given the
experience and skills that are acquired when living and working abroad.
Mi-grants may learn and be inspired by other entrepreneurs in the host country,
thus getting the capacities and motivation to be entrepreneurs back home.
and also discover opportunities that can be replicated in their home country.
As a result, the role of this research is to study the relation between
migra-tion and business capabilities. Initially, one will analyze whether migramigra-tion
contributes to foster business creation. In addition, entrepreneurship will be
differentiated in an attempt to understand the contribution of migration on
formal, rather than forced entrepreneurship. In order to do so, one will use
instrumental variables to address the identification issues related with the
migration experience.
This study is organized as follows. Section 1 will review the literature on
the relation between business creation and economic development, as well as
how return migration may be a source of entrepreneurs. Moreover, it will
be followed by a brief introduction to the country of Cape Verde, where the
empirical analysis is based. Section 2 is the empirical part of the research,
providing the explanation of the identification problem and how it will be
addressed. This section will also describe the data and present the estimation
results. Finally, section 3 will explain and discuss how the achieved findings
contribute to the literature on this topic and will conclude with possible
policy recommendations.
1.2
Literature Review
1.2.1 Entrepreneurship and Development
Several studies analyze the importance of entrepreneurship for regional
de-velopment. The creation of new firms contributes to generate employment
market process. As shown in Boeri and Cramer (1992) only a fraction of
new businesses will survive for a long period due to competition and market
selection, and those which do survive may displace less efficient incumbents.
Fritsch (2008) stresses that at a constant output level, this market
selec-tion process should lead to a decrease of labor and capital usage, because
fewer resources are needed in order to produce a given amount of goods
and services at a higher productivity level. However, as he reckons, there
are several channels through which the entry of new businesses may
stim-ulate growth on the supply-side of the market. Indeed, in the spirit of the
creative destruction process proposed by Schumpeter (1942), entrepreneurs
accelerate structural change. In this case, less efficient incumbents are
sub-stituted by newcomers. In addition, the entry or simply threat of entry by
entrepreneurs may also secure efficiency and stimulate productivity by the
incumbents (Baumol et al., 1982). With the risk of being displaced, these
are thus disciplined in order to maintain their positions.
Furthermore, entrepreneurs contribute to foster innovation, particularly
by creating new markets (Acs and Audretsch, 1990; Audretsch, 1995;
Bau-mol, 2004). The reason why a new firm is more likely to bring a radical
innovation than an incumbent, as posed by Arrow (1962), is because the
former has higher incentives to do so. Incumbents are more interested in
exploiting the profits of their current activities rather than generating new
products and processes that may contest their current ones. While this would
only have a profit replacement effect, the profits generated by new firms are
brand new. Hence, as claimed in Audretsch (1995) entrepreneurs will tend to
only or the most promising possibility to succeed in establishing a new
busi-ness. Incumbents may also have heavier organizational structures, which are
less prone to creativity and innovation. In opposition, new firms have leaner
structures which in turn makes them more flexible and capable to innovate.
Finally, entrepreneurs contribute to a greater variety of products and
problem solutions. By introducing differentiated products, the greater
va-riety implies a higher probability of finding a supply with a better match
for customer preferences. Increased variety due to new supplies may
stimu-late further specialization of labor as well as follow-up innovations and thus
generate significant impulses for economic development.
These factors play a critical role in the development process of a market
economy. As such, in the early post-war period, researchers attached great
importance to fostering entrepreneurship in developing countries (Parker,
2009). Indeed, in Lewis (1955), the author highlights that economic growth
is bound to slow unless there is an adequate supply of entrepreneurs searching
for new ideas, and willing to take the risk of introducing them.
However, this initial enthusiasm diminished in the 1970’s, because
devel-oping countries had already markedly higher self-employment rates than
de-veloped countries (Leff, 1979). Therefore, despite not ignoring entrepreneurs,
development economists started questioning the causality between
entrepreneur-ship and development. In fact, Hessels et al. (2008) argue that new
busi-ness creation and resource coordination may not necessarily foster economic
growth, and may actually be the result of it. Also, the type of
entrepreneur-ship and the nature of the innovation that is introduced will have
Besides, as claimed by Bennett (2010), in spite of the high rates of
en-trepreneurship in developing countries, the majority of the entrepreneurs act
in the informal or survival sector. This form of survival entrepreneurship,
although contributing to poverty alleviation (see e.g., Tamvada, 2010; Berner
et al., 2012), is not likely to be a driver of economic growth (Naud´e, 2011).
In fact, on the data used in Banerjee et al. (2011) across 18 countries, the
majority of the businesses owned by poor people had no paid employees, no
physical space, neither any machine or vehicle. What is more, in the cases
when they were revisited three years later, most of them were no longer
in activity, or were stagnant. Another characteristic of these businesses is
that they were barely profitable. Even before deducting the value of the
entrepreneurs’ labor, a considerable amount of firms reported losses. This
low profitability and incapacity to grow a business explains why survival
entrepreneurship is probably not essential for economic development.
The most relevant factors affecting the capacity for these survival
en-trepreneurs to succeed are probably financial and regulatory. Still, even in
the absence of these constraints, survival entrepreneurs are also likely to lack
the skills. According to several surveys conducted in developing countries
around the world, Banerjee et al. (2011) found that there is a predominant
preference for stable jobs. When respondents were asked what they aspire for
their children, vast majority wanted them to be e.g., public servants,
profes-sors, nurses or employees at private firms. As a result, survival entrepreneurs
are most certainly forced into this occupation, having absolutely no ambition
or vocation for it.
with growth are the ones that pursue radical innovations. In the other hand,
the ones acting in the survival sector are more likely to pursue replicative
innovations, which are less relevant. As a result, it is more important to
study the determinants of formal, rather than of survival entrepreneurship.
In addition, the correction of market failures and institutional weaknesses
are also of critical analysis, as these affect the source of opportunities to
be explored by potential entrepreneurs. This reasoning gave light to the
concept of institutional entrepreneur. It is defined by Li et al. (2006) as the
innovative person who starts or expand his or her business venture and in the
process helps to destroy the prevailing non-market institutions in order for the
business to be successful. These entrepreneurs may thus shape institutions.
In summary, formal entrepreneurs may contribute significantly more to
an economy by increasing its capacity, generating more jobs, stimulating
innovation and possibly shaping institutions. These entrepreneurs are more
ambitious, inspired and motivated to be successful, so they are more likely to
have a vocation and higher ability for their occupation. As they are certainly
a minority within the existing entrepreneurs, and thus difficult to identify, the
next section will address how migration may be a possible source of formal
entrepreneurs.
1.2.2 Entrepreneurship and Migration
There are strong evidences that immigrants tend to be more entrepreneurial
than natives at the host country (see e.g., Borjas, 1986; Lofstrom, 2004;
Schuetze and Antecol, 2007). While the reasons behind this fact are of
entrepreneurial when they return to their home country. Arguably, due to
their experience abroad, they may acquire the initial capital, skills,
inspira-tion and networks that possibly make them more capable of being formal
entrepreneurs. By adopting the best practices developed in the host country
they may successfully explore business opportunities back home.
In spite of being one of the most understudied aspect of international
migration (Docquier and Rapoport, 2012), there is already a consistent set of
literature analyzing return migration, namely its impact on entrepreneurship.
The first block of research was initially focused in assessing the role of
savings acquired abroad on overcoming financial constraints back in the home
country. Dustmann and Kirchkamp (2002) explore a survey of Turkish
re-turnees from Germany, providing evidence that savings of returning migrants
may be an important source of start-up capital for micro-enterprises.
Be-sides, higher earnings in the host country, in conjunction with planned
en-trepreneurship after return, reduce migration duration. The decision to open
a business is probably endogenous as the aspiration to be an entrepreneur
in the future may affect the migration duration. This is why the authors
in-strument the decision to become self-employed with previous self-employment
experience, as this should reduce the organizational and psychological costs
of becoming an entrepreneur. Former entrepreneurs are likely to be familiar
with the administrative processes, as well as with the initial difficulties
as-sociated with starting a business. In line with this result, Mesnard (2004)
compares employed and self-employed return migrants in Tunisia. She finds
that migrants who are self-employed after returning accumulated more
savings are an important factor. There was a particular concern with the
en-dogeneity of the decision to save. Due to structural reasons linked with the
simultaneous decisions of saving and starting a business, as well as to
unob-served heterogeneity, the decision to save was probably endogenous. Thus,
the logarithm of income and the age of the return migrants were used as
identifying instruments for savings.
While these studies limit their analysis only to return migrants, Wahba
and Zenou (2009) also consider non-migrants. As a result, they assess whether
or not returnees are more entrepreneurial than non-migrants. Yet, temporary
migration and entrepreneurship may be endogenously determined decisions.
Indeed, migration may increase the probability of entrepreneurship, but it
can also be that individuals planning to be entrepreneurs are more likely to
migrate. In result, they instrument the migration decision with the share
of migrants in the total population in the sub-district of origin of each
indi-vidual. This instrument, representing migration networks, is the most
com-monly used in the migration literature. After discussing the suitability of
the instrument, they find that controlling for the return decision, a returnee
is more likely to become an entrepreneur than a non-migrant. Moreover, the
authors argue that despite losing social networks in the home country while
they are abroad, savings and human capital accumulation acquired overseas
over compensate for this loss.
A key element that was missing from the exposed literature was the
dis-tinction between different types of self-employment. As explained in section
1.2.1, most of the entrepreneurs in developing countries are probably forced
capacities as formal entrepreneurs. This distinction is important since forced
entrepreneurs are likely to have a weaker direct impact on growth compared
to formal entrepreneurs.
In this line of thought, by focusing on a data of micro-enterprises from
West Africa, De Vreyer et al. (2010) also use migration networks as an
in-strument to estimate the effect of return migration on firms’ value-added.
They find that when the entrepreneur is a return migrant the value-added of
his or her firm is significantly higher, but only if the host country is part of
the OECD. Hence, their result suggests that having a Western work
expe-rience gives a productive advantage to micro-entrepreneurs. Arguably, this
advantage could derive from enhanced entrepreneurial skills or from specific
knowledge acquired abroad.
In Piracha and Vadean (2010), the authors explore micro-data from
Alba-nia to take a further step on disentangling the different types of
entrepreneur-ship. They explicitly differentiate between the propensities of returnees to
become self-employed as forced entrepreneurs, denoted own account workers
(i.e., without having any paid employees), and as formal entrepreneurs (i.e.,
owners of firms with paid employees). Again, migration networks are also
used to take into account the possible sample selection into return migration.
They find that without the migration experience, returnees would have been
more likely to be forced entrepreneurs and less likely to be entrepreneurs,
thus giving a lower contribution to employment creation.
Going in the same direction as the previous study, Marchetta (2012) uses
data from Egypt to analyze a necessary precondition for a lasting positive
sur-vival over time. As such, she assesses whether the migration experience of
an entrepreneur plays a role in explaining the chances of survival of his or
her firm. Likewise, return migrants can positively or negatively self-select
with respect to unobservables that influence the chances of survival of their
entrepreneurial activities, as e.g., talent or risk-preferences. In this case, the
author uses two instruments separately for the return decision. The first is
the population growth rate in the year of birth of the entrepreneur, and the
second is the real price of crude oil when the entrepreneur was 21 years old.
She argues that demographic factors influence considerably the scale of
mi-gration flows, while the use of the second instrument takes advantage of the
fact that most Egyptian migrants opt for oil-producing countries. In both
specifications her results show that returnees’ businesses enjoy a significantly
higher probability of surviving over time with respect to stayers.
Except for the articles that focus solely on returnees, all the cited studies
analyze the impact of the decision to return. This decision is captured with
a dummy variable that assumes the value of one when an individual is a
returnee, and zero otherwise. As it will be explained in section 2.1.2 there
may be a self-selection issue on the decision to go abroad, but also on the
decision to return. That is, within those who migrated, the ones that return
may self-select in terms of observable and unobservable characteristics. In
spite of this fact, the previous articles only use one instrument for the decision
to return. In fact, they explicitly address the self-selection on the decision
to migrate, but ignore the possible self-selection into the subsequent inward
movement.
authors study the effects of return migration on entrepreneurship in
Mozam-bique, using instruments in one of their frameworks to control for both the
outward and inward self-selection effects. Hence, they use proximity to rebel
strongholds in times of war to instrument the decision to leave. Besides,
in order to instrument the decision to return they use changes in GDP per
capita and nominal exchange rates, as well as the distance between survey
districts and migrant destinations. In result, the authors find returnees to
be significantly more entrepreneurial than stayers, due to the migration
ex-perience.
This current research aims at contributing to the literature by following
the same methodology as in Batista et al. (2012b), that is, controlling for
both possible self-selection effects. Moreover, one will attempt to differentiate
between different types of entrepreneurship as in Piracha and Vadean (2010)
and Marchetta (2012), by analyzing employment and investment decisions.
In order to do so an household survey conducted in Cape Verde is explored.
This survey is described in section 2.2.1.
1.3
Cape Verde: Introduction to the Country
One will now proceed to a brief description of Cape Verde, with special
em-phasis on its migration history. Cape Verde is a small archipelago composed
by 10 islands located in Africa at the North Atlantic Ocean (see appendix 1
for a map of the archipelago). The country received its independence from
Portugal in 1975 and was ruled in a one-party system until 1990, but it has
been a stable democracy since 1991. Furthermore, with 491875 inhabitants
which only 10% is arable. Therefore, the country is seriously dependent on
food imports. With few natural resources and suffering from poor rainfalls
and limited fresh water, its economy is service-oriented with a strong
empha-sis on tourism, which accounts for more than 65% of GDP (Country-Watch,
2013). Cape Verde graduated from the United Nations list of least developed
countries by the year of 2007 and, with a GDP of $1827 billion in 2012, it is
considered to be a lower middle income country by the World Bank.
There is a longstanding migration tradition in Cape Verde. Docquier
et al. (2008) estimate a migration rate of 30.4% in 2000, which is the
high-est rate in Africa. What initially provoked or at least decisively influenced
this phenomenon was the frequent occurrence of tragic natural disasters that
have punctuated the history of these islands. As it is explained in Carreira
and Fyfe (1982), their arid climate, lack of arable land and their orographic
system of sharp forms are all detrimental for agriculture. Moreover, with low
and irregular rainfalls, droughts are frequent and prolonged. This prevents
plants from seeding and growing, so farming declines and pastures dry up
making cattle die of hunger. As a result, this inevitable irregularity of the
rains caused several situations of endemic famine, leading to catastrophic
lev-els of mortality among the population. In “crisis years”, as they are called in
Cape Verde, 10% – 30% of the population have died. In addition, occasional
heavy rains, easterly winds and the subsequent floods are also a source of
economic instability and contribute to further soil erosion. These exogenous
factors resulted in a large-scale exodus of people that found in migration the
2
Empirics
2.1
Estimation Methods
The econometric framework supporting the analysis of return migration and
its impact on entrepreneurship will be explored in this section along with its
identification and estimation strategy. Besides the choice to open a business,
other business related variables will be analyzed, as employment creation and
investment decisions, all at the household level. Therefore one will use the
expression business skills to denote a skillful individual at a given household.
Arguably, with all other factors held constant, a household with an individual
who has better business skills is more likely to have a business and scale it,
generating more jobs and investment.
2.1.1 Econometric framework
In line with Heckman and Robb Jr (1985) and Imbens and Angrist (1994),
two possible business skills outcomes were considered:
B1i if Ri = 1
B0i if Ri = 0
Where B1i represents the business skills outcome for an individual that
mi-grated and returned (Ri = 1) and B0i for an individual without that
ex-perience (Ri = 0). It is not possible to simultaneously observe the actual
and counterfactual outcome for each individual in the sample. That is, it is
not possible to compare how the migration experience affected the business
individual did not experience it. From the data it is only possible to
ob-serve B1i, which is the business skills outcome if an individual went through
the migration experience, or B0i if he or she did not. However, the
indi-vidual causal effect of returning from abroad (B1i−B0i) cannot be directly
measured. One must then estimate the average difference in business skills
outcomes between those with and without the international experience, that
can be described as:
E[Bi|Ri = 1]−E[Bi|Ri = 0] =
=E[B1i|Ri = 1]−E[B0i|Ri = 1] +E[B0i|Ri = 1]−E[B0i|Ri = 0] =
=E[B1i−B0i|Ri = 1] +E[B0i|Ri = 1]−E[B0i|Ri = 0] (1)
Equation 1 contains the Average Treatment Effect (ATE) given by E[B1i−
B0i|Ri = 1], which isolates the causal effect of the migration experience on the
business skills outcome. However, it also containsE[B0i|Ri = 1]−E[B0i|Ri =
0], which is the selection bias. This bias stresses that the difference in
busi-ness skills outcomes may accrue from different factors, others than the
in-ternational experience solely. Hence, differences between households with
and without returnees would persist even if these had not had migrated and
returned.
As pointed out in Gibson et al. (2009), migrants may self-select in terms
of observable as well as unobservable characteristics and several studies show
evidences of this fact (see e.g., Akee, 2010; McKenzie et al., 2010; Batista
and Umblijs, 2013). For example, an individual may decide to migrate due to
unobserved personality traits, as being more adventurous, risk-taker or
as being a successful entrepreneur is also associated with them. Due to this
positive self-selection, it becomes uncertain whether differences in observed
business skills are driven by the migration decision or by the exemplified
characteristics. In the other hand, the self-selection may also be negative.
Arguably, individuals who are less able may find it more difficult to e.g., find
a job in their home country and thus migrate, or, by the same reason, decide
to become entrepreneurs (in this case forced entrepreneurs). As a result, the
identification strategy needs to take this potential self-selection into account.
Finally, given that it may be driven by unobserved characteristics, methods
like Ordinary Least Squares (OLS) or matching that only assume selection
on observables are likely to be biased.
2.1.2 Identification Strategy
There are different possibilities to deal with the selection bias. In an ideal
situation individuals would be randomly assigned to a treatment (migrate
and return) and control group, such that:
Ri ⊥ (B1i;B0i) (2)
This means that there would be no selection effect by construction. Such
experiment would allow one to analyze the causal effects of the migration
experience on business skills outcomes. In order for condition 2 to hold,
individuals would have to be randomly selected to go abroad – the outward
movement. Subsequently, within the selected, a new group would have to be
framework with no selection effects is only possible after accomplishing this
two steps, because both the outward and inward movements may be driven
by different observed and unobserved characteristics.
In the absence of such experimental data, this research will make use of
instrumental variables (IVs) to explore exogenous variations of the migration
decision, with the two-stage least-squares (2SLS) method. In order for an
instrument to be used, two conditions must be verified. The first condition
measures the instruments’ strength. Taking into account the need to address
the potential selection effects of both the outward and inward movements,
the chosen set of instruments must explain the decision to migrate and the
decision to return. The higher the instruments’ explanatory power the higher
the consistency of the estimator. However, they cannot be correlated with
business skills outcomes, which is the second condition. If this condition is
not verified, then the instruments are not valid.
The reasoning behind this concept is that by only influencing business
skills outcomes through the migration experience channel, then the
instru-ments will provide an exogenous impact on the migration decision. By not
being influenced by other factors it is then possible to establish a causal
relation between the migration experience and business skills. As a result,
two instruments will be proposed: migrant networks and exchange rate
vari-ations.
Regarding the first instrument, several economic studies have examined
the role of migration networks in developing countries (see e.g., Munshi,
2003; McKenzie and Rapoport, 2010; Wahba and Zenou, 2005). Due to
current migration networks as an instrument. Indeed, as claimed by Massey
(1990), migration dynamics are a “cumulative causation”. Having contacts
in a foreign country may facilitate the share of information about living
conditions or work possibilities and may also help with the initial integration
and cultural shock. This means that by significantly reducing the risks and
costs associated with moving, network effects are likely to be an important
factor influencing the outward migration movement. Therefore, the first
condition is likely to be verified. The fulfillment of the second condition is
less straightforward. Indeed, the establishment of a network may be related
with variables at a community level which may also be affecting the outcome
of interest. As an example, if the network was initiated due to fact that
individuals in a given community were influenced by a risk-taking culture,
then that is likely to affect individuals’ business skills. Although, as it will be
explained, in the case under analysis this problem is less subject to concern.
As mentioned in section 1.3 and claimed by Batista et al. (2012a), Cape
Verde has a long-standing migration tradition, so the migration networks
under consideration were formed in the past (historical networks) and were
initially fostered by natural disasters as droughts and floods. Arguably, given
the historical dimension and exogeneity of these shocks, the second condition
is also likely to be fulfilled as they do not influence the choice to open a
business, nor employment or investment decisions. This instrument is taken
from the own survey, measuring the proportion of current migrants at the
Enumeration Area (EA) level (neighborhood or village).
The second instrument is the variation of the exchange rate at the host
move-ment. A positive variation of the exchange rate (an appreciation) makes
migrants become richer in the rest of the world (including in the home
coun-try), thereby influencing their return. The first condition is thus likely to
be met. Moreover, given the macroeconomic nature of this variable taking
place at a foreign country, it is legitimate to consider it does not influence
individuals’ business capabilities at the home country, in the form of
busi-ness creation and scale-up activities. This is why macroeconomic shocks are
commonly used as sources of exogenous impacts in the migration literature
(see e.g., Yang, 2008; McKenzie et al., 2014; Marchetta, 2012). Variation
at individual level is achieved the following way: a composite is constructed
with the variations of the real effective exchange rates from the host countries
and is weighted by the proportion of current migrants at those countries in
each EA. For each household, the assigned date is given by the year when
the household head turns 35, which is the average age when Cape Verdeans
open a business.
2.1.3 Estimation Strategy
Following the same framework as in Batista et al. (2012b), the estimated
regression will be the following:
Bi =β0+β1Ri+β2Xi+ui (3)
In this simple form, the dependent variable Bi is a proxy for business skills
of an individual at a household i. Bi will thus assume values for four
dif-ferent variables. The first is business ownership, which assesses whether or
not a household has an individual who opened a business, thus it is a
the quality of individuals’ business skills three other variables will be used
reflecting their capacity to scale-up a business. First, employment creation
will indicate whether a household has an individual who creates employment
positions. Second, investment in initial fixed capital, and third, investment
in equipment, will both represent whether a household has an individual who
invested in a business. Addressing this quality issue aims at taking into
ac-count that some businesses are employing uniquely the business owner and
have not involved any investment at all. In these cases the business owners
are likely to be forced entrepreneurs without necessarily any better business
skills than the rest of the non-entrepreneur population. Finally, Xi denotes
a group of household as well as regional variables that possibly influence
business skills, and Ri represents whether or not a household has a returnee.
With this specification, the coefficient of interest is β1, which measures
the impact of return migration on business skills. This effect can only be
interpreted as causal if E[Bi|X, Ri = 1] = E[Bi|X, Ri = 0]. However, this
condition is probably not met because of the selection effect in the outward
and inward movement, as explained in section 2.1.1. Then, this originates
an endogeneity issue as Ri is likely to be correlated with the error term
[corr(Ri, u)̸= 0], thereby biasing the estimation of β1.
To tackle the endogeneity problem, equation 3 will be estimated
instru-menting for the endogenous variableRi. The decision to return encompasses
both the outward and inward selection effects as only those who migrated
in the first place can return. Therefore the chosen set of m instruments zij
following equation that corresponds to the first stage of the 2SLS:
Ri =δ0+δ1Bi+δ2Xi+θ1zi1 +θ2zi2+...+θmzim+ϵi
Here, it must be that at least one coefficient θj ̸= 0. This condition concerns
the strength of the instruments, as the higher the correlation between the
instruments and the endogenous regressor, the more consistent the estimator
will be.
Furthermore, the instruments can only affect the dependent variable
solely through its effect on the migration experience Ri. Hence, in order
to fulfill the second condition concerning its validity, the instruments cannot
be correlated with other factors that may be explaining the decision to open
a business, hire more employees and invest in the firm, meaning that:
E(z′
ijui) = 0
As mentioned in section 2.1.2, two instruments will be used (m = 2). As both
selection effects are present in the observed return decision, then migration
networks and exchange rates variations will aim at, respectively, instrument
the outward and inward movement self-selection present in Ri. This process
could be performed with only one instrument if it could control for both
selection effects simultaneously, however, as discussed in Gibson et al. (2009)
it is difficult to find such instruments.
2.2
Data Description
2.2.1 Household Survey
The empirical analysis will be grounded on a household survey. The
CSAE at the University of Oxford, and used to pursue different research
ques-tions (see Vicente, 2010; Batista and Vicente, 2011; Batista et al., 2012a).
Its objectives were threefold: analyze changes in perceived corruption in the
public services, in the demand for political accountability, and to relate
de-mographic characteristics with migration. It was based on a representative
sample of resident households (including both non-migrants and return
mi-grants), and also provides information on a large sample of current migrants.
The respondent was an household member aged at least 30 years old who was
asked to specify the socio-demographic characteristics for all the household
members (including migration spells). There were also questions regarding
the economic situation of the household.
2.2.2 Descriptive Statistics
The most relevant variables related with migration and entrepreneurship that
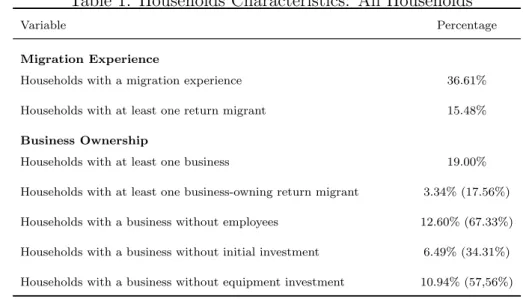
were used will now be described. As it can be seen from table 1, migration
is extremely common in Cape Verde. More than one third of the surveyed
households reported to have a migration experience, which demonstrates how
relevant it is for the country.
The explanatory variable of interest indicates that a significant number
of households have at least one return migrant, 15%. Besides, 3.34% of
the households have both a business and a return migrant, that amounts to
17.56% of the households with a business. In order to disentangle forced/survival
entrepreneurship from formal entrepreneurship, proxies for quality will also
be explored. As it can also be seen in table 1 a high proportion of business
Fur-Table 1: Households Characteristics: All Households
Variable Percentage
Migration Experience
Households with a migration experience 36.61%
Households with at least one return migrant 15.48%
Business Ownership
Households with at least one business 19.00%
Households with at least one business-owning return migrant 3.34% (17.56%)
Households with a business without employees 12.60% (67.33%)
Households with a business without initial investment 6.49% (34.31%)
Households with a business without equipment investment 10.94% (57,56%) Source: Own survey.
In parenthesis the percentage among households that own a business.
thermore, a significant number neither made no investment at all to start the
business, neither invested in machinery or equipment. As being considered
forced entrepreneurs, it will be assumed that they have no distinguishable
business skills from the rest of the non-entrepreneurs. Consequently, the
variables concerning employment and investment will assume the value of 0
both for the forced entrepreneurs as well as for the non-entrepreneurs.
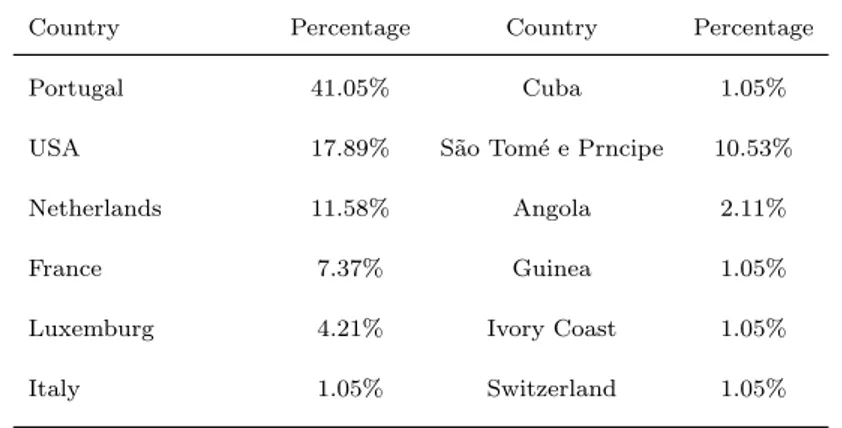
Table 2 shows the main destinations where returnees were. It is possible
to see that most of the households with returnees, 41.05%, experienced going
to Portugal, followed by 17.89% coming from the US.
In addition, by comparing averages between the households with returnees
and the households without, it is possible to confirm some pronounced
dif-ferences. As reported in table 3, the maximum education achieved by a
Table 2: Destination Countries: HH with Return Migrants
Country Percentage Country Percentage
Portugal 41.05% Cuba 1.05%
USA 17.89% S˜ao Tom´e e Prncipe 10.53%
Netherlands 11.58% Angola 2.11%
France 7.37% Guinea 1.05%
Luxemburg 4.21% Ivory Coast 1.05%
Italy 1.05% Switzerland 1.05%
Source: Own survey.
Table 3: Years of Education, Age and Business, Mean Values
(1) (2) (1-2)
HH with returnee HH with no returnee Diff
Maximum years of education 11.26 9.71 1.55∗∗∗
(0.31) Household head age 59.02 44.83 14.19∗∗∗
(0.86) Business ownership 0.22 0.16 0.06∗∗
(0.02) Employment creation 0.10 0.06 0.04∗∗
(0.02) Initial investment 0.15 0.12 0.03
(0.02) Equipment investment 0.11 0.08 0.03
(0.02)
Source: Own survey.
Standard errors in parenthesis∗p <0.10,∗∗ p <0.05,∗∗∗ p <0.01
the household head, are higher than in a household with no returnees. These
differences are statistically significant at 1% level. Furthermore, with a
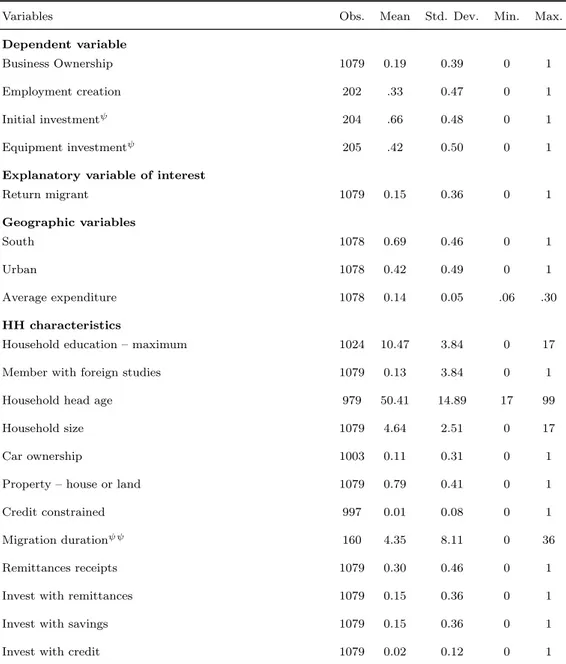
Table 4: Summary Statistics, All Households
Variables Obs. Mean Std. Dev. Min. Max.
Dependent variable
Business Ownership 1079 0.19 0.39 0 1
Employment creation 202 .33 0.47 0 1
Initial investmentψ 204 .66 0.48 0 1
Equipment investmentψ 205 .42 0.50 0 1
Explanatory variable of interest
Return migrant 1079 0.15 0.36 0 1
Geographic variables
South 1078 0.69 0.46 0 1
Urban 1078 0.42 0.49 0 1
Average expenditure 1078 0.14 0.05 .06 .30
HH characteristics
Household education – maximum 1024 10.47 3.84 0 17
Member with foreign studies 1079 0.13 3.84 0 1
Household head age 979 50.41 14.89 17 99
Household size 1079 4.64 2.51 0 17
Car ownership 1003 0.11 0.31 0 1
Property – house or land 1079 0.79 0.41 0 1
Credit constrained 997 0.01 0.08 0 1
Migration durationψ ψ 160 4.35 8.11 0 36
Remittances receipts 1079 0.30 0.46 0 1
Invest with remittances 1079 0.15 0.36 0 1
Invest with savings 1079 0.15 0.36 0 1
Invest with credit 1079 0.02 0.12 0 1 Source: Own survey.
more employment opportunities. Regarding their investment decisions,
de-spite presenting higher levels of investment, the difference is not statistically
different from 0. However, it is worth noting that the hypothesis that
house-holds with no returnees present higher levels of investments is rejected at
10% level for both types.
Finally, the main variables are summarized in table 4. It is possible to
see that most of the surveyed households live in southern islands (79%) and
predominantly in rural areas (58%). Educational attainment is clearly rather
low. The average years of education of the individual with the highest level
of schooling in a given household is merely of 3.84 years, even with 13% of
the households reporting to have a member with foreign studies.
Moreover, also of importance is the fact that 30% acknowledged to have
received remittances. This high proportion contributes to highlight the
rele-vance of migration in Cape Verde. Within those who returned from abroad,
the average duration of their experience was of 4.35 years.
The last three variables of table 4 aim at controlling for different sources
of finance that might be used to set-up a business. Different origins of capital
may have heterogeneous impacts on the effectiveness of the establishment or
performance of a firm. As such, 15% of the households revealed to have used
savings or remittances as source of finance, while only 2% made use of credit.
2.3
Results
This section will present the estimation results of the empirical model. One
will first examine the main variables of interest in each specification and
Table 5: Probability of Owning a Business, OLS and IV Estimates
(1) (2) (3)
OLS 1st
stage 2SLS 2nd
stage 2SLS
Return migrant 0.022 0.368∗∗∗
(0.017) (0.118)
Migration duration -0.001 0.029∗∗∗ -0.012∗∗
(0.002) (0.005) (0.005) Remittances received -0.023∗ 0.054∗∗ -0.044∗∗∗
(0.013) (0.024) (0.016) Household max. educ 0.002 -0.005∗ 0.003
(0.002) (0.003) (0.002) Household head age 0.001 0.005∗∗∗ -0.001
(0.000) (0.001) (0.001) Foreign studies 0.043 0.709∗∗∗ -0.201
(0.090) (0.072) (0.134) Household size -0.004 -0.001 -0.003
(0.004) (0.003) (0.004) Car ownership 0.061∗ 0.089∗∗ 0.032
(0.032) (0.035) (0.027)
Property -0.007 0.008 -0.010
(0.023) (0.024) (0.025) Credit constrained 0.100 -0.068∗∗ 0.118
(0.117) (0.032) (0.120)
South 0.048∗∗∗ -0.002 0.046∗∗
(0.017) (0.023) (0.018)
Urban 0.024 0.024 0.022
(0.025) (0.023) (0.024) Average expenditure -0.195 -0.088 -0.183
(0.240) (0.243) (0.199) Migrantion networks 0.347∗∗∗
(0.059) ER IV - composite 0.252∗∗
(0.104)
Constant 0.005
(0.045)
Observations 942 942 942
Under Ident (P-value) 0.012
Weak Ident (K-P F) 17.324
Hansen J (P-value) 0.901
Robust standard errors in parentheses, clustered at EA level
∗p <0.10,∗∗ p <0.05,∗∗∗p <0.01
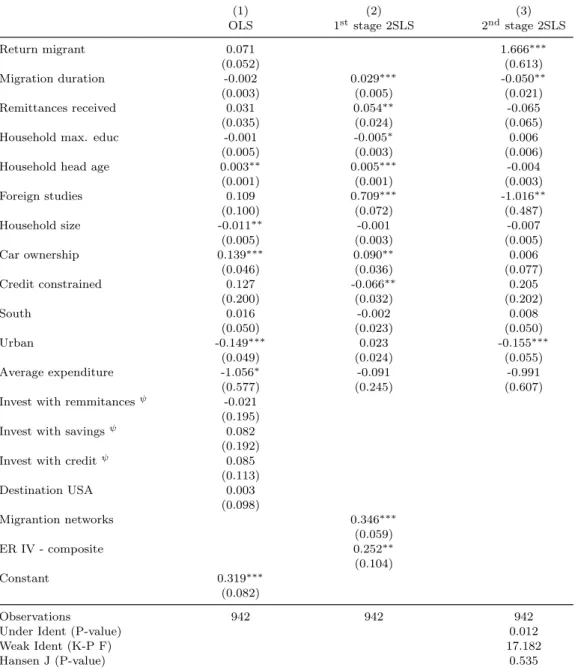
Table 5 reports the results for the probability of business ownership at
the household level. The OLS estimates suggests that having a returnee as a
household member is positively associated with business ownership, however
this relation is not statistically significant. Nevertheless, in the IV
specifica-tion this relaspecifica-tion presents a positive estimate that is significant at 1% level.
Hence, the estimation indicates that having a returnee increases the
probabil-ity of business ownership in 36.8%, all the other factors fixed. Furthermore,
the standard-errors in the OLS are always smaller than in the IV approach.
Therefore, as the estimate is only significant in the latter specification, it
means that the point estimate is substantially higher.
It is also important to analyze the suitability of the chosen instruments.
In the first stage, the estimates for both instruments are positive and highly
significant, meaning that the first condition is likely to be met. In fact, in the
identification test, the null hypothesis (where the equation is
under-identified) is rejected with an associated p-value of 0.012, meaning that the
instruments are relevant when explaining the endogenous variable. Still, if
the instruments are only weakly correlated with the endogenous variable,
then the 2SLS estimation will be biased towards the OLS. To test whether
this is a concern, one computed the Kleibergen-Paap F statistic, which is an
alternative to the Cragg-Donald test for robust or cluster options. The K-P
F statistic of 17.324 is greater than the Stock and Yogo (2005) critical value
of 11.59 for a 15% maximal IV size. Besides, the first stage F is of 27.07 (not
reported), consistent with the rule of thumb F>10. Finally, the Hansen test
for over-identification restriction presents a p-value of 0.901, which does not
Table 6: Probability of Employment Creation, OLS and IV Estimates
(1) (2) (3)
OLS 1st
stage 2SLS 2nd
stage 2SLS
Return migrant 0.026 0.195∗∗
(0.016) (0.092)
Migration duration -0.002∗∗ 0.028∗∗∗ -0.007∗∗
(0.001) (0.006) (0.003) Remittances received -0.003 0.057∗∗ -0.014
(0.008) (0.027) (0.011) Household max. educ 0.002∗ -0.005∗ 0.003∗∗
(0.001) (0.003) (0.001) Household head age 0.000 0.005∗∗∗ -0.001
(0.000) (0.001) (0.001) Foreign studies 0.092 0.724∗∗∗ -0.031
(0.107) (0.074) (0.107) Household size -0.003 -0.002 -0.003
(0.003) (0.003) (0.003) Car ownership 0.047∗∗ 0.084∗∗ 0.034∗∗
(0.017) (0.039) (0.016)
Property -0.010 0.014 -0.012
(0.015) (0.026) (0.015) Credit constrained -0.007 -0.067∗∗ 0.001
(0.007) (0.032) (0.010)
South 0.009 0.003 0.008
(0.011) (0.026) (0.011)
Urban 0.015 0.032 0.014
(0.012) (0.027) (0.011) Average expenditure -0.177 -0.180 -0.162∗
(0.107) (0.291) (0.094) Migrantion networks 0.406∗∗∗
(0.075) ER IV - composite 0.227∗∗
(0.109)
Constant 0.022
(0.027)
Observations 811 811 811
Under Ident (P-value) 0.019
Weak Ident (K-P F) 14.909
Hansen J (P-value) 0.715
Robust standard errors in parentheses, clustered at EA level
∗p <0.10,∗∗ p <0.05,∗∗∗p <0.01
The remaining tables aim at further distinguishing between different types
of entrepreneurs, to study whether return migration influences the quality of
entrepreneurship, namely through job creation and capacity enhancement
via investment.
The results for the probability of employment are shown is table 6. The
OLS specification presents a positive relation between having a returnee in
the household and job creation, which is again not significant. In the 2SLS
specification the sign of the relation is confirmed, this time significant at a 5%
level. Thus, the result suggests that businesses in households with a returnee
are 19.3% more likely to create jobs than in households without returnees.
As for the suitability of the instruments, the results are similar to the
ones in table 5.
The first condition regarding the relevance of the instruments is likely to
be met. Both instruments are individually highly significant when explaining
the endogenous variable and the null hypothesis that the equation is
under-identified is rejected with an associated p-value of 0.019. Moreover, regarding
weak identification, the first stage F is of 20.87 (not reported) and the K-P
F statistic of 14.909 is greater than the Stock and Yogo (2005) critical value
for a 15% maximal IV size. Lastly, the Hansen test for over-identification
restriction presents a p-value of 0.715, not leading to the rejection of the null
hypothesis under which instruments are compatible.
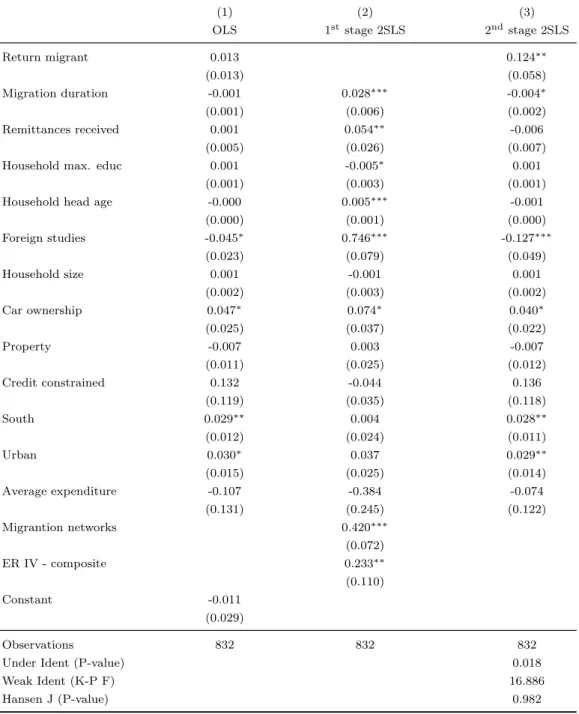
Next, table 7 and table 9 report the estimation outputs for the probability
of initial investment and investment in equipment, respectively. The results
concerning the impact of return migration for these estimations are in line
Table 7: Probability of Initial Investment, OLS and IV Estimates
(1) (2) (3)
OLS 1st
stage 2SLS 2nd
stage 2SLS
Return migrant 0.016 0.193∗
(0.016) (0.101)
Migration duration -0.000 0.029∗∗∗ -0.005
(0.002) (0.006) (0.004) Remittances received -0.011 0.047∗ -0.021∗∗
(0.008) (0.025) (0.010) Household max. educ 0.001 -0.004 0.001
(0.002) (0.003) (0.002) Household head age -0.000 0.005∗∗∗ -0.001∗
(0.000) (0.001) (0.001) Foreign studies -0.064∗∗ 0.741∗∗∗ -0.193∗∗
(0.027) (0.078) (0.078) Household size -0.001 -0.002 -0.001
(0.004) (0.003) (0.004)
Car ownership 0.052 0.083∗∗ 0.039
(0.034) (0.035) (0.031)
Property -0.003 -0.001 -0.003
(0.022) (0.026) (0.022) Credit constrained 0.104 -0.056∗ 0.111
(0.118) (0.032) (0.119)
South 0.049∗∗∗ 0.008 0.046∗∗∗
(0.015) (0.023) (0.016)
Urban 0.042∗ 0.032 0.041∗
(0.022) (0.024) (0.022) Average expenditure -0.201 -0.242 -0.173
(0.203) (0.271) (0.201) Migrantion networks 0.375∗∗∗
(0.061) ER IV - composite 0.221∗∗
(0.106)
Constant 0.016
(0.047)
Observations 875 875 875
Under Ident (P-value) 0.011
Weak Ident (K-P F) 18.926
Hansen J (P-value) 0.311
Robust standard errors in parentheses, clustered at EA level
∗p <0.10,∗∗ p <0.05,∗∗∗p <0.01
Table 8: Probability of Equipment Investment, OLS and IV Estimates
(1) (2) (3)
OLS 1st
stage 2SLS 2nd
stage 2SLS
Return migrant 0.013 0.124∗∗
(0.013) (0.058)
Migration duration -0.001 0.028∗∗∗ -0.004∗
(0.001) (0.006) (0.002) Remittances received 0.001 0.054∗∗ -0.006
(0.005) (0.026) (0.007) Household max. educ 0.001 -0.005∗ 0.001
(0.001) (0.003) (0.001) Household head age -0.000 0.005∗∗∗ -0.001
(0.000) (0.001) (0.000) Foreign studies -0.045∗ 0.746∗∗∗ -0.127∗∗∗
(0.023) (0.079) (0.049)
Household size 0.001 -0.001 0.001
(0.002) (0.003) (0.002) Car ownership 0.047∗ 0.074∗ 0.040∗
(0.025) (0.037) (0.022)
Property -0.007 0.003 -0.007
(0.011) (0.025) (0.012) Credit constrained 0.132 -0.044 0.136
(0.119) (0.035) (0.118)
South 0.029∗∗ 0.004 0.028∗∗
(0.012) (0.024) (0.011)
Urban 0.030∗ 0.037 0.029∗∗
(0.015) (0.025) (0.014) Average expenditure -0.107 -0.384 -0.074
(0.131) (0.245) (0.122) Migrantion networks 0.420∗∗∗
(0.072) ER IV - composite 0.233∗∗
(0.110) Constant -0.011
(0.029)
Observations 832 832 832
Under Ident (P-value) 0.018
Weak Ident (K-P F) 16.886
Hansen J (P-value) 0.982
Robust standard errors in parentheses, clustered at EA level
∗p <0.10,∗∗ p <0.05,∗∗∗p <0.01
For both dependent variables the OLS estimates of return migration are
also positive but not statistically significant. The 2SLS specification suggests
that return migration impact positively both initial investment and
invest-ment in equipinvest-ment, the latter being significant at 5% level, while the former
only at 10%. In result, it is estimated that return migration increases the
probability of incurring in an initial investment in 19.3%, and of investing in
equipment in 12.4%.
The tests for the suitability of the instruments are in every terms in line
with the previous analyzes, providing evidences for their appropriateness. In
both estimations the instruments are individually highly significant in the
first stage, with under-identification being rejected at 0.011 and 0.018 level.
The first stage F statistics are of 18.74 and 20.36 (not reported), while the
K-P F statistics are of 18.926 and 16.886. Therefore, it is suggested that
the instruments are relevant and not weakly correlated with the endogenous
variable. Besides, both Hansen tests do not reject the null hypothesis where
instruments are compatible, presenting the p-values of 0.311 and 0.982.
In addition, there are other interesting findings in the 2SLS specification
one will now explore. First, residing in the south is positively related with
most of the dependent variables. This is not surprising as the southern
regions of Cape Verde are economically more active. For example, household
residing at the south are 4.6% more likely to own a business and to invest
in it than households living in the north, other factors hold fixed. With the
same reasoning, residing in urban areas also tends to be positively related
with the business skills variables.
related with business ownership and with incurring in an initial investment,
with statistically significant estimates at 1% and 5% level. It is also
neg-atively related with the other dependent variables but without statistical
significance. Likewise, it is also curious to see that the variable denoting
that an household is credit constrained does not seem to be relevant in any
specification, neither property ownership.
In regard to the effects of schooling, these appear to be contradictory.
While the maximum education level is positively related with all dependent
variables and highly significant in explaining job creation, having a member
with foreign studies has a negative impact, highly significant to explain both
types of investment.
Another interesting result is the relation between migration duration and
all the dependent variables. It is clear that the explored business skills
vari-ables are associated with shorter periods abroad. Unambiguously, migration
duration is negatively related with all the dependent variables, and except
for the probability of initial investment all the other specifications present
statistically significant results.
Lastly, a final variable showing relevance under some specification is car
ownership. Households possessing a car are 3.4% more likely to be job
cre-ators than households without, all other factors fixed. This result is
signifi-cant at 5% level. Besides, at 10% significance level, car owners are also 4%
more likely to invest in equipment.
To complement this analysis, a panoply of dependent variables were tested
in order to assess other possible channels through which return migration may
and asset ownership. From the variables that were tested only one has shown
to be explained by return migration with a statistically significant result.
Using the same set of instruments, return migration has impacted positively
the ownership of land, which is comprised in the property ownership variable
from the previous analysis. This complementary result is shown in appendix
2. In this case the estimate is larger than 1, which is one of the shortcomings
from not using ivprobit. Still, the result of interest for this analysis was
mainly the sign of the effect.
In all specifications that were used, additional control variables addressing
the source of finance and migration destination were partialled out.
Other-wise, due to being dummy variables mostly with zeros, the estimated
covari-ance matrix of moment conditions was not of full rank, so over-identification
statistics were not reported, and standard errors as well as model tests were
less conservative. Additionally, the computed standard errors are robust and
were clustered by EA in order to account for some potential correlation at
regional level. As such, the presented results are more conservative. Finally,
the reason for the different number of observations is due to two reasons.
First, two types of observations had to be dropped in order to use the second
instrument. The cases where the household head is younger than 35, and
the households where the head is too old, such that there is no available
ex-change rates data for the year when he or she turned 35. Second, the different
dependent variables have diverse missing values with different conjugations
3
Final Remarks
In this section one will interpret the results presented in section 2.3,
ex-plaining how they relate with the current literature of the effects of return
migration on entrepreneurship. Besides, a few direct consequences will be
de-rived from the findings of this research, and possible policy recommendations
will be proposed.
3.1
Discussion
One interesting factor to study within the used framework is the sign of the
self-selection. As it was explained in section 2.1.1 the self-selection may be
positive in the case where individuals who are, for example, more risk-takers
and ambitious have higher odds of both migrating and opening a business.
It may also be negative if individuals who are, as an example, less able have
more difficulties to find a job, so in answer to that they migrate and/or open
a business. In this research, the confidence interval for the OLS estimates
of the probability of being an entrepreneur are significantly lower than the
2SLS’s. This suggests that a negative self-selection is taking place, which
is the same finding as in Batista et al. (2012b). However, in this case, the
OLS estimates are not statistically significant, which makes the analysis of
the self-selection less reliable.
In general, the technique and variables explored in this research suggest
that a migration experience influences, in fact, the decision to become an
en-trepreneur back home, as well as the quality of enen-trepreneurship. Therefore,
are in the same line of the previous literature that use different methods as
Wahba and Zenou (2009). In the case of Batista et al. (2012b) that also
fo-cused on controlling for outward and inward migration selection, the authors
find that having a return migrant in the household results in a 25% – 27%
higher probability of owning a business. In this analysis the same estimate
is of 36.8%. The latter is only somewhat higher, so the findings are pointing
in the same direction. Potential differences may accrue to Cape Verde’s
id-iosyncrasies as well as to the fact that, in opposition to this research, Batista
et al. (2012b) tells a predominantly south-south migration story.
Regarding the quality of entrepreneurship, despite using different
meth-ods and exploring different variables, the current research is also in line with
the findings of previous studies. In fact, Piracha and Vadean (2010)
con-clude that returnees are more likely to be formal entrepreneurs than forced,
De Vreyer et al. (2010) find business owning returnees to generate more
added-value, and Marchetta (2012) that their businesses last longer.
Like-wise, this analysis suggests that return migration influences positively the
odds of generating more employment and investment in initial capital and
equipment, thus making a stronger contribution to the economy.
As mention in section 2.3, the effects of schooling are somewhat
contra-dictory. While the maximum education level tends to have a positive impact,
having a member with foreign studies appears to have the opposite effect.
Notwithstanding, as in Cape Verde foreign studies are more likely to be
re-lated with university education, this finding may be pointing to the fact that
superior education is not a critical factor for opening a business. With this
paying jobs in public administration or other institutions. Indeed, as claimed
in Le (1999), the skills that make entrepreneurs successful are unlikely to be
the same as those embodied in high levels of formal qualifications. Besides,
at the margin, education increases the value of paid employment, which can
make entrepreneurship relatively less attractive to the highly educated.
Finally, it is also interesting to relate the finding regarding migration
du-ration with previous results. One found that migdu-ration dudu-ration is negatively
related with the explored dependent variables, as it was the case in
Dust-mann and Kirchkamp (2002). Arguably, when conciliated with the objective
of opening a business back home, the migration experience will be shorter,
as the migrant may be highly focused in rapidly acquiring the needed skills,
capital and networks to explore potential opportunities.
3.2
Conclusion
In this research one aimed at contributing to the literature of return
mi-gration, namely its effects on entrepreneurship. An unique data-set from
Cape Verde was explored, which allowed to differentiate forced from formal
entrepreneurs. Besides, an IV approach was used in order to address both
outward and inward self-selection effects present in the migration experience.
Business creation is an important source of employment and capacity for
an economy, as well as of competition and innovation. However, majority
of the entrepreneurs in developing countries are forced into that occupation,
owning businesses which required no investment at all and with no employees.
Despite important for poverty reduction, the predominance of this type of
and make it more difficult to screen the quality of the existing entrepreneurs.
The main results of this study indicate that return migration does indeed
foster business creation, and may be a relevant source of formal entrepreneurs
who may generate more value by creating jobs and investing in scaling their
businesses. Returnees are 36.8% more likely to open a business and have
19.5% more probability of creating employment positions. Besides, the odds
of pursing an initial investment and investing in equipments are, respectively,
19.3% and 12.4% higher. Migration is thus affecting business skills, being an
important contribution to economic development.
A direct implication of these findings concerns the maintenance of
en-trepreneurs. Given the high levels of entrepreneurship in developing
coun-tries, it may be difficult to find the entrepreneurs who are more likely to
con-tribute more to the economy and to provide them support to do so. Therefore
this result is relevant for financial institutions, NGOs and public agencies, in
order to being abler to distinguishing different types of entrepreneurs. For
example, this information may shape the conditions how financial
institu-tions fund entrepreneurs in mutually beneficial ways, as for the same level of
business risk, idiosyncratic hazard is likely to be lower for business owning
returnees. Also, for NGOs of the type of Technoserve, Grassroots or Acumen,
these results may help them to further screen the entrepreneurs they back-up.
These organizations, in opposition to normal microfinance institutions, are
focused in generating the highest possible social value by selectively
choos-ing the most promischoos-ing entrepreneurs, hence they need more information to
perform the initial screening. As for public authorities, it may be interesting
may report and the knowledge they have from foreign regulatory processes
may contribute to further improve regulation back home.
Another line of conclusions is related with migration policy. This
informa-tion should influence how sending countries view migrainforma-tion, as the negative
effects of the skilled individuals drain may be compensated with the future
gain of better entrepreneurs. The contribution should go beyond the level
of how migration is restraint/incentivized, but to further improve or create
structures that provide current migrants with opportunities and conditions to
return. It should also impact how host countries coordinate their reception
policies with developmental actions. The findings of this research suggest
that these countries should give further emphasis to temporary migration
programs as grating temporary work visas, because these are likely to be
mutually beneficial. Furthermore, a special attention and support should be
given to current migrants who wish to return, but face several constraints.
Finally, these findings may additionally impact how donor countries
de-sign their aid policies. One common argument for donation is to compensate
for the drain of brains and of capable individuals in developing countries.
Be-sides remittances and increased human capital of stayers (brain gain effect),
the results of this research show another beneficial outcome that offsets the
short-term loss of skilled individuals. Nevertheless, it is important to take
into account the temporal dimension of the losses and benefits. While the
loss takes place in the short-run, the benefit of having better entrepreneurs
is a long-run gain. As a result, solely from this effect, donation still has a
role in lessening the short-term loss, avoiding the persistent harmful effects
4
Bibliography
Acs, Z. J., Audretsch, D. B., 1990. Innovation and small firms. Mit Press.
Akee, R., 2010. Who leaves? deciphering immigrant self-selection from a
developing country. Economic Development and Cultural Change 58 (2),
323–344.
Arrow, K., 1962. Economic welfare and the allocation of resources for
inven-tion. In: The rate and direction of inventive activity: Economic and social
factors. Nber, pp. 609–626.
Audretsch, D. B., 1995. Innovation and industry evolution. Mit Press.
Banerjee, A., Banerjee, A. V., Duflo, E., 2011. Poor economics: A radical
rethinking of the way to fight global poverty. PublicAffairs.
Batista, C., Lacuesta, A., Vicente, P. C., 2012a. Testing the brain
gainhy-pothesis: Micro evidence from cape verde. Journal of Development
Eco-nomics 97 (1), 32–45.
Batista, C., McIndoe-Calder, T., Vicente, P. C., 2012b. Return migration
and entrepreneurship in mozambique. Trinity College, Dublin.
Batista, C., Umblijs, J., 2013. Migration, risk attitudes, and
entrepreneur-ship: Evidence from a representative immigrant survey. Tech. rep., IZA
Discussion Paper.
Batista, C., Vicente, P. C., 2011. Do migrants improve governance at home?
evidence from a voting experiment. The World Bank Economic Review,
Baumol, W. J., 2004. Entrepreneurial enterprises, large established firms
and other components of the free-market growth machine. Small Business
Economics 23 (1), 9–21.
Baumol, W. J., Litan, R. E., Schramm, C. J., 2007. Good capitalism, bad
capitalism, and the economics of growth and prosperity. Yale University
Press.
Baumol, W. J., Panzar, J. C., Willig, R. D., Bailey, E. E., 1982. Contestable
markets and the theory of industry structure.
Bennett, J., 2010. Informal firms in developing countries: entrepreneurial
stepping stone or consolation prize? Small Business Economics 34 (1),
53–63.
Berner, E., Gomez, G., Knorringa, P., 2012. helping a large number of people
become a little less poor: The logic of survival entrepreneurs. European
Journal of Development Research 24 (3), 382–396.
Boeri, T., Cramer, U., 1992. Employment growth, incumbents and entrants:
evidence from germany. International Journal of Industrial Organization
10 (4), 545–565.
Borjas, G. J., 1986. The self-employment experience of immigrants.
Carreira, A., Fyfe, C., 1982. The people of the Cape Verde Islands:
exploita-tion and emigraexploita-tion. London England C. Hurst 1982.
Country-Watch, 2013. Cape verde country overview.