UNIVERSITE CATHOLIQUE DE LOUVAIN LOUVAIN SCHOOL OF MANAGEMENT
and
NOVA SCHOOL OF BUSINESS AND ECONOMICS
FAIR VALUE MEASUREMENT: IS THE DEBATE AROUND LEVEL
II AND LEVEL III ASSETS AND LIABILITIES RELEVANT?
Supervisor at LSM: Prof. Bruno COLMANT Supervisor at NOVA SBE: Prof. Ana MARQUES
Research Master’s Thesis
Submitted by Régine MEYERS - #794
With a view of getting the degrees of
Master in Finance Master in Business Engineering
Abstract
In this Work Project, I evaluate the relevance of the debate around fair value’s Level II and Level III assets and liabilities. The literature outlines some qualitative shortcomings of this valuation technique. However, it seems important to understand how those assets and liabilities affect the balance sheet from a quantitative point of view. The data collected indicate that 10% of the balance sheets of Standard & Poor’s 500 companies is evaluated using fair value measurement. My analysis reveals that the market prices are positively associated with fair value. It shows they are highly and positively sensible to Level III assets, suggesting that shortcomings outlined in the literature concerning the poor reliance in those inputs are not translated in the market behavior. The market even reacts in the opposite way as it approves the use of Level III inputs.
I. Introduction
The Valuation Research Corporation performed a survey in 2009 revealing that 58% of financial professionals believe the recent market crisis has negated fair value's validity. Fair value measurement has been a concern for both the Financial Accounting Standards Board (FASB) and the International Accounting Standards Board (IASB) in recent years. The FASB published new regulation regarding those measurements in 2006, followed by the IASB in 2011. Those regulations have improved the concept of a three-level hierarchy to value assets and liabilities: when reporting an asset or a liability using fair value measurement, a company should use the best available market information. If possible, the company should use a Level I input which is the market price of the asset. When this information is not available, it should use Level II inputs, corresponding to proxies of the asset or liability. In case of illiquid market, the company should use Level III inputs that are models developed to value the asset or the liability.
Many analysts believe fair value, and especially Level II and Level III assets measurement, have shown some limitations during the recent market crisis. Those criticisms are based on qualitative shortcomings of fair value. However, there are some unanswered questions, such as: are those criticisms relevant in practice? Are Level II and Level III assets significant in balance sheets of companies? In which proportion are those assets used, when compared to total fair value measurement? How does the market react to the use of fair value in the balance sheet of companies?
and liabilities. The initial sample consists of the Standard & Poor’s 500 (S&P 500) companies, as defined on the 31st December 2013. Some of the S&P500 companies do not disclose fair value in their annual report, without any specific reasons. That way, the final sample includes 434 companies.
To determine whether the criticisms in the literature around Level II and Level III assets and liabilities are justified, I perform an analysis in two parts: first, I establish a ratio analysis in order to determine in which proportion fair value is used in the balance sheet and what proportion Level II and Level III represent within fair value measurement. Second, I run a regression based on the Ohlson model (Ohlson, 1995) to assess the impact that each level of fair value has on the share price. To do so, I determine 5 variables: NONFV, corresponding to the value of assets, minus the value of liabilities and minus fair value measurement; LEVEL I, LEVEL II and LEVEL III variables, representing assets and liabilities measured at fair value using respectively Level I, Level II and Level III inputs and finally EPS. Those variables are scaled on a per share basis to keep consistency.
To validate criticisms found in the literature, I expect from this ratio analysis a high proportion of fair value measurement and especially of Level II and Level III assets and liabilities in the balance sheet. From my model, I also expect for variables LEVEL I, LEVEL II and LEVEL III to have a negative effect on the share price in order to outline that the market punishes the use of fair value.
estimation of my model show the share price is positively influenced by all the variables and especially by the LEVEL III and EPS variables. For an increase of $1 of LEVEL III, the share price should increase three times more. This increase is even greater for EPS, which has an impact of 6x on the share price.
The research performed in this Work Project might be the proof that the market does not punish fair value. The reason for the gap that exists between the literature and the quantitative analysis might be the fact that companies which suffered from misvaluations of fair value (Herring, 2011) during the crisis have improved and strengthened their models. That way, valuation techniques might have become more reliable, which has already been perceived by the market.
II. Literature review
In 2006, the Financial Accounting Standards Board (FASB) published a new statement concerning fair value measurement, named FASB Concept N°157, Fair Value Measurements. In 2011, the International Accounting Standards Board (IASB) issued very
similar guidelines on the same topic in IFRS 13, Fair Value Measurements. After the financial crisis of 2008, the principle of fair value, as defined in those statements, was highly challenged by many investors, regulators and financial professionals for many reasons (Anonymous, 2009, Enahoro and Jayeoba, 2013, Herring, 2011).
the exit price of an asset or a liability (FASB, 2006, IASB, 2011). This definition translates an incentive to evaluate assets and liabilities based on their market price, from a market perspective, and not based on their historical price (Power, 2010).
To determine the value of an asset or a liability, both FASB and IASB separate fair value inputs in a three-level hierarchy, depending on available market information. Level I inputs are used when a quoted price in observable and active market can be found for an identical asset or liability. When it is impossible to determine a price for an identical asset or a liability due to an illiquid market or a small number of transactions of this asset or liability, Level II inputs are required. It uses other inputs in observable market than quoted prices for an identical asset or liability, such as similar assets’ market prices. If an asset or a liability is sold in an unobservable and inactive market, its value is determined with Level III inputs: models that use the best information available, including all risks related to the asset or liability.
Supervision, 2008). That way, the valuation is often incorrect. Many reasons for this misvaluation were found in the literature, as discussed next.
First, companies are not prepared to value financial instruments with mark-to-model techniques. They use proxies that are not always accurate, such as primary market prices, generic credit spreads based on ratings or prices for similar transactions (Basel Committee on Banking Supervision, 2008). Second, in the last century, very complex products were developed. Those products turned out to be difficult to value accurately (Vinals, 2008). This has been the case with structured obligations (Basel Committee on Banking Supervision, 2008) or with products such as convertible callable bonds, for which banks cannot determine which component should be evaluate first - the callable or the convertible feature of the bond (Landsman, 2007).
Determining all the risks related to a product is very challenging, especially when a firm is not prepared to deal with illiquid markets, as seen in the recent market stress. Bankers tend to focus mainly on credit risk and forget to embed all market risks (Basel Committee on Banking Supervision, 2008, Vinals, 2008). Even when products are well understood, another issue occurs: the model used to value the asset or liability appears to be very complex and therefore difficult to implement (Cascini and DelFavero, 2011, Ferguson, 2008, Landsman, 2007). Another dimension is that financial instruments are often interdependent; this makes the valuation of products, in case of illiquid markets, almost unworkable (Landsman, 2007).
the company (Landsman, 2007). However, it is often said that managers have too many incentives to become dishonest regarding the value of particular assets or liabilities, which can lead to moral hazard problems (Herring, 2011, Laux and Leuz, 2009). As managers are often rewarded based on future estimations or previous results, they could be tempted to overstate the value of assets and to manipulate information for personal purpose (Barbera and Fornaro, 2007, Ferguson, 2008, Penman, 2007). This behavior could lead to in less reliable and subjective valuations (Chea, 2011). Another concern is that those misvaluations could result in an adverse selection process. Given those incorrect valuations, an investor might have the impression that two products are equivalent, while one is better than the other, and therefore, the investor could make a different choice than the one he would have made knowing the true value of both products (Emerson et al., 2010, Landsman, 2007, Prochazka, 2011). To emphasize this aspect, some outline the difficulty for auditors to verify models and assumptions provided by managers (Barbera and Fornaro, 2007, Ferguson, 2007, Martin et al., 2006), as models become very complex (Chea, 2011).
Even assuming that managers are honest, these tend to be too optimistic concerning the future of their company (Kolev, 2009, Penman, 2007) and measurement errors are not avoidable (Barbera and Fornaro, 2007, Penman, 2007, Prochazka, 2011). This results in inappropriate valuations, increases the volatility in financial statements and affects the information provided to investors (Landsman, 2007).
investors to understand the mechanism used to valuate Level II and Level III assets. It is also necessary to set limits to the power given to management in order to improve the information and reduce the incentives they may have to manipulate the data (Landsman, 2007, Laux and Leuz, 2009).
This debate leads to the following questions: how important are Level II and Level III assets, when compared to the total value of an enterprise? Is it relevant to question fair value based on the argument that Level II and Level III assets might reduce the quality of information due to misvaluations? A survey from the SEC (2008) revealed that the banking industry evaluates less than 50% of assets at fair value. How much of those assets are valued using Level II and Level III inputs? In this Work Project, I try to answer these questions. Additionally, I analyze how capital markets incorporate the values of Level II and Level III assets in their valuation of firms’ stock.
III. Methodology
The objective of this Work Project is to define whether the criticism around fair value accounting and, in particular, Level II and Level III assets is relevant. To answer this question, I use two methods: (i) a ratio analysis of fair value assets and liabilities; (ii) a regression analysis to test how the market prices firms’ Level II and Level III assets and liabilities.
Ratio analysis
sheet, I need to hand collect it directly from the notes of the published financial statements, in annual reports.
With collected data, I calculate the following ratios:
(1) Fair Value to Balance Sheet ratio: !
!
Total Fair Value Assets and Liabilities!
Total Assets and Liabilities! !
!!! ;
(2) Level II and III to Balance Sheet ratio: !
!
Total Level II andLevel III Assets and Liabilities! Total Assets and Liabilities! !
!!! ;
(3) Level II and III to Fair Value ratio: ! !
Total Level II and Level III Assets and Liabilities!
Total Fair Value Assets and Liabilities!
!
!!! ;
(4) Level III to Fair Value ratio: ! !
Total Level III Assets and Liabilities!
Total Fair Value Assets and Liabilities! !
!!! . ∀ 𝑖=1,…,𝑁.
These ratios aim at measuring the weight of fair value measurement on the balance sheet and determining whether the Level II and Level III assets and liabilities represent a large share of the values on both the total assets and liabilities and the total fair value measurement. More precisely, Fair Value to Balance Sheet ratio evaluates the impact of fair value accounting on the total assets and liabilities; Level II and III to Balance Sheet ratio measures the effect Level II and Level III assets and liabilities have on the total assets and liabilities. I complete this information with details about the proportion of Level II and Level III assets and liabilities in the total fair value measurement (ratios 3 and 4). Even if results reveal a low value of ratio 2 (Level II and III to Balance Sheet), criticism would still be relevant in the cases where high values are found for the Level II and III to Fair Value ratio and Level III to Fair Value ratio.
mean and median. That way, the objective is to understand whether the industries have an impact on fair value measurement.
Regression
In the second part of my Work Project, I create a multivariate model in order to assess the way capital markets price the use of Level II and Level III assets and liabilities valuation. This model is based on Ohlson (Ohlson, 1995, Ohlson and Feltham, 1995), as this author specifies the market value of a firm depends on its book value of equity and on its earnings given that these substitute for future dividends, according to the clean surplus equation. On a stock price basis, it depends on book value of equity per share, or assets minus liabilities per share and on earnings-per-share. To perform my analysis, I adapt this model by incorporating fair value measurement, as follows:
(1) Share price = α + βNONFV + γ1LEVEL I + γ2LEVEL II + γ3LEVEL III + δEPS In this model, the variable NONFV is calculated by adding assets, subtracting
be consistent with the literature, I could expect LEVEL II and LEVEL III variables to be smaller than 1 in order to reflect the fact that the market does not rely on those valuation techniques. This could also be reflected in the parameters: γ1>γ2>γ3. Finally, EPS, which reflects the future dividends, should have a much larger value than the other parameters as it expresses the net income available for shareholders in the future. Comparing the values of the different gammas allows me to determine how capital markets price the use of each level of those assets and liabilities measured at fair value in their valuation of firms’ prices. In order to assess the impact fair value measurement can have on the share price of a company, I use share prices and earnings-per-shares of each company three months after the closing date of their financial report. This delay represents the time required to publish financial statements and, afterwards, to affect share prices and earnings-per-shares.
To incorporate fair value measurement in this regression, I have to adapt the Ohlson model. However, it is not clear how this adaptation affects the model. That way, I compare the results of my multivariate model with the ones of two other regressions: a regression following the Ohlson model and a regression without incorporating the EPS variable. Those two comparisons challenge the robustness of my model, as it has already been done in previous papers using Ohlson model (Spilioti, 2010).
liabilities. Therefore, fair value of assets and liabilities are summed instead of substracted, which leads to a minor approximation in this regression.
IV. Sample
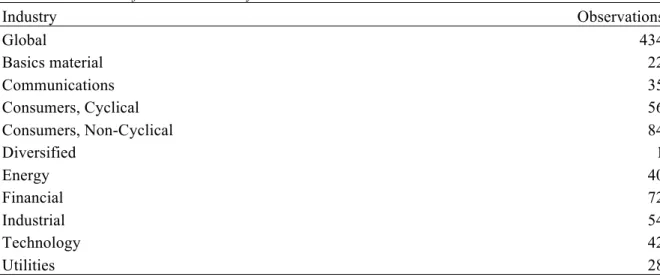
I concentrate my study on S&P500 companies listed on the 31st of December 2013, as the FASB set up regulation concerning fair value measurement earlier than the IASB. For each S&P 500 company, I read fair value disclosures in published 10-K form or annual report in 2012, as 2013's 10-K forms are not published yet when I begin to collect data. I collect the following information: I select the value of assets and liabilities that are measured at fair value on a recurring basis, as well as the total assets value for each company. From Bloomberg, I collect the companies' industry (Basics Materials, Communications, Consumers Cyclical, Consumers Non Cyclical, Energy, Financial, Industrial, Technology, Utilities).
the diversified industry is meaningless, I decide not to take it into account in the following analysis. Furthermore, the value of earnings-per-share is not available for three companies. This leaves the final sample of the regression with 430 companies, as in Panel C of Table 1.
V. Results
This section is divided in two parts: (i) the ratio analysis; (ii) the regression analysis. These analyses are complementary: while the ratio analysis is focused on specific items of the balance sheet and does not control for other variables, the regression analysis studies the association between our variables of interest and stock prices; considering other relevant relations allowing me to understand the overall dynamic of share prices.
Ratio analysis
The values of the four ratios defined above are presented in Table 2.
balance sheet of the financial industry comes from a high level of financial instruments in this industry (Nissim and Penman, 2007), due to their business. In the technological industry, licenses and patents appear to be a significant part of fair value measurement (KPMG, 2010). The median of this ratio reveals that half of the S&P companies disclose less than 4.29% of their assets and liabilities using fair value. Once again, the financial and technological industries have higher values, with half of the companies in these industries disclosing respectively more than 15.8% and 16.87% of their assets and liabilities using fair value.
The Level II and III to Balance Sheet ratio shows S&P500 companies incorporate 7.01%, of total assets and liabilities using Level II and Level III assets and liabilities valuation (Panel B of Table 2). The financial and technological industries have higher values with, respectively, 16.2% and 11.68%, which is consistent with the Fair Value to Balance Sheet ratio's results. It shows those industries disclose a significant percentage of their assets and liabilities using fair value measurement. Once again, this is mainly due to their activities, as mentioned in previous paragraph. The median of this ratio shows that half of S&P 500 companies only disclose 1.68% of their balance sheet using Level II and Level III inputs. Once again, the financial and technological industries present a higher rate of disclosure with a median of, respectively, 10.39% and 9.73%.
reveals however that half of the S&P500 companies disclose more than 71.4% of fair value using Level II and Level III inputs, increasing to 87.95% for the financial industry. The means and medians of this ratio indicate that fair value measurement depends mostly on Level II and Level III inputs. Thus, concerns about subjectivity in these levels are warranted, as they may impact the value of the firms.
The Level III to Fair Value ratio, analyzing the proportion of Level III assets and liabilities in total fair value measurement, reveals that only 8.31% of fair value measurement require Level III inputs (Panel D of Table 2). This ratio tends to be larger for the consumers non-cyclical industry (12.71%) and much smaller for the technological industry (1.77%), with a p-value for the t-test on mean of 0.00. The median of this ratio outlines that half of the companies disclose less than 0.31% of fair value using Level III inputs. This small disclosure of Level III assets and liabilities in the technological industry reveals that, even though it shows a large Fair Value to Balance Sheet ratio, it is not affected by the criticism around Level II and more particularly Level III assets and liabilities. The fact that the financial industry does not show a large Level III to Fair Value ratio although it presents a high Level II and Level III to Balance sheet ratio also outlines that it discloses the majority of fair value using Level II inputs.
Even if the use of fair value is not homogeneous through the industries as the means and medians of the ratios are very different depending on the industries, Levels inputs used within fair value tend to be constant among industries given the Level II and Level III to fair value ratio. Critics outline that fair value accounting is not relevant and reliable enough due to misvaluations of Level II and more specifically Level III assets and liabilities. From those results, critics should differentiate problems arisen from Level II inputs and problems arisen from Level III inputs as their impacts are of different magnitude on global fair value measurement.
Regression
Results of my multivariate model can be found in Table 3 Panel A: Model A:
Share price = 26.43 + 1.21 NONFV + 1.18 LEVEL I + 1.00 LEVEL II + 3.38 LEVEL III + 6.34 EPS
It is also interesting to test the robustness of this model by performing other regressions: without incorporating the EPS parameter or following the Ohlson model, the regressions present similar results (Table 3, Panel B: Model B, Panel C: Model C) than the original regression, with significant variables. This confirms the results found in my model as each parameter affects positively and significantly the share price with, once again, a greater impact of LEVEL III and EPS.
From those regressions, I can conclude that the market price of a firm is positively influenced by each variable. However, it is important to note that LEVEL III and EPS variables influence much more the stock price. This result has to be confronted with the ratio analysis and the ideas provided by the literature.
V. Conclusion
References
Anonymous. 2009. “FASB Issues Guidance on Fair Value of Financial Assets in Inactive, Distressed Markets.” Valuation Strategies 12 (3): 39-40.
Basel Committee on Banking Supervision. 2008. "Fair value measurement and modeling: An assessment of challenges and lessons learned from the market stress."
Cascini, Karen T., and Alan DelFavero. 2011. “An Evaluation Of The Implementation Of Fair Value Accounting: Impact On Financial Reporting.” Journal of Business & Economics Research 9 (1).
Chea, Ashford. 2011. “Fair Value Accounting: Its Impacts on Financial Reporting and How It Can Be Enhanced to Provide More Clarity and Reliability of Information for Users of Financial Statements.” International Journal of Business and Social Science 2 (20): 12–19. Dechow, Patricia. M., Amy P. Hutton, and Richard G. Sloan. 1999. “An empirical
assessment of the residual income valuation model.” Journal of Accounting and Economics 26: 1-34.
Emerson, David J., Khondkar E. Karim, and Robert W. Rutledge. 2010. “Fair Value
Accounting: A Historical Review of the Most Controversial Accounting Issue in Decades.” Journal of Business & Economics Research (JBER) 8 (4).
Enahoro, John A. 2013. “Value Measurement and Disclosures in Fair Value Accounting.” Asian Economic and Financial Review 3 (9): 1170–79.
Financial Accounting Standards Board. 2006. Statement of Financial Accounting Standards No. 157, Fair Value Measurements.
Fornaro, James M., Anthony T. Barbera. 2007. "The New Fair Value Hierarchy: Key Provisions, Implications, and Effect on Information Usefulness." Review of Business 28 (1). Herring, Richard J. 2011. “Fair Value Accounting, Disclosure and Financial Stability: Does How We Keep Score Influence How the Game Is Played?” The Encyclopedia of Financial Globalization, North-Holland Press, Forthcoming.
International Accounting Standards Board. 2011. International Financial Reporting Standard 13, Fair Value Measurement.
Kolev, Kalin. 2009. “Do Investors Perceive Marking-to-Model as Marking-to-Myth?: Early Evidence from FAS 157 Disclosure”. New York University, Graduate School of Business Administration.
KPMG. 2010. “Intangible Assets and Goodwill in the context of Business Combinations: an industry study”.
Landsman, Wayne R. 2007. “Is Fair Value Accounting Information Relevant and Reliable? Evidence from Capital Market Research.” Accounting and Business Research 37 (sup1): 19–30.
Martin, Roger D., Jay S. Rich, and T. Jeffrey Wilks. 2006. “Auditing Fair Value
Measurements: A Synthesis of Relevant Research.” Accounting Horizons 20 (3): 287–303. Nissim, Doron, and Stephen H. Penman. 2007. “Fair Value Accounting ine the Banking Industry.” Center for Excellence in Accounting and Security Analysis. Occasional Paper Series.
Ohlson, James. 1995. “Earnings, Book Values, and Dividends in Equity Valuation.” Contemporary Accounting Research 11 (2): 661-687.
Ohlson, James, and Gerald A. Feltham. 1995. “Valuation and clean surplus accounting for operating and financial activities.” Contemporary Accounting Research 11 (2): 689-731. Penman, Stephen H. 2007. “Financial Reporting Quality: Is Fair Value a plus or a Minus?” Accounting and Business Research 37 (sup1): 33–44.
Power, Michael. 2010. “Fair Value Accounting, Financial Economics and the
Transformation of Reliability.” Accounting and Business Research 40 (3): 197–210. Procházka, David. 2011. “The Role of Fair Value Measurement in the Recent Financial Crunch.” Economics, Management, and Financial Markets (1): 989–1001.
Securities and Exchange Commission. 2008. “Report and recommendations pursuant to section 133 of the Emergency Economic Stabilization Act of 2008: Study on Mark-to-market accounting.” Office Of The Chief Accountant, Division of Corporation Finance. Spilioti, Stella N. 2010. “The incorporation of risk into the clean-surplus valuation model: evidence from UK stocks.” Investment Management and Financial Innovations 7 (3): 82-90. Valuation Reseaercher. 2009. “Survey Finds Perceptions of Fair Value Hit Hard by
Financial Crisis.”
Table 1: Sample
Panel A: Sample
Companies disclosing Fair Value Measurement 434
Companies not disclosing Fair Value Measurement 66
Total 500
Panel B: Industries for the ratio analysis
Industry Observations
Global 434
Basics material 22
Communications 35
Consumers, Cyclical 56
Consumers, Non-Cyclical 84
Diversified 1
Energy 40
Financial 72
Industrial 54
Technology 42
Utilities 28
Panel C: Industries for the regression
Industry Observations
Global 430
Basics material 22
Communications 34
Consumers, Cyclical 56
Consumers, Non-Cyclical 83
Energy 40
Financial 71
Industrial 54
Technology 42
Table 2:
Ratio analysis of Fair Value Accounting in S&P500 companies' balance sheet
Panel A: Fair Value on Total Balance Sheet ratio
Industry Mean
P-values of T-Test on
Mean Median
P-values of Moody's Test on Median Standard Deviation
Global 10,08% N/A 4,29% N/A 13,65%
Basics material 5,61% 0,61% 2,79% 11,93% 6,43%
Communications 10,24% 93,20% 6,70% 9,44% 10,76%
Consumers, Cyclical 4,31% 0,00% 1,85% 0,43% 6,31%
Consumers, Non-Cyclical 9,09% 50,37% 4,65% 9,22% 12,01%
Energy 3,82% 0,00% 1,21% 0,01% 7,37%
Financial 20,60% 0,00% 15,80% 0,01% 0,00%
Industrial 7,56% 27,92% 1,26% 0,43% 16,23%
Technology 17,25% 0,01% 16,87% 0,01% 10,16%
Utilities 3,33% 0,00% 2,35% 1,01% 3,04%
Panel B: Level II and Level III assets on Total Balance Sheet ratio
Industry Mean
P-values of T-Test on
Mean Median
P-values of Moody's Test on Median Standard Deviation
Global 7,01% N/A 1,68% N/A 11,77%
Basics material 3,03% 0,47% 0,26% 1,63% 5,55%
Communications 5,40% 26,80% 1,04% 9,66% 7,86%
Consumers, Cyclical 1,89% 0,00% 0,47% 0,43% 3,55%
Consumers, Non-Cyclical 6,09% 43,73% 2,14% 8,47% 9,58%
Energy 3,08% 0,09% 0,49% 0,40% 6,24%
Financial 16,20% 0,00% 10,39% 0,01% 16,80%
Industrial 6,12% 68,99% 0,64% 0,81% 15,82%
Technology 11,68% 0,44% 9,73% 0,01% 9,48%
Panel C: Level II and Level III on Total Fair Value ratio
Industry Mean
P-values of T-Test on
Mean Median
P-values of Moody's Test on Median Standard Deviation
Global 63,76% N/A 71,40% N/A 33,89%
Basics material 54,12% 28,98% 64,72% 15,73% 41,00%
Communications 49,20% 2,76% 49,49% 4,15% 36,41%
Consumers, Cyclical 57,45% 22,51% 64,28% 5,97% 36,63%
Consumers, Non-Cyclical 68,13% 25,89% 75,74% 8,47% 31,95%
Energy 64,37% 92,07% 80,76% 8,09% 36,60%
Financial 74,11% 0,97% 87,95% 0,08% 30,31%
Industrial 65,69% 70,30% 71,85% 11,46% 35,05%
Technology 61,15% 60,02% 62,89% 3,53% 30,32%
Utilities 63,58% 96,88% 64,00% 7,92% 22,87%
Panel D: Level III on Total Fair Value ratio
Industry Mean
P-values of T-Test on
Mean Median
P-values of Moody's Test on Median Standard Deviation
Global 8,31% N/A 0,31% 17,61%
Basics material 9,37% 77,58% 1,10% 15,73% 16,75%
Communications 8,63% 91,27% 0,00% 6,74% 16,41%
Consumers, Cyclical 6,97% 54,42% 0,00% 0,86% 15,31%
Consumers, Non-Cyclical 12,71% 9,74% 0,79% 6,04% 22,80%
Energy 7,76% 85,94% 0,00% 8,09% 19,01%
Financial 8,15% 93,64% 2,82% 0,01% 15,67%
Industrial 7,27% 72,38% 0,00% 0,01% 20,77%
Technology 1,77% 0,00% 0,00% 3,53% 7,69%
Table 3: Linear Regression
Panel A: Model 1
Coefficients t Stat p-level
Intercept 26,43 6,26 0,00
NONFV 1,21 8,32 0,00
LEVEL I 1,18 8,13 0,00
LEVEL II 1,00 6,76 0,00
LEVEL III 3,38 6,56 0,00
EPS 6,34 2,88 0,00
Regression Statistics
Adjusted R Square 22%
Total Number Of Cases 430
Panel B: Model 2
Coefficients t Stat p-level
Intercept 30,84 7,79 0,00
NONFV 1,28 8,81 0,00
LEVEL I 1,26 8,77 0,00
LEVEL II 1,07 7,24 0,00
LEVEL III 3,42 6,61 0,00
Regression Statistics
Adjusted R Square 21%
Total Number Of Cases 430
Panel C: Model 3
Coefficients t Stat p-level
Intercept 28,03 6,79 0,00
BVE 1,09 8,54 0,00
EPS 5,97 2,65 0,01
Regression Statistics
Adjusted R Square 18%