UNIVERSITE CATHOLIQUE DE LOUVAIN LOUVAIN SCHOOL OF MANAGEMENT
and
NOVA SCHOOL OF BUSINESS AND ECONOMICS
The determinants of Foreign Direct Investments attraction in Portugal and Spain: a comparative analysis.
Supervisor at LSM: Dr. Marcel Gérard
Supervisor at NOVASBE: Dr. Luís Campos e Cunha
Research Master’s Thesis
Submitted by Guillaume Wenseleers (No.1842) With a view of getting the degrees
Master in Management Master in Business Engineering
2
Abstract
This paper analyzed the determinants of the net Foreign Direct Investments
inflows in Portugal and Spain; two countries chosen for their historical and
geographical closeness. The study included a large set of macroeconomic, institutional
and locational variables. The dataset is composed by yearly data points covering the
period 1984-2012. Using regressions in first differences, the paper concluded to the
significance of unit labor costs, openness to trade, political stability and socioeconomic
conditions for Portugal. As for Spain, market size and European Union GDP growth
played a significant role.
Keywords: Foreign Direct Investments; Attractiveness; Portugal; Spain.
Acknowledgments
I would like to express my deepest gratitude to my Thesis advisers, Professors
Luís Campos e Cunha and Marcel Gérard. I am extremely grateful to them for their
valuable guidance and support during this process. I also thank Professor Iliyan
Georgiev for the precious help that he provided me in the econometric part of this
research. Moreover, I am deeply indebted to my family, namely my parents, and friends
for the unceasing encouragement, support and advises during my entire education.
Without them, this accomplishment would not have been possible. Finally, I would like
to thank both NOVA and the LSM for the amazing opportunity they have offered me by
3
I. Introduction
With the more than five-fold increase in the inflows value between 1990 and
2012 (UNCTAD, 2013), Foreign Direct Investments (FDI) have been acknowledged as
one the drivers of the globalization process and a potential growth and development
vector (Zhan, 2006). Because of the capital, knowledge, technology, skills and
employments they bring, those investments became appealing for many governments.
Nevertheless, in order to create positive spillovers for the recipient country, various
authors have stressed out the necessity of a country strategy (Cortes et al., 2013), the
need to have reached a certain level of human capital (Borensztein et al., 1995) or to
have developed correct infrastructures (Gholami et al., 2005). Therefore, the link
between economic growth and FDI is not so obvious anymore. Despite that,
policymakers keep focusing on the attraction of FDI and set up creative measures to do
so.
As a consequence of this focus, numerous researches have been conducted.
Assunção et al. (2011) resumed in their paper three theories on the determinants of FDI
that emerged. The most fundamental is the OLI paradigm formalized by John Dunning
in 1976. According to him, the decision of a firm to undertake a FDI is the result of
three elements: the presence of an ownership advantage (O) of the firm on competitors,
the existence of a location advantage (L) in the foreign country and the advantage the
firm has to internalize its production (I) rather than using an external supplier(Dunning,
2001). The first force refers to the ownership of specialized assets by the investing
company, while the second one concerns the special conditions a firm will benefit from
in the foreign country (Assunção et al., 2011). Secondly, the authors gathered under the
4 of the location advantage: market size, market growth, openness to trade, natural
resources, etc. Finally, a third theory addressed the problem from the angle of
institutions, claiming that institutional quality may be the most influential factor on the
decision of multinationals to invest abroad.
The intensification of globalization has also modified the patterns of FDI. With
the reduction of trade barriers, distances and transportation costs, “vertical” FDI have
gained more importance compared to the “horizontal” ones. The latter, referred as
“market-seeking”, aims to allow a company to access an attractive host market. The
former, more “efficiency-seeking”, has the objective to benefit from lower production
costs, natural resources, strategic assets, etc. The distinction between the two has its
importance since the two types will not respond to the same determinants, as
demonstrated by Neary (2009).
This study aims to identify the main determinants of Foreign Direct Investments
flows in Portugal and Spain over the period 1984-2012. The analysis will investigate a
large set of determinants covering the three theories mentioned above in order to
compare the patterns of FDI in the two countries. With the aim to discover if the
distinction between market- and efficiency-seeking investments applies to these two
countries. To do so, the study will explore macroeconomic factors, institutional
variables and location-specific aspects.
The paper is structured as follows: section II will review the literature on the
subject, section III will explain the data and methodology, section IV will present the
main results and section V will conclude.
5
II. Literature review
Using quarterly and yearly data on the FDI inflows in Brazil and Mexico, de
Castro et al. (2013) showed that a large market is more attractive for foreign investors
since it represents a potential large demand and potential economies of scale. Numerous
authors acknowledged the same attraction effect (Bayraktar, 2013; Jadhav, 2012; Bellak
et al., 2008; Asiedu, 2006; Bevan et al. 2004; Bajo-Rubio et al, 1994). In its
multicountry empirical analysis, Billington (1999) showed that high GDP and growth
were significant to attract FDI. Walsh and Yu (2010), in their sectoral approach of
determinants, also concluded to the significance of growth.
A second determinant receiving attention in the literature is the openness of the
country to trade. Cortes et al (2013) pointed out, in their analysis of FDI determinants
for 113 countries, that the amount of FDI attracted is directly related to the trade
openness of a country. Khadaroo et al. (2010) and Bevan et al. (2004) came to the same
conclusion for Mauritius and Eastern Europe. Jadhav (2012) argued that the effect of
openness depended on the type of investment (as described in section I).
As well as Asiedu (2006) for Africa and Bajo-Rubio et al. (1994) for Spain,
Cortes et al. (2013) came to the conclusion that macroeconomic instability is a
discouraging factor of attraction.
A country’s budget deficit is often associated with its economic health and
stability. Its effect on the attraction of FDI remains nevertheless unclear. Bose et al.
(2011)’s study on the FDI flows in 15 European transition countries and India found
that fiscal deficits lead to reduced investments. On the contrary, Banga (2003) estimated
6 There is no consensus about the effect of labor costs in the literature, the results
depending on the type of measure used. Indeed, high labor costs could be a sign of high
productivity and consequently show a positive coefficient (Wei, 2000). That is the
reason why Bellak et al. (2008) highlighted the necessity to use real unit labor costs.
Unlike the divergent literature, they found a negative effect of high unit labor costs on
inflows of FDI. Bevan et al. (2004) and Bajo-Rubio et al. (1994) confirmed it.
Studies about the role of taxation in the location of FDI have raised mixed
evidence. In their study about the flows of FDI into emerging EU countries compared to
the flows in “older” EU countries, Göndör et al. (2012) indicated that low corporate tax
rates had not helped the emerging countries to attract more FDI flows. However,
American researchers (Desai et al., 2004) found evidence that direct such as indirect
taxes are costly and related with reduced Foreign Direct Investments.
As stressed by Ilyas et al. (2011), infrastructures have a significant impact on the
FDI in Pakistan, confirming their intuition that the infrastructures of a country are
determinant for the reduction of the business costs and for the efficiency. Khadaroo et
al. (2010), analyzing a sample of African countries, estimated a positive and significant
coefficient for the transportation and non-transportation infrastructures. Using the
number of phones per capita, Cortes et al. (2013) found the same effect on FDI.
Next to the physical capital, more skilled workers are likely to provide higher
quality outputs and integrate technology easily (Campos et al., 2002). In their study on
100 countries, Cortes et al. (2013) concluded that FDI were encouraged by a skilled
labor force. Investigating the inflows to 36 developing countries, Noorbakhsh et al.
7 Besides strict economic factors, the quality of institutions is also an important
determinant of FDI (Blonigen, 2005). Wei (2000) concluded on the important negative
impact of corruption, as it increases the cost of operating in a foreign country. He also
noticed that the inclusion of “political stability” gives a positive and significant relation
with FDI inflows. The same effect was found for governance indicators and business
climate (Bayraktar, 2013; Bénassy-Quéré et al., 2007).
III. Data and methodology
Based on the literature review, one was able to choose the variables to test. The
dataset consists in yearly data points collected for Portugal and Spain over the period
1984-2012. Please find in Appendix 1 all the necessary information about the variables.
The dependent variable will be the amount of net FDI inflows, valued at current
USD and provided by the UNCTAD database. Using the inflows seems to be
appropriate as they will be more responsive to incentives and shocks. Moreover, the net
term accounts for foreign divestments and better reflects the attractiveness of a country.
Based on the literature review, we expect a positive sign for market size,
economic growth, openness to trade, infrastructures, human capital, political stability
and socioeconomic conditions. A negative coefficient should appear for budget deficit,
inflation, corporate income tax rates and unit labor costs.
The methodology followed will be to run multiple regressions for each country
using the same explanatory variables, in order to allow a comparison of the final
conclusions. As the number of observations is limited, the general specification will use
8
The other explanatory variables will further be included, in substitution of the
non-significant ones of Equation (1).
The Breusch-Godfrey tests for autocorrelation performed on the regressions
using level variables showed a systematic autocorrelation of order 1 to 4. The
consequences of serial correlation are twofold: (i) it may make the coefficients
imprecise and (ii) the standard errors could be wrong. Therefore, it could lead to wrong
conclusions (Brooks, 2008).
The procedure to correct autocorrelation is described in Brooks (2008, p.150)
and consists merely in subtracting from the basic model a lagged version of this same
model with a coefficient ρ. This gives the following:
, with (2)
where the is the dependent variable at time t, the vector of coefficients, the
vector of independent variables, a coefficient to be estimated and the error term.
In practice, should be estimated (through the Cochrane-Orcutt procedure, for
example). However, in this study, we will fix . The model becomes then a model
in first differences:
(3)
Using first differences to deal with autocorrelation is totally acceptable,
9 series, even though they have a low power in such a small sample, seem to support this
transformation from level to first differences. Indeed, according to the results showed in
appendix 2, all the series exhibit the presence of one unit root. This raises the need to
differentiate the variables to achieve stationarity. Furthermore, working with first
differences presents the advantage to correct the smooth variation of the artificial
variables and the high multicollinearity.
To conclude this section, the starting point of the analysis will be the basic
model that follows:
The regressions will be estimated with OLS1. It must be noted that this study
will be less demanding as for the level of significance of the independent variables.
Indeed, the significance tests performed have low power in small samples, with the
consequence that some variables might appear insignificant. That is why this study will
allow a 15% significance level.
IV. Empirical results
The regressions were calculated with the Stata 13 program and the classical
linear model assumptions were tested. Jarque-Bera (adjusted for sample size),
Breusch-Pagan, VIF and Breusch-Godfrey tests were performed to verify the normality of
residuals and to detect heteroscedasticity, multicollinearity and autocorrelation. The
results show that the model does not violate the three first assumptions.
1
This methodology will not allow us to find the long-run equilibrium (Brooks, 2008). It is usually desirable to use a methodology that captures it. However, seeing the low number of observations, the probability to find an equilibrium is very low in this case.
10 Some explanation must be provided as for the autocorrelation. The
Breusch-Godfrey tests indicate that the basic model, for both Spain and Portugal, experiences
autocorrelation of at least order 1. It could be solved by including a further lag of the
variables but this process consumes a lot of degrees of freedom, what makes it
inconsistent in this case. As for the subsequent models, there is strong evidence that the
first differences corrected serial correlation at least until order 3, so that it can be
neglected. Nevertheless, in order to reduce the potential negative effects, the study will
use the Newey-West standard errors. This methodology produces standard errors
correcting for both heteroscedasticity and autocorrelation (Brooks, 2008).
1. Portugal
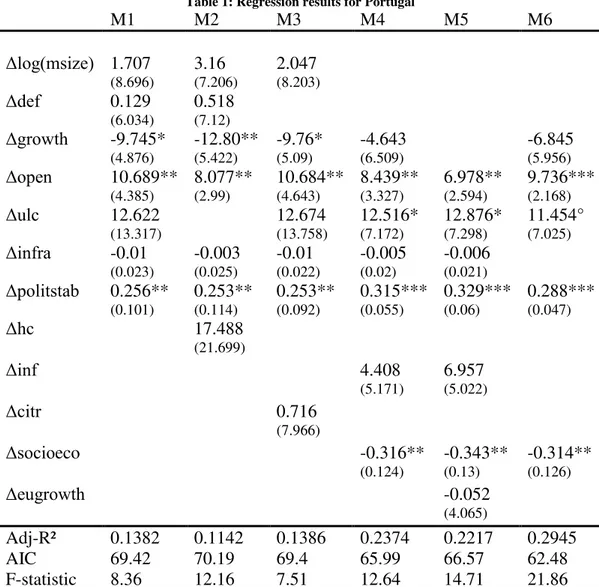
The regressions results found for Portugal are displayed in table 1. The first
empirical model used the basic specification indicated in equation (4). Only three
variables showed significance in explaining the FDI inflows, with a surprising negative
effect of growth. Note that the adjusted-R² did not have a satisfying explanatory power
and that the F-statistics indicated the model to be significant at 1%.
The second specification (M2) substituted the unit labor costs (ulc) by human
capital (hc), in order to test the potential effect of human capital on the attraction of
FDI. The test, however, was not conclusive and growth, openness to trade and political
stability remained the only significant variables. Seeing that the model quality
decreased, M1 was taken as basis for our further substitutions.
Attempting to verify the hypothesis that tax rates act as a deterrent for FDI, M3
11 Portugal, tax rates show a positive but non-significant effect and did not affect the rest
of the model.
Table 1: Regression results for Portugal
M1 M2 M3 M4 M5 M6
Δlog(msize) 1.707
(8.696) 3.16 (7.206) 2.047 (8.203) Δdef 0.129 (6.034) 0.518 (7.12) Δgrowth -9.745* (4.876) -12.80** (5.422) -9.76* (5.09) -4.643 (6.509) -6.845 (5.956) Δopen 10.689** (4.385) 8.077** (2.99) 10.684** (4.643) 8.439** (3.327) 6.978** (2.594) 9.736*** (2.168) Δulc 12.622 (13.317) 12.674 (13.758) 12.516* (7.172) 12.876* (7.298) 11.454° (7.025) Δinfra -0.01 (0.023) -0.003 (0.025) -0.01 (0.022) -0.005 (0.02) -0.006 (0.021) Δpolitstab 0.256** (0.101) 0.253** (0.114) 0.253** (0.092) 0.315*** (0.055) 0.329*** (0.06) 0.288*** (0.047) Δhc 17.488 (21.699) Δinf 4.408 (5.171) 6.957 (5.022) Δcitr 0.716 (7.966)
Δsocioeco -0.316**
(0.124) -0.343** (0.13) -0.314** (0.126) Δeugrowth -0.052 (4.065) Adj-R² AIC F-statistic 0.1382 69.42 8.36 0.1142 70.19 12.16 0.1386 69.4 7.51 0.2374 65.99 12.64 0.2217 66.57 14.71 0.2945 62.48 21.86
Standard errors in parentheses. Standard errors are robust to heteroscedasticity and potential correlation of errors. °Significant at 15%; *Significant at 10%; **Significant at 5%; ***Significant at 1%.
Seeing the non-significance of the market size, this variable was dropped and
replaced by the socioeconomic conditions. Moreover, the fourth regression took also
into account the potential impact of the macroeconomic instability (through inflation).
Socioeconomic conditions revealed a negative significant effect, meaning that a worse
situation would attract FDI inflows. The inclusion of these two variables increased the
12 A last substitution of the domestic growth by the European Union real GDP
growth did not bring anything to the general model (M5). As a consequence, a final
regression was run with the five significant variables found during the process. All
appeared significant, except the domestic GDP growth. The quality indicators of the
model remain a little bit disappointing while the overall model is significant at 1% level.
Overall, the results offer interesting interpretations. The market size exhibits the
expected positive sign but plays no role in the attraction of FDI in Portugal. It is an
indication that foreign investors are not looking to serve the Portuguese internal market
and would rather be interested in producing at lower costs for re-exportations to the
whole European market. The statistical insignificance of the domestic GDP growth
confirms this intuition.
As for the corporate income tax rates, if the foreign investments in Portugal are
“efficiency-seeking”, one could have expected a negative sign. Higher tax rates would
decrease the potential return on investment. The insignificance of the variable may be
explained by the variable choice. Statutory tax rates are theoretical and do not represent
what firms effectively pay, as stated in the literature.
Thirdly, openness to trade has an important and significant effect on the
attraction of FDI. It confirms previous studies on Portugal (Leitão et al., 2010) and
meets our expectations. The progressive liberalization of trade and foreign transactions
since the end of the dictatorship and the accession to the EEC benefitted to Portugal. A
further explanation of those results is given by Amador et al. (2007). According to the
authors, the improvement of the communication infrastructures after the mid-eighties
13 In our model, unit labor costs are significant and have a positive sign. It goes
against part of the literature but is not irrational. Several studies found the same sign
(Bénassy-Quéré et al., 2005; Boudier-Bensebaa, 2005). Unit labor costs may exhibit a
positive sign if the variable captures also skills and quality of labor. This holds for
Portugal. According to the OECD statistics, the labor productivity per unit of labor
input has almost doubled in 30 years while the real output per employee increased by
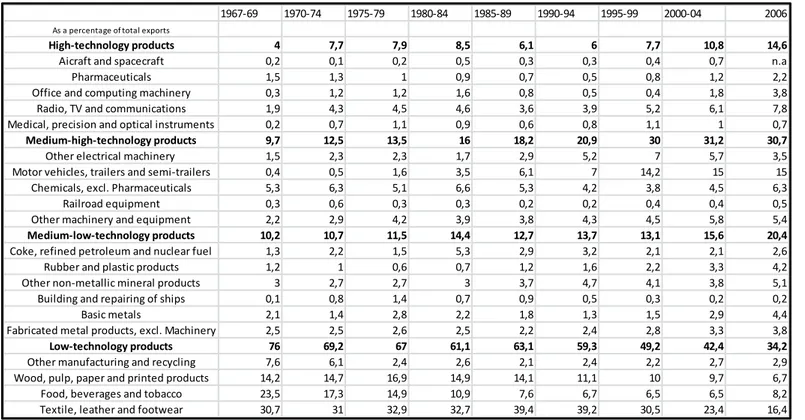
75% (see Appendix 3). Moreover, Amador et al. (2007) showed that, over the period
1967-2006, the share of medium-high and high technological exports increased
compared to the low technological ones. Therefore, one observes an increase in quantity
and quality of the Portuguese labor that supports this hypothesis. Unit labor costs in real
terms were also computed and tested in the models. As they brought no changes in the
results and since the nominal term is computed by an international organization, we
included only the results with the nominal unit labor costs.
The regressions confirmed the expected sign for political stability. It means that
foreign investors reacted positively to a more stable political and institutional
framework. This stability was strengthened by the transpartisan agreement to attract
FDI (Corado Simões et al., 2011), reducing the uncertainty for foreign investors.
The most unintuitive result is found for the socioeconomic conditions. The
negative effect indicates that a worsening of the socioeconomic conditions lead to
higher inward FDI. Although one should have expected the opposite sign, three
explanations exist. Firstly, several empirical studies concluded that a larger number of
unemployed job-seekers may attract foreign investors (Boudier-Bensebaa, 2005).
Secondly, a bad economic situation may attract investors looking for good opportunities
14 conditions may see foreign investors as a solution and set up incentives to attract them
(Head et al., 1999). As stated above, Portuguese authorities are indeed very active in
attracting FDI; they created the AICEP as sign of this commitment. Incentives are
another tool intensively used by the government. To give only one example, Oman
(2000) calculated that each job at the VW-Ford automobile plant of Setubal had been
subsidized with an amount of 265 000 USD.
The level of infrastructures development was insignificant for FDI inflows. One
may think that Portugal has reached a sufficient level of development so that the value
of additional infrastructures is very low. The same will be worth for Spain.
To summarize, the results corroborate the intuition that the FDI in Portugal were
mainly efficiency-seeking. Foreign investors were looking for stable institutions, a
proactive government behavior, ease of re-exporting goods and a better quality of labor
at a reasonable price. A hypothesis already expressed in Corado Simões et al. (2011).
2. Spain.
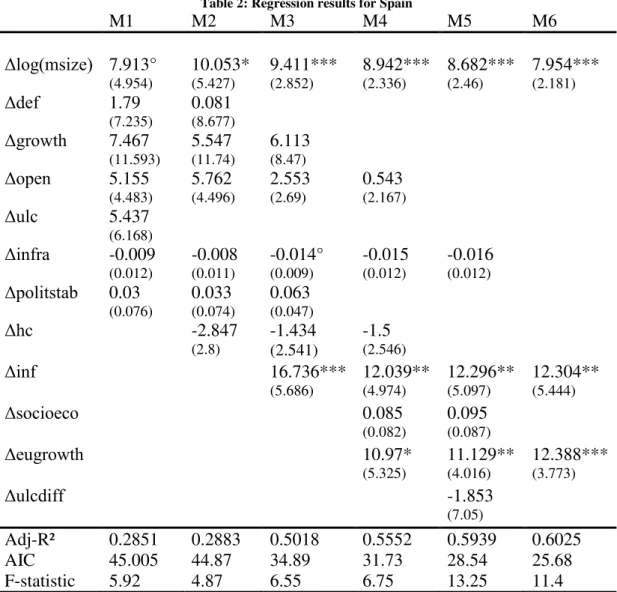
Using the same method as for Portugal, equation (4) was the first model tested.
Table 2 summarizes the results obtained for the successive regressions performed. The
adjusted-R² is low and the F-statistic concludes to a joint significance of the variables.
Nevertheless, the market size was the only variable to be statistically significant.
The second model (M2) substituted the ulc by hc, in order to test the potential
effect of human capital on the attraction of FDI. Human capital presented a negative but
not significant effect. Under this specification, the significance of the market size
improved such as the adjusted R² and the AIC value. It will be the basis for the
15
Table 2: Regression results for Spain
M1 M2 M3 M4 M5 M6
Δlog(msize) 7.913°
(4.954) 10.053* (5.427) 9.411*** (2.852) 8.942*** (2.336) 8.682*** (2.46) 7.954*** (2.181) Δdef 1.79 (7.235) 0.081 (8.677) Δgrowth 7.467 (11.593) 5.547 (11.74) 6.113 (8.47) Δopen 5.155 (4.483) 5.762 (4.496) 2.553 (2.69) 0.543 (2.167) Δulc 5.437 (6.168) Δinfra -0.009 (0.012) -0.008 (0.011) -0.014° (0.009) -0.015 (0.012) -0.016 (0.012) Δpolitstab 0.03 (0.076) 0.033 (0.074) 0.063 (0.047) Δhc -2.847 (2.8) -1.434 (2.541) -1.5 (2.546) Δinf 16.736*** (5.686) 12.039** (4.974) 12.296** (5.097) 12.304** (5.444) Δsocioeco 0.085 (0.082) 0.095 (0.087) Δeugrowth 10.97* (5.325) 11.129** (4.016) 12.388*** (3.773) Δulcdiff -1.853 (7.05) Adj-R² AIC F-statistic 0.2851 45.005 5.92 0.2883 44.87 4.87 0.5018 34.89 6.55 0.5552 31.73 6.75 0.5939 28.54 13.25 0.6025 25.68 11.4
Standard errors in parentheses. Standard errors are robust to heteroscedasticity and potential correlation of errors. °Significant at 15%; *Significant at 10%; **Significant at 5%; ***Significant at 1%.
As a third step, the deficit variable was replaced by inflation. On that way, the
regression controlled for macroeconomic instability. While the market size and the
inflation were highly positive and significant, the domestic growth and openness to
trade remained not relevant and with a positive sign. The infrastructures development
kept its negative effect and became significant at a 15% level.
In M4, political stability was removed for the socioeconomic conditions and the
domestic growth was replaced by the EU growth. The latter would help to determine if,
16 the domestic situation. The results were conclusive and the variable of EU growth
exhibited a positive significant effect, together with market size and inflation. However,
socioeconomic conditions were not relevant, such as openness and infrastructures.
The fifth model tested the possible effect of the difference in unit labor costs
between Spain and the average of the 18 countries of the Euro area. Human capital and
openness to trade were not included in the regression because of their insignificance.
The unit labor costs difference played no significant role in the attraction of FDI.
Finally, a last regression was run with the significant variables identified; the
market size, the EU growth and the inflation. The three have a positive effect on the
dependent variable and the model has a good explanatory power.
Overall, the Spanish determinants of FDI inflows show a clear difference with
Portugal. The first is the significance of the domestic market size. It appears that the
domestic GDP has a positive attraction effect on FDI. This is in agreement with most of
the studies (Bajo-Rubio et al., 1994; Rodriguez, 2008) and is the result one had
expected. Clifton et al. (2011) give different elements to corroborate this hypothesis: the
privatization of network companies and the liberalization of industries serving the local
market (electricity, gas, transports and telecoms). Furthermore, Chislett (2007)
described how FDI flew in after the accession to the EEC, attracted by the market
potential and large economies of scale. More recently, FDI have been more prominent
in the service sector (in banking and real estate services), focused on the local market.
The second significant variable is the European Union GDP growth rate, which
has a positive impact on the FDI inflows in Spain. This result seems to indicate that the
17 of its member states, namely Spain. Several studies, as reported in Blomström et al.
(1997), concluded that dynamic effects of regional integration led to higher
intraregional FDI. The result confirms this mechanism for Spain, a fortiori when the
regional bloc is growing. Moreover, as most of the investments flows come from the
EU members, it is normal that economic dynamism in these countries drove foreign
financial means into Spain. This outcome shows as well that the lights shed on Spain –
presented as the good performer in Europe – in a period where the EU was growing and
gaining importance participated to the attractiveness of the country of Cervantes.
The two countries distinguish themselves also concerning the socioeconomic
conditions. In Spain, they have a positive sign, even if they are not significant. Higher
consumer confidence and less poverty are not disadvantageous for market-seekers. As
opposed to Portugal also, the openness to trade was not significant. The openness of a
country is not fundamental when FDI are interested in the domestic market.
The human capital has a negative but insignificant impact. It is unexpected since
the index level is comparable to France, Italy and Germany. However, recent research
(Dutta et al., forthcoming) concluded to the non-linearity of the human capital impact.
According to them, after a certain threshold, the association between skills and FDI
becomes negative. The same effect might be at work in Spain.
It must be noted that corporate income tax rates were not taken into account to
avoid spurious results. The rate changed only two times on the considered period and it
fortuitously corresponded with several foreign acquisitions (ENEL acquiring Endesa
and Industrial Tobacco acquiring Altadis SA). Hence, the increase in FDI had no
18 Very surprisingly, the analysis concluded to a positive and significant influence
of inflation. As it contradicts all the preceding studies, this fact is difficult to explain.
Assuming that there might be another association “hidden” behind it, inflation has been
controlled with related variables and variables linked to economic stability. Hence,
domestic growth, nominal effective exchange rate, public debt and total tax revenues
were added to the model M3 and M6.These controls gave no satisfaction; none of them
was significant nor mitigated the effect of inflation. It indicates that macroeconomic
instability is not a concern for investors in the European institutional framework
anymore. As a consequence, this result without economic meaning may be neglected.
To summarize, it comes out from this study that the FDI flowing into Spain were
mainly conducted for market-seeking motivations. The size of the internal market
attracted investors willing to serve a huge demand and to make large economies of
scale. The positive coefficient of EU economic growth supports this hypothesis.
3. Limitations of the study
Given the aim of the study, that is to compare the specific determinants of FDI
attraction in Spain and Portugal, the sample of observations was quite limited in size.
Too few observations may decrease the robustness of the results and forced us to use
our unorthodox methodology of model selection. Having more data points would have
strengthened the analysis and its conclusions. A second weakness of this study is the use
of the statutory tax rate. The effective tax rate would have better represented the fiscal
burden of corporations. However, no data was found for the period considered. As third,
despite additional controls, no explanation was found for the positive and significant
effect of inflation on the inflows of FDI in Spain. Hence, it was neglected. Finally,
19 regulations and the countries’ perception are absent of the study. It would have been
interesting to find a way to include them.
V. Conclusion
Building upon the three main theories of Foreign Direct Investments attraction,
this study gathers together macroeconomic, institutional and locational determinants of
FDI in order to identify and compare the patterns of FDI in Portugal and Spain. This
paper explains the net FDI inflows in each country with the above mentioned variables.
After the literature review, regressions were conducted using yearly aggregated
data over the period 1984-2012. The reported F-statistics allow to conclude to the
significance of the overall models. The adjusted-R² indicate a good explanatory power
for Spain and a low power for Portugal.
The results reveal, at the Iberian level, the dichotomy theorized by previous
researches between market-seeking and efficiency-seeking investments. The model
shows evidence that higher unit labor costs, more openness to international trade, better
political stability and the effects of worse socioeconomic conditions acted as attracting
factors for FDI in Portugal. On the contrary, a larger market size and economic
dynamism at the regional level motivated foreign investments in Spain. At the exception
of the inflation, these results confirm the hypothesis of Neary (2009). Furthermore,
infrastructures, human capital and budget deficit showed statistical insignificance.
To conclude, even if globalization and regional integration are irreversible, a
country cannot simply replicate the policies of neighbors to attract FDI. Local
20
VI. References
Addison, Tony, Basudeb Guha-Khasnobis, and George Mayrotas. 2006.
“Introduction and Overview.” World Economy, 29(1): 1-8.
Amador, João, Sonia Cabral, and José R. Maria. 2007. “International trade patterns
in the last four decades: How does Portugal compare with other cohesion countries?”
Banco de Portugal Working Paper 14/2007.
Asiedu, Elizabeth. 2006. “Foreign direct investment in Africa: The role of natural
resources, market size, government policy, institutions and political instability.” The World Economy, 29(1): 63-77.
Assunção, Susana, Rosa Forte, and Aurora A.C Teixeira. 2011. “Location
Determinants of FDI: A Literature Review.” Faculdade de Economia de Porto Working Paper 433.
Bajo-Rubio, Oscar, and Simon Sosvilla-Rivero. 1994. “An econometric analysis of foreign direct investment in Spain, 1964-89.” Southern Economic Journal, 61(4): 104-120.
Banga, Rashmi. 2003. “Impact of government policies and investment agreements on
FDI inflows.” Indian Council for Research on Economic Relations Working Paper 116.
Bayraktar, Nihal. 2013. “Foreign Direct investment and Investment Climate.”
Procedia Economics and Finance, 5: 83 – 92.
Bellak, Christian, and Markus Leibrecht. 2009. “Do low corporate income tax rates
attract FDI?–Evidence from Central-and East European countries.” Applied Economics, 41(21): 2691-2703.
Bellak, Christian, Markus Leibrecht, and Aleksandra Riedl. 2008. “Labor costs and FDI flows into Central and Eastern European Countries: A survey of the literature and
empirical evidence.” Structural Change and Economic Dynamics, 19(1): 17-37.
Bénassy‐Quéré, Agnès, Maylis Coupet, and Thierry Mayer. 2007. “Institutional
determinants of foreign direct investment.” The World Economy, 30(5): 764-782.
Bénassy-Quéré, Agnès, Lionel Fontagné and Amina Lahrèche-Révil. 2005. “How
does FDI react to corporate taxation?”International Tax and Public Finance, 12(5): 583-603.
Bevan, Alan A. and Saul Estrin.2004. “The determinants of foreign direct investment
21
Billington, Nicholas. 1999. “The location of foreign direct investment: an empirical
analysis.” Applied economics, 31(1): 65-76.
Blomström, Magnus and Ari Kokko. 1997. “Regional Integration and Foreign Direct
Investment.” National Bureau of Economic Research Working Paper 6019.
Blonigen, Bruce A. and Jeremy Piger. 2011. “Determinants of foreign direct
investment.” National Bureau of Economic Research Working Paper 16704.
Blonigen, Bruce A. 2005. “A Review of The Empirical Literature On FDI
Determinants.” Atlantic Economic Journal, 33(4): 383-403.
Borensztein, Eduardo, José De Gregorio, and Jong-Wha Lee. 1995. “How Does Foreign Direct Investment Affect Economic Growth?” National Bureau of Economic Research Working Paper 5057.
Bose, Suchismita, and Sudipta Jha. 2011. “Financial Crises, Fiscal Deficits and
Foreign Direct Investments. Lessons for India from Emerging Europe.” http://www.icra.in/Files/MoneyFinance/financialcrisis.pdf
Boudier‐Bensebaa, Fabienne. 2005. “Agglomeration economies and location choice:
Foreign direct investment in Hungary.”Economics of Transition, 13(4): 605-628.
Brooks, Chris. 2008. Introductory Econometrics for Finance. Cambridge, UK: Cambridge University Press.
Campos, Nauro F., and Yuko Kinoshita. 2002. “The location determinants of foreign direct investment in transition economies.”
http://project.iss.u-tokyo.ac.jp/nakagawa/members/papers/3(9)kinoshita.final.pdf
Chislett, William. 2007. “Foreign Direct Investments in Spain.” Real Instituto Elcano
Working Paper 47/2007.
Clifton, Judith, Daniel Díaz-Fuentes, and Eduardo Ruiz. 2011. “Inward FDI in
Spain and its policy context.” Vale Columbia Center on Sustainable International
Investment.
Corado Simões, V., and Cartaxo, M. 2011. “Inward FDI in Portugal and its policy
context.” Vale Columbia Center on Sustainable International Investment.
Cortes, Gustavo S., and Claudio A.C Paiva. 2013. “Globalization and the Evolution
of Foreign Direct Investment Attractors: Why Mercosul lags the World.”
http://www.academia.edu/2613804/Globalization_and_the_Evolution_of_Foreign_Dire
22
de Castro, Priscila G., Elaine A. Fernandes, and Antônio C. Campos. 2013. “The
determinants of foreign direct investment in Brazil and Mexico: an empirical analysis.” Procedia Economics and Finance, 5: 231 – 240
Desai, Mihir A., Fritz C. Foley, and James R. Hines Jr. 2004. “Foreign direct
investment in a world of multiple taxes.” Journal of Public Economics, 88(12): 2727-2744.
Dunning, John H. 2001. "The eclectic (OLI) paradigm of international production: past, present and future." International journal of the economics of business, 8(2): 173-190.
Dutta, Nabamita, and Kwasi Osei-Yeboah. Forthcoming.“Foreign Direct Investment and Human Capital: The Role of Political and Civil Rights.” Journal of International Development. Available at SSRN: http://ssrn.com/abstract=12630388
Fabry, Nathalie., and Sylvain Zeghni. 2010. “Inward FDI in seven transitional
countries of South-Eastern Europe: a quest of institution-based attractiveness.” Eastern Journal of European Studies, 1(2): 77-91.
Gholami, Roghieh, Sang-Yong T. Lee, and Almas Heshmati. 2005. “The causal
relationship between ICT and FDI.” United Nations University – WIDER Research Paper 2005/26.
Göndör, Mihaela, and Paula Nistor. 2012. “Fiscal Policy and Foreign Direct
Investment: Evidence from some Emerging EU Economies.” Procedia - Social and Behavioral Sciences, 58: 1256-1266.
Groh, Alexander P., and Matthias Wich.2009. “A composite measure to determine a
host country's attractiveness for foreign direct investment.” IESE Business School
Working Paper 833.
Head, Keith C., John C. Ries, and Deborah L. Swenson. 1999. “Attracting foreign
manufacturing: Investment promotion and agglomeration.”Regional Science and Urban Economics, 29(2): 197-218.
Historical Public Debt Database. 2014. IMF.
https://www.imf.org/external/pubs/cat/longres.cfm?sk=24332.0 (accessed May 08,
2014)
International Country Risk Guide. 2014. Political Risk Services Group.
https://www.prsgroup.com/ (accessed Januray 20, 2014).
Ilyas, Muhammad, Abdul Ch. Rehman, Hassan M. Alam, and Muhammad Akram. 2011. “The impact of infrastructure on foreign direct investment: The case of
23
Jadhav, Pravin. 2012. “Determinants of foreign direct investment in BRICS
economies: Analysis of economic, institutional and political factor.” Procedia-Social and Behavioral Sciences, 37: 5-14.
Júlio, Paulo, Ricardo Pinheiro–Alves, and José Tavares. 2013. “Foreign direct investment and institutional reform: evidence and an application to Portugal.” Portuguese Economic Journal, 12: 215-250
Khadaroo, Jamel, and Boopen Seetanah.2010. “Transport infrastructure and foreign
direct investment.” Journal of International Development, 22(1): 103-123.
Leitão, Nuno C., and Horácio C. Faustino. 2010. “Determinants of Foreign Direct
Investment in Portugal.”Journal of Applied Business & Economics, 11(3): 19-26.
Neary, Peter J. 2009. “Foreign direct investment: The OLI framework.” In The Princeton Encyclopedia of the World Economy, Volume I, ed. Lewis Davis, Amy Glass, Ramkishen Rajan and Kenneth Reiner, 472-477. Princeton: Princeton University Press.
Noorbakhsh, Farhad, Alberto Paloni, and Ali Yousse. 2001. “Human Capital and
FDI Inflows to Developing Countries: New Empirical Evidence.” World Development, 29(9): 1593-1610.
Oman, Charles. 2000. Policy Competition for Foreign Direct Investments. Paris: OECD Development Centre.
Penn World Tables. 2014. Center for International Comparisons.
https://pwt.sas.upenn.edu/ (accessed January 15, 2014).
Rodriguez, Xosé A., and Julio Pallas. 2008. “Determinants of foreign direct investment in Spain.” Applied Economics, 40: 2443-2450.
UNCTAD. 2013. World Investment Report 2013 – Global Value Chains: Investment and Trade for Development. New York: United Nations.
Walsh, James P., and Jiangyan Yu.2010. “Determinants of foreign direct investment:
A sectoral and institutional approach.” International Monetary Fund Working Paper 10/187.
Wei, Shang-Jin. 2000. "How taxing is corruption on international investors?" Review of Economics and Statistics, 82(1): 1-11.
Zhan, Jimmy. 2006. “FDI statistics. A critical review and policy implications.”
24
Appendix 1: Description of the variables
Variable Proxy Source
FDI Annual net FDI inflows, in billions of (current) USD UNCTAD Stat Market size (msize) Real GDP (2005 USD), in billions World Bank (WDI) Public deficit (def) Budget deficit (% of GDP) IMF WEO database
GDP growth (growth) Real GDP growth, in % World Bank (WDI)
Openness to trade (open) Trade-to-GDP ratio, in % (current prices) UNCTAD Stat Inflation (inf) Consumer Price Index, annual growth in % IMF WEO database Unit labor costs (ulc) Annual nominal unit labor costs, in % OECD Stat
Corporate income tax rate (citr) Combined corporate income tax rate, in % OECD Stat
Infrastructures (infra) Fixed and mobile phone subscriptions per 100 persons,
# World Bank (WDI)
Human capital (hc) Index of human capital, # Penn World Tables Political stability (politstab) Index of political stability, /12 ICRG -CountryData Socioeconomic conditions
(socioeco) Index of socioeconomic conditions, /12 ICRG -CountryData European Union GDP growth
(eugrowth) Real European Union GDP growth, in % World Bank (WDI) Unit labor costs difference
(ulcdiff)
Difference in unit labor costs between the 18 countries
of the Euro area and Spain, in % OECD Stat
Nominal effective exchange
rate (neer) Nominal Effective Exchange Rate, Index (2010=100)
Bank of International Settlements Public debt (debt) Public debt to GDP ratio, in % HPDD Total tax revenues (taxrev) Total tax revenues to GDP ratio, in % OECD Stat
Real unit labor costs (rulc) Nominal unit labor costs deflated with the Consumer
Price Index, Index (2010=100) OECD Stat
Appendix 2: Results of the Dickey-Fuller tests
Portugal Spain
Variables Lag
selection
Augmented Dickey-Fuller (time trend (t))
Critical
value Variables
Lag selection
Augmented Dickey-Fuller (time trend (t))
Critical value
log(FDI) 2 -3,0 -3,238 log(FDI) 2 -2,534 -3,238
log(msize) 2 -0,634 -3,238 log(msize) 2 -1,04 -3,238
def 2 -1,812 -3,238 def 2 -0,929 -3,238
growth 2 -3,066 -3,238 growth 2 -1,917 -3,238
open 2 -2,981 -3,238 open 2 -1,802 -3,238
inf 2 -1,858 -3,238 inf 2 -3,063 -3,238
ulc 2 0,6 -3,238 ulc 2 -1,094 -3,238
citr 2 -1,496 -3,238 citr 2 -0,956 -3,238
infra 2 -1,86 -3,238 infra 2 -1,803 -3,238
hc* 2 -3,798 -3,238 hc 2 -1,455 -3,238
politstab 2 -2,297 -3,238 politstab 2 -2,253 -3,238
socioeco 2 -1,761 -3,238 socioeco 2 -2,345 -3,238
eugrowth 2 -2,85 -3,238 eugrowth 2 -2,85 -3,238
25
Appendix 3: Data on the Portuguese labor productivity and real output
Source: OECD Stat
Source: OECD Stat
57.58237 103.0356 0 20 40 60 80 100 120 In d e x o f Lab o u r Pr o d u ctiv ity Years
Labour Productivity per unit of Labour Input
(2010=100) Portugal 16253.2 29082.82 0 5000 10000 15000 20000 25000 30000 35000 R e al Ou tp u t (e u ro s) YearsReal Output per Person Employed
(Euros, constant prices)UNIVERSITE CATHOLIQUE DE LOUVAIN LOUVAIN SCHOOL OF MANAGEMENT
and
NOVA SCHOOL OF BUSINESS AND ECONOMICS
The determinants of Foreign Direct Investments attraction in Portugal and Spain: a comparative analysis
-
Appendix to the Thesis
Supervisor at LSM: Dr. Marcel Gérard
Supervisor at NOVASBE: Dr. Luís Campos e Cunha
Research Master’s Thesis
Submitted by Guillaume Wenseleers (No.1842) With a view of getting the degrees
Master in Management Master in Business Engineering
2
Table of Contents
I. Literature review: complete version ... 3
1. Market size and potential ... 3
2. Openness to trade ... 3
3. Macroeconomic stability ... 4
4. Budget deficit ... 4
5. Labor costs ... 4
6. Taxation level ... 5
7. Level of infrastructures ... 5
8. Level of human capital ... 6
9. Institutional factors ... 6
II. Explanation of the variables ... 7
III. Historical description of the FDI in Portugal ... 9
IV. Origin of the FDI in Portugal ... 10
V. Historical description of the FDI in Spain ... 13
VI. Origin of the FDI in Spain ... 14
VII. Specialization of the Portuguese exports ... 17
3
I. Literature review: complete version 1. Market size and potential
At a first sight, one might consider the economic situation of a host country very
likely to affect the incoming flows of FDI. Using quarterly and yearly data on the FDI
inflows in Brazil and Mexico, de Castro et al. (2013) found a stronger positive
relationship between the host country GDP and the investments flows for Brazil than for
Mexico. This confirms that a large market is more attractive for foreigners since it
represents a potential large demand and potential economies of scale. Numerous authors
acknowledged the same attraction effect (Bayraktar, 2013; Jadhav, 2012; Bellak et al.,
2008; Asiedu, 2006; Bevan et al. 2004; Bajo-Rubio et al, 1994). In its multicountry and
multiregion empirical analysis, Billington (1999) showed that high GDP and growth
were significant to attract FDI. Walsh and Yu (2010), in their sectoral approach of
determinants, also concluded to the significance of growth. However, Billington also
cited authors stating an insignificant effect of growth (Scaperlanda and Mauer, 1969).
The same insignificance of growth was found by Bayraktar (2013) using correlations.
2. Openness to trade
A second determinant receiving attention in the literature is the openness of the
country to trade. Cortes et al (2013) pointed out, in their analysis of FDI determinants
for 113 countries, that the amount of FDI attracted is directly related to the trade
openness of a country. They even showed that this variable gained in importance in the
last years as a consequence of the globalization. Jadhav (2012) argued that the effect of
openness depended on the type of investments (as described in section I), while de
Castro et al. (2013) concluded that the opening to trade helped both Mexico and Brazil
4 countries. Khadaroo et al. (2010), investigating the attractiveness of Mauritius,
concluded that trade openness was one of the main motivators of investments. This
impression was confirmed by Bevan et al. (2004) in their study of FDI flows to
European transition economies.
3. Macroeconomic stability
Following the work of Altomonte, Cortes et al. (2013) came to the conclusion
that macroeconomic instability is a discouraging factor of attraction. Using the inflation
rate as a proxy for macroeconomic instability in 22 Sub-Saharan countries, Asiedu
(2006) found a deterring effect of the inflation on incoming investments. Bajo-Rubio et
al. (1994) discovered the same negative and significant relation as for Spain.
4. Budget deficit
A country’s budget deficit is often associated with its economic health and
stability. Indeed, one could expect from a country with continuous deficits to increase
the tax burden or to take difficult adjustment measures likely to affect the
macroeconomic environment or the profitability of the investors. Its effect on the
attraction of FDI remains nevertheless unclear. Bose et al. (2011)’s study on the FDI
flows in 15 European transition countries and India found that fiscal deficits lead to
reduced investments. On the contrary, Banga (2003) estimated the effect of FDI policies
on the incoming flows to 15 developing countries. He concluded that the budget deficit
was not significant in the attraction of aggregate FDI.
5. Labor costs
There is no consensus about the effect of labor costs in the literature, the results
depending on the type of measure used. Intuitively, one would expect a negative effect
5 consequently show a positive coefficient. This assumption was raised by Wei (2000).
That is the reason why Bellak et al. (2008) highlighted the necessity to use real unit
labor costs, defined as the total nominal labor costs over nominal output per
employment. Unlike the divergent literature, they found a negative effect of high unit
labor costs on inflows of FDI. Bevan et al. (2004) and Bajo-Rubio et al. (1994)
confirmed it.
6. Taxation level
Studies about the role of taxation in the location of FDI have raised mixed
evidence. In their study about the flows of FDI into emerging EU countries compared to
the flows in “older” EU countries, Göndör et al. (2012) indicated that low corporate tax
rates had not helped the emerging countries to attract more FDI flows. And multiple
authors pointed out that the firm leaders do not consider a favorable tax policy as the
most important factor when investing abroad (Simmons, 2003). However, American
researchers (Desai et al., 2004) found evidence that direct such as indirect taxes are
costly and related with reduced Foreign Direct Investments. Wei (2000) reported a
negative and significant effect of tax rates on the attraction of FDI. Bellak et al. (2009)
concluded that taxes are almost as relevant as labor costs but less than the market size.
7. Level of infrastructures
As stressed by Ilyas et al. (2011), infrastructures have a significant impact on the
FDI in Pakistan, confirming their intuition that the infrastructures of a country are
determinant for the reduction of the business costs and for the efficiency. Khadaroo et
al. (2010), analyzing a sample of African countries, estimated a positive and significant
coefficient for the transportation and non-transportation infrastructures. Using the
6 Although most of the studies confirm the crucial contribution of infrastructures
(Billington, 1999), Quazi (2005) did not find anything significant (according to
Khadaroo et al., 2010).
8. Level of human capital
Next to the physical capital, the level of human capital is also a matter of
concern for foreign investors. Indeed, more skilled workers are likely to provide higher
quality outputs and integrate technology easily (Campos et al., 2002). In their study on a
sample of 100 countries, Cortes et al. (2013) concluded that FDI were encouraged by a
skilled labor force. Khadaroo et al. (2010) confirmed previous results of Asiedu (2006),
stating the labor force quality as enhancing the attractiveness of a country. Investigating
the FDI flows to 36 developing countries from 1980 to 1994, Noorbakhsh et al. (2001)
found that human capital is an important determinant of the locational advantage.
9. Institutional factors
Besides strict economic factors, the quality of institutions is also an important
determinant of FDI (Blonigen, 2005). Jadhav (2012), taking corruption and enforcement
of contracts as proxies, concluded that inefficient institutions act as a deterrent to FDI in
the BRICS. Asiedu (2006) drew the same conclusion about African countries. Wei
(2000) concluded on the important negative impact of corruption, as it increases the cost
of operating in a foreign country. He also noticed that the inclusion of “political
stability” gives a positive and significant relation with FDI inflows. In his study on the
ease of doing business, Bayraktar (2013) found strong evidence that a favorable
business climate was very attractive for foreign investors. Bénassy-Quéré et al. (2007)
examined the influence of recipient country institutions by including governance
7
II. Explanation of the variables
The dataset consists in yearly data points collected for Portugal and Spain over
the period 1984-2012.
The dependent variable will be the amount of net FDI inflows, valued at current
USD and provided by the UNCTAD database. Although several studies focus on FDI
stocks, using the inflows seems to be appropriate as they will be more responsive to
incentives and shocks. Moreover, the net term accounts for foreign divestments and
better reflects the attractiveness of a country.
The macroeconomic independent variables of the model are the country’s real
GDP (for the market size), the real GDP growth rate, the budget deficit over GDP, the
sum of exports and imports over GDP (as a proxy for openness to trade flows) and the
inflation rate (proxying macroeconomic instability). The data was collected from the
World Development Indicators, the IMF World Economic Outlook database and the
UNCTAD database. Market size, GDP growth and openness to trade should have a
positive effect. Budget deficit and inflation are expected to have a negative coefficient.
The locational independent variables are the unit labor costs, the number of
mobile and fixed phone subscriptions per 100 people (a proxy for infrastructures), the
combined statutory corporate income tax rate and the level of human capital. The
combined statutory corporate income tax rate is a measure accounting for the taxes to
pay to the local and national governments. Hence, it better reflects the total fiscal
burden borne by firms. The level of human capital is an index computed in the Penn
8 population1. The data for the tax rates and unit labor costs come from the OECD
databases and the infrastructures data were found in the World Development Indicators
database. All of their coefficients should show a positive sign, except for the corporate
income tax rates and unit labor costs.
The institutional variables are the political stability and the socioeconomic
conditions of the country. The former reflects the government and legislative strengths.
The latter represents the forces present in a country that could generate social
dissatisfaction (poverty, unemployment and consumer confidence) (PRS Group, 2014).
The data are based on monthly assessments made for the International Country Risk
Guide database. The assessments allow the database provider to give a grade (out of 12)
to the country for each of the two variables considered. Because a high score represents
a low risk, the variables should affect the FDI positively.
1
9
III. Historical description of the FDI in Portugal
FDI have been a component of Portuguese economy since the 16th century –
when Portugal dominated the international trade – and under the era of the Pombal
Marquis (Barros Castro, 2000).
The dictatorship period and several dramatic policies deterred foreign investors
and cut Portugal from international capital flows until the 1960’s. The membership to
the European Free Trade Association in 1960 changed the economic evolution of
Portugal (Casqueira, 2010). From that period on until 1973, the country knew a huge
increase in FDI inflows, particularly in low-technological activities (textiles and wood
products) where Portugal had a comparative advantage (as shown in Amador et al.,
2007).
During the following decade, the Portuguese open economy suffered from the
two oil shocks, from national policies (nationalizations, new labor regulation, reduction
of economic efficiency) consecutive to the 1974 revolution and from the loss of
colonies that finally led the IMF to intervene in 1983 (Barros Castro, 2000).
Simultaneously, FDI inflows suffered from the situation.
The recovery came during the second half of the 1980’s. The perspective of the
accession to the EEC, the proactive behavior of the successive governments and lower
oil prices gave a push to the foreign investments (Barros Castro, 2000). They were
mainly looking for lowering production costs in a country that was converging to the
European average.
The decade of the 1990’s saw the growth of FDI flows to Portugal slowing down
10 (AutoEuropa being the most illustrative) but the European economy decelerated and
Eastern European and Asian countries started to compete (Corado Simões, 2011).
However, almost at the same time, the Portuguese industrial complex acknowledged a
structural shift from low-technology and labor-intensive products to higher value added
and technology-intensive products (Casqueira, 2010) that attracted another type of
investors and further diversified the economy.
In the first decade of 2000, the FDI trend observed at the end of the 1990’s
seemed to have persisted. Figures of the AICEP show that the low-tech manufacturing
industry is losing ground compared to the automotive and financial sectors, supporting
the “sophistication” change operated in the Portuguese economy.
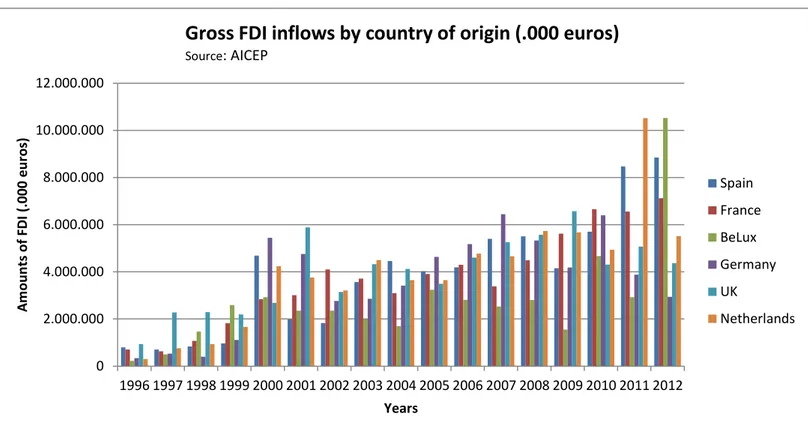
IV. Origin of the FDI in Portugal
When it comes to the geographical breakdown of the gross FDI inflows, one
notices that the large majority of the capital comes from 6 European countries. Over the
considered period, they have accounted for 65 to 87% of the gross flows. The Figures 1
and 2 display the necessary data.
The presence of UK among the main investors is not a surprise. Links between
the two countries are strong since the Middle Ages. Following several alliances against
Spain or France, the countries have a long tradition of bilateral trade that favored the
English investments in Portugal (The Anglo-Portuguese Society, 2007).
Figures 1 and 2 show that Spain represents the main gross investor. Except in
1999 and 2010, net FDI have always been positive, even during the recent crisis
11 core of Europe explains part of this relationship. The other reason, described by Barros
Castro (2000), is that Spain serves as an intermediate step for non-EU multinationals
willing to invest in Portugal. They then do it through their regular affiliate operating in
Spain or through a holding company, an ETVE (“Entidad de Tenencia de Valores
Extranjeros”).
It is almost the same mechanism applying for the Netherlands and the BeLux,
which also have special tax regimes for holding companies. These practices are behind
the volatility of their net FDI into Portugal.
At last, the decreasing role of Germany must be pointed out. Although it is a
historical investor in Portugal, Germany has been divesting during the last decade. It is
the consequence of the German firms turning their focus to Eastern Europe (the German
FDI stock more than tripled in countries like Hungary, Czech Republic and Poland
during the last decade) (Hirdina et al., 2010).
One may notice that the majority of FDI has its origins in the biggest European
economies. It exemplifies the intuition raised by Galego et al. (2004): firms operating in
large market have more possibilities to enjoy economies of scale and build up the
efficient structure/scale that will allow them to invest abroad. Firms operating in smaller
12
Figure 1: Gross FDI inflows by country of origin
Figure 2: Net FDI inflows by country of origin 0 2.000.000 4.000.000 6.000.000 8.000.000 10.000.000 12.000.000
1996 1997 1998 1999 2000 2001 2002 2003 2004 2005 2006 2007 2008 2009 2010 2011 2012
A m o u n ts o f FD I (.000 e u ro s) Years
Gross FDI inflows by country of origin (.000 euros)
Source: AICEP
Spain France BeLux Germany UK Netherlands -3.000.000 -2.000.000 -1.000.000 0 1.000.000 2.000.000 3.000.000 4.000.000 5.000.000 6.000.000 7.000.000
1996 1997 1998 1999 2000 2001 2002 2003 2004 2005 2006 2007 2008 2009 2010 2011 2012
A m ou n ts of FD I (.0 00 eu ros) Years
Net FDI inflows by country of origin (.000 euros)
13
V. Historical description of the FDI in Spain
The first significant FDI surge occurred in the 1850’s after the adoption of
accommodating regulation for foreign investors by Queen Isabel II. According to data
gathered by Castro et al. (2009), the main investing countries were France, the UK and
Belgium, mainly in the transportation sector. This industry as well as mining, wineries
and banking drove the majority of capital flows into Spain during the early 20th century
(Campa et al., 1994).
The above described movement slowed down in the late 1920’s. The Great
Depression strongly affected the international investments. On the top of that, the
country knew a civil war from 1936 until 1939 that brought an authoritarian regime to
power. The Franco regime built up economic barriers around the country with
trade-deterring measures, reinforced by a “post-WWII” embargo (Campa et al., 1994). Those
events reduced considerably the amounts of FDI to Spain.
The period of economic isolation came to an end in the 1950’s with Spain
joining the IMF and the OECD and the adoption of the 1959 Stabilization Plan
(Chislett, 2014). The Plan aimed at controlling inflation, stimulating growth and
“liberalizing foreign trade and encouraging foreign investment” (Meditz et al., 1988).
This policy played its role by attracting plenty of foreign investors interested in the
“virgin” significant domestic market.
Foreign investments grew sharply until 1973. Then, two oil shocks, the
uncertainty linked to the democratic process (Alguacil et al., 2001) and a world
economic crisis smoothed the upward trend. Nevertheless, the perspective of the
EU-membership and the resulting liberalization, privatizations and convergence to the EU
14 In the 1990’s, a trade reform, policy changes (in terms of exchange control and
foreign capital discrimination) and the devaluations of 1992 and 1993 (Chislett, 2014)
sustained the attractiveness of Spain despite the European economic deceleration. Most
of the investments were takeovers of Spanish firms in food, manufacturing and
chemicals (Campa et al., 1994).
The last decade saw the inflows continuously growing and the services gaining
more and more importance. According to Clifton et al. (2011), services accounted for
almost the double or the triple of the FDI in the two other sectors between 2005 and
2008. Moreover, services to local market (construction and retail industry) were
significant vectors of investment. Recently, Spain has defined six sectors particularly
attractive for FDI: the automotive sector, biotechnologies, food and agriculture, ICT and
audiovisual, aerospace and machine-tooling (Chislett, 2014).
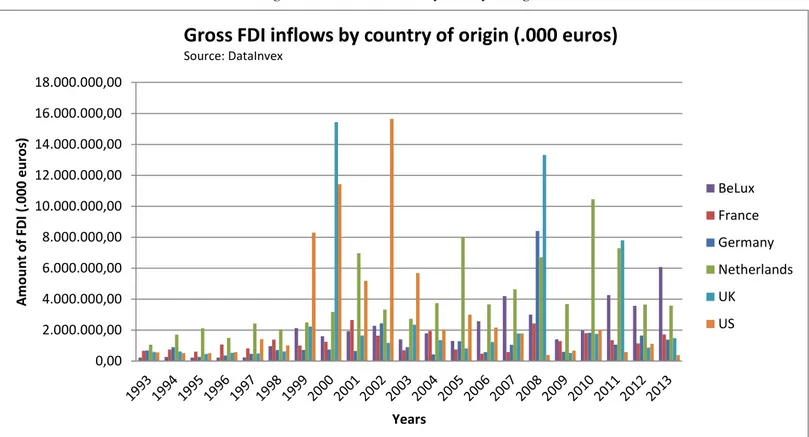
VI. Origin of the FDI in Spain
As in the case of Portugal, the overwhelming majority of the FDI comes from
Europe (almost 89% in 2009, according to Clifton et al., 2011). Over the period
1993-2013, one will consider only 5 European countries and include the US seeing the
importance of the inflows generated by this country. Figures 3 and 4 display the
necessary data.
The US represent the larger non-European investor in Spain. Three mechanisms
are involved: US firms establishing their EU headquarters in Spain, building productive
plants (in the automotive industry with Ford and GM) or using a Spanish affiliate as an