Article
J. Braz. Chem. Soc., Vol. 22, No. 2, 292-299, 2011. Printed in Brazil - ©2011 Sociedade Brasileira de Química 0103 - 5053 $6.00+0.00
A
*e-mail: [email protected]
Development and Validation of an UV-Derivative Spectrophotometric Method for
Determination of Glimepiride in Tablets
Rudy Bonfilio,*,a Magali B. de Araújob and Hérida R. N. Salgadoa
aDepartamento de Fármacos e Medicamentos, Faculdade de Ciências Farmacêuticas,
Universidade Estadual Paulista, Rodovia Araraquara-Jaú, km 1, 14801-902 Araraquara-SP, Brazil
bDepartamento de Farmácia, Universidade Federal de Alfenas, Rua Gabriel Monteiro da Silva, 700,
37130-000 Alfenas-MG, Brazil
A glimepirida é um fármaco antidiabético oral usado no tratamento da diabetes tipo 2. Este trabalho propôs o desenvolvimento e validação de um método por espectrofotometria derivada na região do ultravioleta para determinação de glimepirida em comprimidos. A quantiicação de
glimepirida em solução de NaOH 5×10⁻³ mol L-1 foi realizada usando um intervalo de 8 nm entre
220 a 300 nm. Os valores de amplitude do espectro de segunda derivada foram obtidos através de unidades de altura de pico entre a linha de base e os sinais em 279,0, 257,5 e 256,3 nm, para
quantiicação dos produtos Amaryl® 1 mg, Amaryl® 2 mg e Amaryl® 4 mg, respectivamente. O
método foi completamente validado de acordo com o International Conference on Harmonization
(ICH) e demonstrou exatidão, precisão, seletividade, robustez e linearidade. O método validado mostrou-se adequado para aplicações em laboratórios de controle de qualidade, pois não utiliza reagentes poluentes, é de simples execução e possui baixo custo.
Glimepiride is an oral antidiabetic drug widely used in treatment of type 2 diabetes. This work proposed the development and validation of a derivative UV spectrophotometric method for
determination of glimepiride in tablets. The quantiication of glimepiride in 5×10⁻³ mol L-1 NaOH
was performed by using a wavelength interval of 8 nm in the range of 220-300 nm. The amplitude values obtained in the second-derivative spectra were arbitrary units of the peak height from the central zero base line to the signals obtained at 279.0, 257.5 and 256.3 nm for quantiication of
Amaryl® tablets 1 mg, Amaryl® tablets 2 mg and Amaryl® tablets 4 mg, respectively. The method
was completely validated according to the International Conference on Harmonization (ICH) guidelines, showing accuracy, precision, selectivity, robustness and linearity. The validated method is suitable for quality control applications, since it does not use polluting reagents, it is simple and has low-cost.
Keywords: glimepiride, validation of pharmaceutical methods, derivative-UV spectrophotometry, pharmaceutical quality control
Introduction
Glimepiride, chemically described as 1-[[4-[2-(3-ethyl-4-methyl-2-oxo-3-pyrroline-1-carboxamide) ethyl] phenyl]sulphonyl]-3-(trans-4-methylcyclohexyil) urea,1
is a new oral antidiabetic drug from the sulfonylurea class, which is widely used in the treatment of type 2 diabetes.2 Glimepiride achieved metabolic control with
the lowest dose (1-8 mg daily) of all the sulphonylureas and it maintains a more physiological regulation of insulin
secretion than glibenclamide, during physical exercise.3 It
is a white to yellowish-white, crystalline, odorless solid and its molecular formula is C24H34N4O5S. Glimepiride has a molecular weight of 490.62 g mol-1 and it is practically
insoluble in water.4 The chemical structure of glimepiride
is shown in Figure 1.
The literature described different methods for quantitative determination of glimepiride in human plasma and biological samples. These include high performance liquid chromatography (HPLC) with UV spectrophotometric detection,5 semi-microbore high
performance liquid chromatography with column-switching,6 micellar electrokinetic chromatography
(MEKC),7 liquid chromatography/atmospheric pressure
chemical ionization mass spectrometry (LC APCI MS)8 and liquid chromatography combined with
electrospray ionization tandem mass spectrometry (LC ESI MS MS).9-13
In pharmaceutical preparations, multiple analytical procedures have been reported for the analysis of glimepiride when it is used as a single active principle or in combined dosage forms, using HPLC with UV spectrophotometric detection,14-20 liquid chromatography photo-diode
array detection (LC PDA),21 liquid chromatography
mass spectroscopy (LC MS),21 polarography,22 high
performance thin layer chromatography (HPTLC)23 and
spectrophotometry.19,24 However, HPLC techniques for
routine analysis are often time consuming and expensive. Moreover, the described spectrophotometric methods for determination of glimepiride require the useoftoxic solvents asmethanol19 and dimethylformamide.24
As an alternative to the existing methods, the aim of this study was to develop, validate and apply an inexpensive, useful and simple derivative UV spectrophotometric method for quantitative determination of glimepiride in commercial pharmaceutical tablet preparations.
Experimental
Equipments
The equipments used were the following: Shimadzu®
1601 (Kyoto, Japan) recording double beam UV-visible spectrophotometer connected to a computer loaded with Shimadzu UVPC version 3.9 software; ultrasonic bath model USC2800A (Unique®, São Paulo,
Brazil); analytical balance model 410 (Kern®, Kern,
Germany); pHmeter PA 200 (Marconi®, Piracicaba,
Brazil); water distiller system model 425 (Nova Técnica®,
Piracicaba, Brazil) and quantitative ilter paper (Vetec®,
Rio de Janeiro, Brazil). Chromatographic separations were carried out using a Waters Alliance® 2690 liquid
chromatograph (Milford, USA) equipped with a Waters®
high pressure 1525 pump binary grade, Waters® 2487 UV
detector and 7725i manual injector with a 20 μL loop. The separation was performed on a Waters Symmetry® C-18
column (4.6 mm × 250 mm, 5.0 μm).
Chemicals and reagents
Sodium hydroxide analytical grade was purchased from IMPEX® (Diadema, Brazil) and Dinâmica® (São
Paulo, Brazil). Sodium dihydrogenphosphate (NaH2PO4) was used from Reagen® (Colombo, Brazil) and sodium
acetate trihydrate was obtained from Synth® (Diadema,
Brazil). Methanol was of HPLC grade and acquired from Sigma-Aldrich® (St. Louis, USA). Glimepiride reference
substance (assigned purity 100.12%) was supplied by Zhejiang Xianju Huakang Pharmaceutical & Chemical Co., Ltd. (Xianju, China). Glimepiride tablets (Amaryl®, Sanoi
Aventis Us) claimed to contain 1, 2 and 4 mg of the active component were purchased locally. The placebo mixtures were prepared in the laboratory by mixing appropriate amounts (commonly used in tablets) of following pharmaceutical grade excipients: lactose hydrous, sodium starch glycolate, povidone, microcrystalline cellulose, and magnesium stearate. In addition, red ferric oxide was used in the placebo of Amaryl® 1 mg, yellow ferric oxide and
lake indigo carmine in the placebo of Amaryl® 2 mg and
lake indigo carmine in the placebo of Amaryl® 4 mg. The
qualitative composition of each placebo was the same as claimed in Amaryl® tablets 1 mg, Amaryl® tablets 2 mg and
Amaryl® tablets 4 mg.
Spectrophotometric measurements
UV-Vis spectra of reference and sample solutions were recorded in 1 cm quartz cells at a fast scan speed with a ixed slit to lead to a spectral resolution of 2 nm. The second-derivative spectra were obtained by instrumental electronic differentiation (UVPC version 3.9 software) using a wavelength interval (∆λ) of 8 nm in the range of 220-300 nm. The amplitude values obtained in the second-derivative spectra were arbitrary units of the peak height from the central zero base line to the signals obtained at 279.0, 257.5 and 256.3 nm for quantiication of Amaryl®
tablets 1 mg, Amaryl® tablets 2 mg and Amaryl® tablets
4 mg, respectively. All analytical responses obtained were multiplied by 100 (scaling factor of 100) by using a resource of the UVPC software. The spectrophotometric measurements were recorded by using 5×10⁻³ mol L-1
sodium hydroxide solution as a blank solution.
Chromatographic conditions
validated by our research group. HPLC analyses were carried out using potassium phosphate buffer (pH 6.5, 27.5 mmol L-1)/methanol (34/66, v/v) as mobile phase,
low rate at 1.0 mL min-1. The UV detection was carried
out at 228 nm wavelength, and the injection volume was 20 μL. The column was maintained at controlled room temperature (25 ºC).
Preparation of solutions
Stock and working standard solutions
Stock standard solution containing 50 mg L-1 of
glimepiride was prepared by accurately weighing 12.5 mg of glimepiride reference substance into a 250 mL volumetric lask and adding 200 mL of 5×10⁻³ mol L-1
sodium hydroxide solution. The lask was sonicated for 30 min and then illed up to volume with 5×10⁻³ mol L-1
NaOH solution.
Working standard solutions were prepared immediately before use by suitable dilutions of the corresponding stock solutions to appropriate concentration levels by using 5×10⁻³ mol L-1 sodium hydroxide solution as diluent. In
the HPLC method, the stock standard solution was diluted with mobile phase.
Sample solutions
Twenty tablets of each dosage form (Amaryl® 1, 2 and
4 mg) were used. The tablets were weighed and totally powdered. The mass equivalent to one tablet glimepiride content of each dosage form was weighed into a 50 mL volumetric flask, 40 mL of 5×10⁻³ mol L-1 sodium
hydroxide solution was added and the lask was sonicated for 30 min. The flask was filled up to volume with 5×10⁻³ mol L-1 NaOH solution. Appropriate dilutions were
made into the range of calibration curve by using the same solvent. In the HPLC method, samples were diluted with mobile phase.
Stability of the glimepiride in solution
The stability of the glimepiride stock standard solution in 5×10⁻³ mol L-1 sodium hydroxide solution at a
concentration of 50 mg L-1 was investigated at different time
intervals, by using the experimental conditions.
Method validation
Method validation was performed following ICH speciications25 for selectivity, linearity, accuracy, precision,
robustness, detection limit and quantitation limit.
Selectivity
Selectivity was evaluated by analysis of the second-derivative (D2) spectra of placebo solutions and the glimepiride working standard solution at the concentration of 10 mg L-1. The placebo solutions of Amaryl® 1, 2 and 4 mg
containing the same composition as the pharmaceutical formulations were prepared for this study. They were treated in the same manner as the commercial samples.
Linearity
Linearity was evaluated by regression analysis of glimepiride standard solutions at seven concentration points in triplicate ranging from 2 to 40 mg L-1 prepared
on three consecutive days (n = 3). The values are reported as the mean ± S.D. of the calibration curves. The data were analyzed at three wavelengths: 256.3, 257.5 and 279.0 nm. Evaluation parameters, such as slope, intercept, correlation coeficient and squares residual sum, were calculated and presented. Moreover, the data were validated by means of the analysis of variance (ANOVA).
Accuracy
The method accuracy was determined by measuring the reference standard recovery in triplicate at three levels from 80 to 120% of the method concentration (10 mg L-1),
according to ICH recommendations. A standard stock solution containing 50 mg L-1 of glimepiride was prepared
in 5×10⁻³ mol L-1 NaOH. In volumetric lasks of 25 mL,
aliquots of 1.5, 2.5 and 3.5 mL of this standard solution (concentrations of 3.0, 5.0 and 7.0 mg L-1, respectively) were
individually added to 2.5 mL of sample solutions at 50 mg L-1
(concentration of 5.0 mg L-1). The lasks were illed up to
volume with 5×10⁻³ mol L-1 NaOH solution. Therefore, inal
concentrations were 8, 10 and 12 mg L-1,which correspond
to 80, 100 and 120% of the target concentration, respectively. The mean recoveries, expressed in terms of percent recovery of the pharmaceutical dosage forms (Amaryl® 1, 2 and 4 mg)
by the assay and the respective relative standard deviation (R.S.D.), were determined.
Precision
concentration of 10 mg L-1 were prepared and assayed. The
data were analyzed at three wavelengths: 256.3, 257.5 and 279.0 nm. The percentages of relative standard deviation (R.S.D.) of the analytical responses were calculated.
Robustness
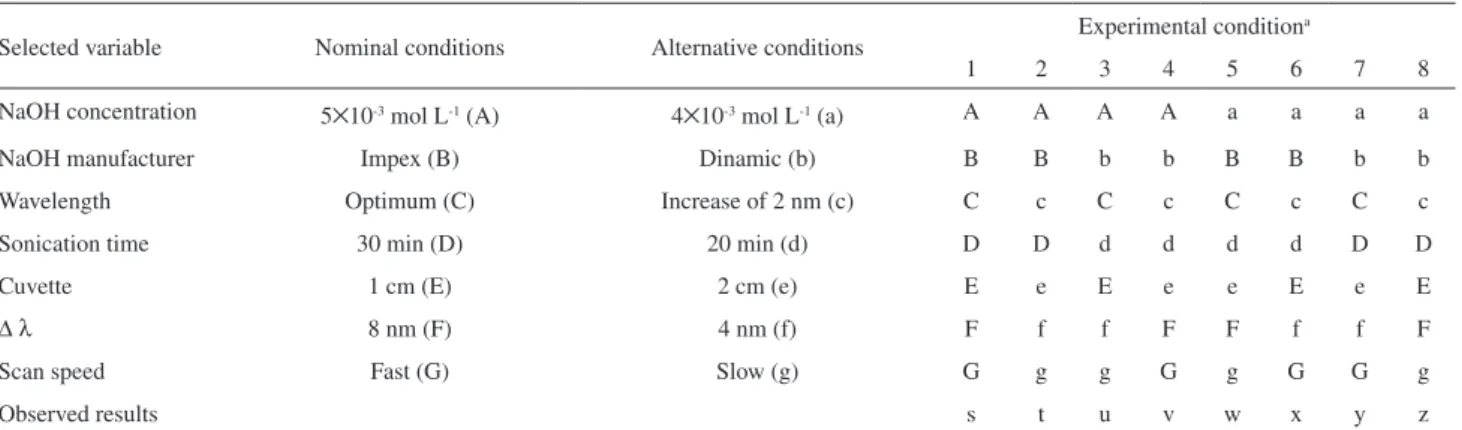
The robustness of the method was evaluated by analyzing data after checking seven variables according to Youden and Steiner’s robustness test.26 Glimepiride
working standard solutions at the concentration of 10 mg L-1 were used in these experiments. The variables
selected were: sodium hydroxide concentration, sodium hydroxide manufacturer, wavelength, sonication time, spectrophotometer cuvette, wavelength interval and scan speed. The variables nominal values were indicated by A, B, C, D, E, F and G and their alternative values were indicated by the corresponding lower case letters a, b, c, d, e, f and g. A total of eight experiments were conducted as indicated in Table 1. From these results, the effect of each variable was estimated by obtaining the difference of the averages of the four analyses that have the nominal value (upper case letter) and the four analyses with the alternative value (lower case letter). Considering the standard deviation of the eight results, effect values higher than the criterion s√2 (standard deviation multiplied by the square root of two) were considered signiicant and the method is sensitive to changes in the concerned variable.
Limits of detection and quantiication
The limit of detection (LOD) and the limit of quantiication (LOQ) of the methods were obtained from the equations (1) and (2):
LOD = 3(S.D./a) (1)
LOQ = 10(S.D./a) (2)
where S.D. is intersection standard deviation and a is the average slope, obtained from calibration curves of the linearity study.
Assay of pharmaceutical products
T h e va l i d a t e d s e c o n d - d e r iva t iv e U V- Vi s spectrophotometric method was applied for glimepiride quantitation in tablets (Amaryl® 1 mg tablet; Amaryl® 2 mg tablet and Amaryl® 4 mg tablet). Moreover, the same product batches were analyzed by a HPLC method. The results were obtained by comparison of the sample spectrophotometric measurements (n = 5) with those obtained from glimepiride standard solutions (n = 5) at the same concentration levels.
Results and Discussion
Method development
The reported methods for the determination of glimepiride are complex, time consuming or require the use of large amounts of organic solvents. In this paper, a non-toxic solvent was chosen in order to obtain an inexpensive, simple and environmentally friendly spectrophotometric method for quantiication of glimepiride in tablets. Glimepiride is not soluble in water, acid, base, borate or phosphate buffers. It is partly soluble in methanol, ethanol, acetone and ethylacetate and completely soluble in dimethylformamide.24 However,
glimepiride is a drug with pH-dependent solubility and, in media at pH greater than 7, the solubility of the substance is slightly increased.27 Due to pH effect on drug solubility,
sodium hydroxide solutions at different concentrations were tested and 5×10⁻³ mol L-1 sodium hydroxide was found to be
Table 1. Variables and their levels according to Youden and Steiner’s robustness test26
Selected variable Nominal conditions Alternative conditions Experimental condition
a
1 2 3 4 5 6 7 8
NaOH concentration 5×10⁻³ mol L-1 (A) 4×10⁻³ mol L-1 (a) A A A A a a a a
NaOH manufacturer Impex (B) Dinamic (b) B B b b B B b b
Wavelength Optimum (C) Increase of 2 nm (c) C c C c C c C c
Sonication time 30 min (D) 20 min (d) D D d d d d D D
Cuvette 1 cm (E) 2 cm (e) E e E e e E e E
∆ λ 8 nm (F) 4 nm (f) F f f F F f f F
Scan speed Fast (G) Slow (g) G g g G g G G g
Observed results s t u v w x y z
an adequate solvent for dissolving glimepiride, avoiding the use of an organic solvent.
Zero-order UV-Vis spectrum of glimepiride in 5×10⁻³ mol L-1 sodium hydroxide showed maximum drug
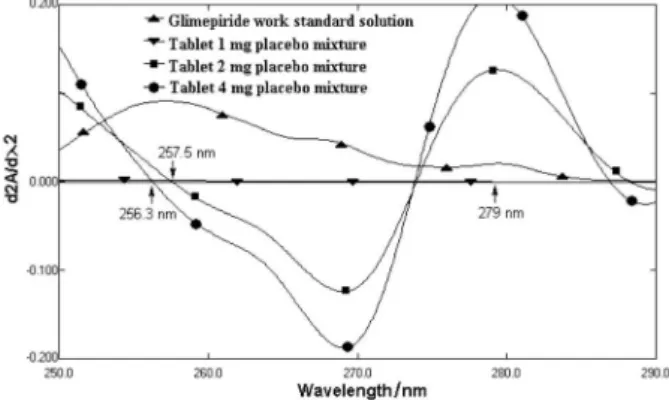
absorption wavelength above 230 nm. However, signiicant interference from the tablet excipients was veriied in the region of glimepiride absorption spectrum, which precludes the analytical use of zero-order spectrophotometry (Figure 2). For this reason, the second-order derivative spectrophotometric method (D2) was considered to be ideal for solving the overlapping of excipients absorption over glimepiride signal. As observed in Figure 3, the zero-crossing for tablets 1, 2 and 4 mg placebo solutions appears at 279.0, 257.5 and 256.3 nm, respectively. Therefore, these values were selected as optimum to determine glimepiride in the presence of the pharmaceutical excipients, which are contained in Amaryl® tablets. The irst, third, and fourth
derivatives were discarded because they showed insuficient selectivity and did not present analytical advantages.
To verify the optimum ∆λ for obtaining second-derivative spectra various values of ∆λ were tested and ∆λ= 8 nm was chosen as the most appropriate in order to give an adequate signal-to-noise ratio. Increasing ∆λ,
the signal-to-noise ratio improves and the luctuation in a derivative spectrum decreases. However, if the value of ∆λ is too large, the spectral intensity signal of second-derivative deteriorates.
Stability of the glimepiride in solution
The results from stability study indicated that the glimepiride stock standard solution was stable at room temperature for at least 6 h (Table 2).
Method validation
After identifying derivative order and optimum wavelength for each dosage form (279.0 nm for Amaryl®
Tablets 1 mg, 257.5 nm for Amaryl® Tablets 2 mg and
256.3 for Amaryl® Tablets 4 mg), the analytical method
was validated according to ICH recommendations.25
Selectivity
The second-derivative spectra analyses show that formulation excipients of the pharmaceutical tablet products
Table 2. Stability of glimepiride stock standard solution at concentration of 50 mg L-1 in 5×10⁻³ mol L-1 sodium hydroxide solution
0 h 1 h 2 h 3 h 4 h 5 h 6 h
Responses at 256.3 nm
1 (d2A/dλ2) 0.4276 0.4304 0.4243 0.4244 0.4255 0.4249 0.4242
2 (d2A/dλ2) 0.4275 0.4252 0.4259 0.4244 0.4252 0.4200 0.4235
3 (d2A/dλ2) 0.4270 0.4280 0.4275 0.4086 0.4200 0.4194 0.4249
Responses at 257.5 nm
1 (d2A/dλ2) 0.4390 0.4426 0.4391 0.4376 0.4378 0.4373 0.4369
2 (d2A/dλ2) 0.4397 0.4374 0.4393 0.4376 0.4383 0.4326 0.4361
3 (d2A/dλ2) 0.4395 0.4406 0.4394 0.4201 0.4321 0.4320 0.4369
Responses at 279.0 nm
1 (d2A/dλ2) 0.1003 0.1011 0.1006 0.1000 0.1007 0.1005 0.1005
2 (d2A/dλ2) 0.1007 0.1001 0.1004 0.1000 0.1006 0.0998 0.1002
3 (d2A/dλ2) 0.1008 0.1015 0.1002 0.0959 0.0993 0.0993 0.1003
Figure 2. Zero-order absorption spectra of 1, 2 and 4 mg placebo solutions and glimepiride work standard solution at 10 mg L-1 in 5×10⁻³ mol L-1
sodium hydroxide.
Figure 3. Second-derivative absorption spectra of 1, 2 and 4 mg placebo solutions and glimepiride work standard solution at 10 mg L-1 in
Amaryl® 1, 2 and 4 mg did not interfere signiicantly
in the second-derivative spectrophotometric method (Figure 3). The obtained values of the analytical responses (d2A/dλ2) for placebo mixtures were: 0.0000 at 279.0 nm for tablet 1 mg placebo mixture, 0.0004 at 257.5 nm for tablet 2 mg placebo mixture and −0.0005 at 256.3 nm for tablet 4 mg placebo mixture. These values correspond to 0.0, 0.43 and −0.55% of the signals at 279.0, 257.5 and 256.3 nm, respectively.
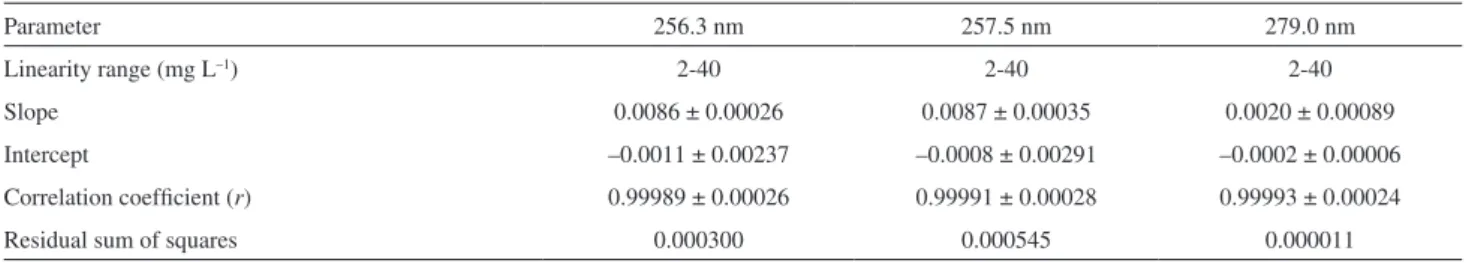
Linearity
The analytical curves, generated on three consecutive days (n = 3) by plotting the mean amplitude values of second-derivative spectra at 279.0, 257.5 and 256.3 nm against concentration yielded correlation coeficients greater than 0.999 (Table 3). Additionally, the data were validated by means of analysis of variance (Table 4), which showed significant linear regression (Fcalculated > Fcritical, P = 5%) and no signiicant lack of it (Fcalculated < Fcritical, P = 5%). The Y intercept were not signiicantly different from zero.
Accuracy
The accuracy of the method was confirmed by determining the average recoveries from the samples by applying the standard addition method. As shown in Table 5, the mean percentage recoveries of products Amaryl® 1, 2 and 4 mg were in accordance with ixed
limits of 98.0 up to 102.0%, indicating the suitability of the developed method in quantifying the concentration of glimepiride in pharmaceutical tablets.
Precision
Repeatability (intra-day precision) of the analytical method was found to be reliable based on %R.S.D. (< 2%). Intermediate precision (inter-day precision) was demonstrated on different days by two analysts. The %R.S.D. values were less than 2%, conirming that the method is suficiently precise (Table 6).
Robustness
The results obtained in Youden and Steiner’s robustness test26 are shown in Table 7. The effect of each variable,
standard deviation of the eight results and the criterion s√2 were calculated and used to evaluate the results. Effect values higher than the criterion s√2 were considered signiicant and the method is sensitive to changes in the concerned variable. The results indicate that a variation of 2 nm in wavelength is the only variable that needs to be controlled for quantiication of Amaryl® 1 mg tablet. Therefore, the
method is fairly robust with regard to the parameters sodium hydroxide concentration, sodium hydroxide manufacturer,
Table 3. Linearity parameters for the determination of glimepiridea
Parameter 256.3 nm 257.5 nm 279.0 nm
Linearity range (mg L–1) 2-40 2-40 2-40
Slope 0.0086 ± 0.00026 0.0087 ± 0.00035 0.0020 ± 0.00089
Intercept –0.0011 ± 0.00237 –0.0008 ± 0.00291 –0.0002 ± 0.00006
Correlation coeficient (r) 0.99989 ± 0.00026 0.99991 ± 0.00028 0.99993 ± 0.00024
Residual sum of squares 0.000300 0.000545 0.000011
aValues are reported as mean ± S.D. of three calibration curves generated on three consecutive days (n= 3).
Table 4. Summary of ANOVA for the evaluation of linearity
Wavelength Source Calculated
F value Critical F value
256.3 nm Regression 15848.64 4.38
Lack of it 0.66 2.96
257.5 nm Regression 9001.46 4.38
Lack of it 0.27 2.96
279.0 nm Regression 24573.74 4.38
Lack of it 0.58 2.96
Table 5. Method accuracy results for glimepiride tablets
Samples at 5 mg L-1
Reference standard concentration (mg L-1) R.S.D.
(%) n = 3
Recovery (%)
Mean recovery
(%) Added Found
Amaryl® 1 mg
(279.0 nm)
Amaryl® 2 mg
(257.5 nm)
Amaryl® 4 mg
(256.3 nm)
3.0 5.0 7.0
3.0 5.0 7.0
3.0 5.0 7.0
2.9 5.1 6.9
3.0 5.0 6.8
2.9 5.0 6.8
2.69 3.04 4.59
0.34 0.60 0.43
2.02 0.32 0.38
97.98 101.28
99.04
101.10 100.66 97.54
97.70 99.18 97.38
99.43
99.77
sonication time, spectrophotometer cuvette, wavelength interval and scan speed.
Limits of detection and quantiication
LOD and LOQ values were found to be respectively 1.311 and 4.371 mg L-1 for Amaryl® tablets 1 mg
(279.0 nm); 1.000 and 3.332 mg L-1 for Amaryl® tablets
2 mg (257.5 nm); and 0.826 and 2.755 mg L-1 for Amaryl®
tablets 4 mg (256.3 nm). These results demonstrated that
the analyses were being performed in a region above the quantitation limit value.
Assay of pharmaceutical products
The validated method was applied for determination of glimepiride in tablets. Five samples from each product (Amaryl® 1 mg tablet; Amaryl® 2 mg tablet and Amaryl® 4 mg tablet) were analyzed. Moreover, the same product batches were analyzed by a HPLC technique. The results, expressed as percentage drug related to label claim, are shown in Table 8. As it can be seen, the results for the drugs assayed using the proposed spectrophotometric method were in good agreement with the HPLC technique.
Conclusions
In this work, an analytical derivative UV spectrophotometric method was developed for quantitative determination of glimepiride in tablets. Its advantages over other existing methods are its simplicity, fastness and low-cost conditions. Moreover, it does not use polluting reagents.
All validation parameters were found to be highly satisfactory, indicating linearity, selectivity, precision,
Table 6. Method precision results for glimepiride tablets
Wavelength Level Analytical responses (d2A/dλ2) R.S.D (%)
1 2 3 4 5 6
279.0 nm
Repeatability 0.0211 0.0214 0.0217 0.0213 0.0218 0.0211 1.39 (n = 6)
Intermediated precision 0.0211 0.0211
0.0214 0.0212
0.0217 0.0207
0.0213 0.0209
0.0218 0.0207
0.0211
0.0207 1.74 (n = 12)
257.5 nm
Repeatability 0.0944 0.0933 0.0930 0.0923 0.0928 0.0913 1.11 (n = 6)
Intermediated precision 0.09440.0943 0.09330.0927 0.09300.0915 0.09230.0921 0.09280.0927 0.09130.0928 1.02 (n = 12)
256.3 nm
Repeatability 0.0917 0.0906 0.0903 0.0897 0.0903 0.0890 1.00 (n = 6)
Intermediated precision 0.0917 0.0929
0.0906 0.0914
0.0903 0.0903
0.0897 0.0909
0.0903 0.0915
0.0890
0.0915 1.14 (n = 12)
Table 7. Robustness test results
Factor
Effects Amaryl® 1 mg
(279.0 nm)
Amaryl® 2 mg
(257.5 nm)
Amaryl® 4 mg
(256.3 nm) NaOH concentration 0.0009 –0.0012 –0.0028 NaOH manufacturer –0.0059 0.0115 0.0105
Wavelength 0.0101a –0.0065 –0.0115
Sonication time 0.0009 0.0041 0.0023
Cuvette –0.0011 –0.0029 –0.0011
Wavelength interval –0.0027 –0.0151 –0.0042
Scan speed –0.0015 0.0005 0.0009
s√2 0.0092 0.0156 0.0125
aEffect value higher than the criterion s√2.
Table 8. Assay of glimepiride in pharmaceutical capsule samples A, B and C
Method Standard Amaryl® 1 mg
(279.0 nm)
Amaryl® 2 mg (257.5 nm)
Amaryl® 4 mg (256.3 nm)
Derivative spectrophotometry
Glimepiride (%) 100.12 100.21 100.34 103.93
Glimepiride (mg) --- 1.00 2.01 4.16
R.S.D. (%) 1.03 (n = 5) 2.19 (n = 5) 1.38 (n = 5) 1.02 (n = 5)
HPLC
Glimepiride (%) 100.12 100.86 101.49 100.66
Glimepiride (mg) --- 1.01 2.03 4.03
accuracy, robustness and adequate detection and quantiication limits. The method, therefore, can be easily applied in routine quality controllaboratories.
Acknowledgments
The authors are grateful to FAPESP (São Paulo, Brazil), CNPq (Brasília, Brazil) and PADC/FCF/UNESP (Araraquara, Brazil) for research fellowships.
References
1. European Pharmacopoeia, 6th ed., Council of Europe:
Strasbourg, France, 2008.
2. Roßkamp, R.; Wernicke-Panten, K.; Draeger, E.; Diabetes Res.
Clin. Pract.1996, 31, S33.
3. Draeger, K. E.; Wernicke-Panten, K.; Lomp, H. J.; Schüler, E.; Roßkamp, R.; Horm. Metab. Res.1996, 28, 419.
4. FDA Guidance for Industry: Statistical Approaches to Establishing Bioequivalence, US Department of Health and Human Services, Food and Drug Administration, Centre for Drug Evaluation and Research (CDER), 2010, http:// www.accessdata.fda.gov/scripts/cder/drugsatfda/index. cfm?fuseaction=Search.Label_ApprovalHistory, accessed in June, 2010.
5. Lehr, K. H.; Damm, P.; J. Chromatogr.1990, 26, 497. 6. Song, Y. K.; Maeng, J. E.; Hwang, H. R.; Park, J. S.; Kim, B.
C.; Kim, J. K.; Kim, C. K.; J. Chromatogr., B2004, 810, 143. 7. Núñez, M.; Ferguson, J. E.; Machacek, D.; Jacob, G.; Oda, R.
P.; Lawson, G. M.; Landers, J. P.; Anal. Chem.1995, 67, 3668. 8. Maurer, H. H.; Kratzsch, C.; Kraemer, T.; Peters, F. T.; Weber,
A. A.; J. Chromatogr., B2002, 773, 63.
9. Kim, H.; Chang, K. Y.; Park, C. H.; Jang, M. S.; Lee, J. A.; Lee, H. J.; Lee, K. R.; Chromatographia2004, 60, 93.
10. Salem, I. I.; Idrees, J.; Al Tamimi, J. I.; J. Chromatogr., B2004, 799, 103.
11. Pistos, C.; Koutsopoulou, M.; Panderi, I.; Biomed. Chromatogr.
2005, 19, 394.
12. Yüzüak, N.; Özden, T.; Eren, S.; Özilhan, S.; Chromatographia
2007, 66, S165.
13. Chakradhar, L.; Kallem, R.; Karthik, A.; Tripura Sundari, B.; Ramesh, S.; Mullangi, R.; Srinivas, N. R.; Biomed. Chromatogr.
2008, 22, 58.
14. Kovařìková, P.; Klimeš, J.; Dohnal, J.; Tisovská, L.; J. Pharm. Biomed. Anal.2004, 36, 205.
15. Khan, M. A.; Sinha, S.; Vartak, S.; Bhartiya, A.; Kumar, S.; J. Pharm. Biomed. Anal.2005, 39, 928.
16. Kolte, B. L.; Raut, B. B.; Deo, A. A.; Bagool, M. A.; Shinde, D. B.; J. Sep. Sci.2005, 28, 2076.
17. Pathare, D. B.; Jadhav, A. S.; Shingare, M. S.; Chromatographia
2007, 66, 639.
18. Pawar, S. P.; Meshram, G. A.; Phadke, M. U.; Chromatographia
2008, 68, 1063.
19. Khan, I. U.; Aslam, F.; Ashfaq, M.; Asghar, M. N.; J. Anal. Chem.2009, 64, 171.
20. Jain, D.; Jain, S.; Jain, D.; Amin, M.; J. Chromatogr. Sci.2008, 46, 501.
21. Bansal, G.; Singh, M.; Jindal, K. C.; Singh, S.; J. Pharm. Biomed. Anal.2008, 48, 788.
22. Ma, H. L.; Xu, M. T.; Qu, P.; Ma, X. H.; Yaoxue Xuebao (Acta Pharm. Sinica)2005, 40, 750.
23. Patel, J. R.; Suhagia, B. N.; Patel, M. M.; Asian J. Chem.2006, 18, 2873.
24. Altinöz, S.; Tekeli, D.; J. Pharm. Biomed. Anal.2001, 24, 507. 25. ICH Q2(R1), International Conference on Harmonization, Validation of analytical procedures: Text and methodology, 2005.
26. Youden, W. J.; Steiner, E. H.; Statistical Manual of the AOAC, 48th ed., Association of Oficial Analytical Chemists:
Arlington, VA, 1975.
27. Frick, A.; Möller, H.; Wirbitzki, E.; Eur. J. Pharm. Biopharm.
1998, 46, 305.
Submitted: June 16, 2010
Published online: September 30, 2010