ACPD
13, 633–688, 2013Dehydration in the TTL from match
estimates
Y. Inai et al.
Title Page
Abstract Introduction
Conclusions References
Tables Figures
◭ ◮
◭ ◮
Back Close
Full Screen / Esc
Printer-friendly Version Interactive Discussion
Discussion
P
a
per
|
Dis
cussion
P
a
per
|
Discussion
P
a
per
|
Discussio
n
P
a
per
|
Atmos. Chem. Phys. Discuss., 13, 633–688, 2013 www.atmos-chem-phys-discuss.net/13/633/2013/ doi:10.5194/acpd-13-633-2013
© Author(s) 2013. CC Attribution 3.0 License.
Atmospheric Chemistry and Physics Discussions
This discussion paper is/has been under review for the journal Atmospheric Chemistry and Physics (ACP). Please refer to the corresponding final paper in ACP if available.
Dehydration in the tropical tropopause
layer estimated from the water vapor
match
Y. Inai1, F. Hasebe2, M. Fujiwara2, M. Shiotani3, N. Nishi4, S.-Y. Ogino5, H. V ¨omel6, S. Iwasaki7, and T. Shibata8
1
Graduate School of Science, Tohoku University, Sendai, Japan 2
Faculty of Environmental Earth Science, Hokkaido University, Sapporo, Japan 3
Research Institute for Sustainable Humanosphere, Kyoto University, Uji, Japan 4
Geophysical Institute, Kyoto University, Kyoto, Japan 5
Japan Agency for Marine-Earth Science and Technology, Yokosuka, Japan 6
GRUAN Lead Center, Deutscher Wetterdienst, Lindenberg, Germany 7
Department of Earth and Ocean Science, National Defense Academy, Yokosuka, Japan 8
Graduate School of Environmental Studies, Nagoya University, Nagoya, Japan
Received: 22 November 2012 – Accepted: 13 December 2012 – Published: 8 January 2013
Correspondence to: Y. Inai ([email protected])
ACPD
13, 633–688, 2013Dehydration in the TTL from match
estimates
Y. Inai et al.
Title Page
Abstract Introduction
Conclusions References
Tables Figures
◭ ◮
◭ ◮
Back Close
Full Screen / Esc
Printer-friendly Version Interactive Discussion
Discussion
P
a
per
|
Dis
cussion
P
a
per
|
Discussion
P
a
per
|
Discussio
n
P
a
per
|
Abstract
Variation in stratospheric water vapor is controlled mainly by the dehydration process in the tropical tropopause layer (TTL) over the western Pacific; however, this process is poorly understood. To address this shortcoming, in this study the match method is applied to quantify the dehydration process in the TTL over the western Pacific. The
5
match pairs are sought from the Soundings of Ozone and Water in the Equatorial Re-gion (SOWER) campaign network observations using isentropic trajectories. For the pairs identified, extensive screening procedures are performed to verify the represen-tativeness of the air parcel and the validity of the isentropic treatment, and to check for possible water injection by deep convection, consistency between the sonde data and
10
analysis field, and conservation of the ozone content. Among the pairs that passed the screening test, we found some cases corresponding to the first quantitative value of dehydration associated with horizontal advection in the TTL. The statistical features of dehydration for the air parcels advected in the lower TTL are derived from the match pairs. Match analysis indicates that ice nucleation starts before the relative humidity
15
with respect to ice (RHice) reaches 207±81 % (1σ) and that the air mass is dehy-drated until RHice reaches 83±30 % (1σ). The efficiency of dehydration is estimated as the relaxation time required for the relative humidity of the supersaturated air parcel to approach the saturation state. This is empirically estimated from the match pairs as the quantity that reproduces the second water vapor observation, given the first
ob-20
served water vapor amount and the history of the saturation mixing ratio of the match air mass exposed during the advection. The relaxation time is found to range from 2 to 3 h, which is consistent with previous studies.
1 Introduction
Water vapor has strong absorption/emission bands in the infrared region; accordingly,
25
ACPD
13, 633–688, 2013Dehydration in the TTL from match
estimates
Y. Inai et al.
Title Page
Abstract Introduction
Conclusions References
Tables Figures
◭ ◮
◭ ◮
Back Close
Full Screen / Esc
Printer-friendly Version Interactive Discussion
Discussion
P
a
per
|
Dis
cussion
P
a
per
|
Discussion
P
a
per
|
Discussio
n
P
a
per
|
important role in the radiation balance of the Earth (e.g. Forster and Shine, 1999; Solomon et al., 2010), and it influences atmospheric chemistry via its product, the hydroxyl radical (OH) (Stenke and Grewe, 2005), and via polar stratospheric clouds (PSCs) (Saitoh et al., 2006).
The distribution of stratospheric water vapor is roughly understood as the sum of the
5
production of water vapor caused by methane oxidation and transport into the strato-sphere of dehydrated dry air through the tropical tropopause region (Kley et al., 2000). The former mechanism is well understood, whereas the dehydration process in the tropical tropopause region is somewhat unclear despite the fact that it is considered a key factor for understanding stratospheric water vapor, including its unexplained
long-10
term change (Oltmans and Hofmann, 1995; Kley et al., 2000; Oltmans et al., 2000; Scherer et al., 2008; Fujiwara et al., 2010; Hurst et al., 2011).
In the late 1990s, many studies investigated the transition in meteorological features that occurs within a layer of several kilometers in height from the troposphere to the stratosphere in the tropics, and the findings of these studies resulted in the concept
15
of the tropical tropopause layer (TTL; e.g. Highwood and Hoskins, 1998; Fueglistaler et al., 2009). In turn, this resulted in an innovative hypothesis, the “cold trap” de-hydration hypothesis, regarding the nature of dede-hydration processes in the tropical tropopause region. That is, air is dehydrated during horizontal advection through the cold trap region in the western tropical Pacific (Holton and Gettelman, 2001). This cold
20
trap dehydration hypothesis, by considering quasi-isentropic motion, indicates that the local temperature minimum can effectively dehydrate the air mass entering the strato-sphere. This hypothesis was supported by General Circulation Model (GCM) simula-tions (Hatsushika and Yamazaki, 2003). As a result, this dehydration process is con-sidered to be efficiently driven by equatorially symmetric atmospheric gyres and by the
25
“cold trap” that forms in the TTL as a response to heating at the lower boundary in the western tropical Pacific (Matsuno-Gill pattern; Matsuno, 1966; Gill, 1980).
ACPD
13, 633–688, 2013Dehydration in the TTL from match
estimates
Y. Inai et al.
Title Page
Abstract Introduction
Conclusions References
Tables Figures
◭ ◮
◭ ◮
Back Close
Full Screen / Esc
Printer-friendly Version Interactive Discussion
Discussion
P
a
per
|
Dis
cussion
P
a
per
|
Discussion
P
a
per
|
Discussio
n
P
a
per
|
the Lagrangian relative humidity history along trajectories with simplified condensation and a water-removal scheme. European Centre for Medium-Range Weather Forecasts (ECMWF) ERA-40 and ERA-Interim were used in the former and latter studies, re-spectively. Reasonable results were obtained, yielding good agreement with satellite observations of the seasonal cycle and the amount of zonal mean water vapor.
How-5
ever, supersaturation equivalent to 140 %–180 % (M ¨ohler et al., 2003) or 120 %–200 % (Murray et al., 2010) in relative humidity with respect to ice (RHice) at a temperature of 240–180 K is reported from studies based on laboratory experiments. A value of RHice of up to 200 % or more at <200 K has been reported from studies based on aircraft measurements (Jensen et al., 2005; Kr ¨amer et al., 2009). Supersaturation is
10
also observed in environments with ice crystals, reaching approximately 60 % or more in the TTL based on sonde observations (Hasebe et al., 2012; Inai et al., 2012; Shibata et al., 2007, 2012). These results suggest the need for a quantitative investigation of the efficiency of the cold trap dehydration.
Variations in stratospheric water vapor are poorly understood, as described above.
15
To address this issue, we require reliable in situ observations of stratospheric wa-ter vapor with high vertical resolution, in addition to space-borne observations (e.g. Read et al., 2004; Steinwagner et al., 2010; Takashima et al., 2010). To this end, we have been conducting the Soundings of Ozone and Water in the Equatorial Region (SOWER) project using radiosondes, ozonesondes, and chilled-mirror hygrometers in
20
the western tropical Pacific (see Sect. 2; Hasebe et al., 2007; Fujiwara et al., 2010; a companion paper: Hasebe et al., 2012). The data from SOWER campaigns, together with trajectory calculations, indicate that the observed water vapor mixing ratio is about 160 % as much as the minimum saturation mixing ratio that air parcels experienced during 7-day advection in the altitude region from the 360 to 365 K potential
tempera-25
ACPD
13, 633–688, 2013Dehydration in the TTL from match
estimates
Y. Inai et al.
Title Page
Abstract Introduction
Conclusions References
Tables Figures
◭ ◮
◭ ◮
Back Close
Full Screen / Esc
Printer-friendly Version Interactive Discussion
Discussion
P
a
per
|
Dis
cussion
P
a
per
|
Discussion
P
a
per
|
Discussio
n
P
a
per
|
air mass more than once at a given interval; the idea of the match method applied to the ozone depletion by von der Gathen et al. (1995) and Rex et al. (1997, 1998). In the present study, observation pairs with the same air mass (defined as match pairs) are sought among the SOWER data for the purpose of quantifying the “cold trap” dehy-dration. The application of the match technique may yield an improved understanding
5
of TTL dehydration; however, there are problems to be overcome (see the last part of Sect. 3.1).
This paper reports the results of a match analysis and provides a discussion on the findings. The remainder of the manuscript is organized as follows. Section 2 intro-duces the SOWER sounding data, and Sect. 3 describes the method used to identify
10
matches in the TTL. In Sect. 4, the extracted match cases are introduced along with evidence regarding the features of dehydration in the TTL. In Sect. 5, the efficiency of the dehydration is discussed. Finally, the conclusions are presented in Sect. 6.
2 SOWER project and data description
In the tropical western Pacific/Indonesian region, SOWER campaigns have been
con-15
ducted during every boreal winter since December 2004 with the intention of accumu-lating ozone and water vapor data in the TTL for studies on cold trap dehydration. The network of observation stations is designed to capture the air mass advected in the tropical western Pacific/Indonesian region along the mean air flow in the TTL. Cryo-genic Frostpoint Hygrometers (CFH; V ¨omel et al., 2007) and the Snow White
hygrom-20
eters (SW; Fujiwara et al., 2003; V ¨omel et al., 2003), equipped with RS80 radiosondes, have been launched in SOWER campaigns to obtain reliable water vapor data in the TTL. In addition, the ozone partial pressure has been measured by the Electrochemical Concentration Cell (ECC) ozonesonde.
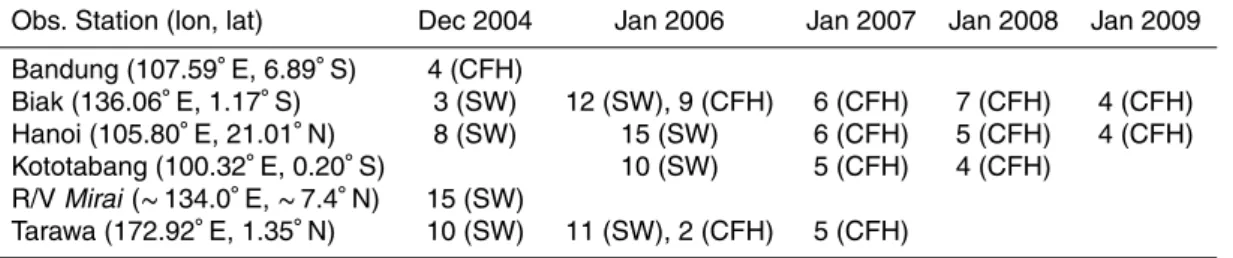
Table 1 provides an outline of water vapor sounding during the SOWER campaigns
25
ACPD
13, 633–688, 2013Dehydration in the TTL from match
estimates
Y. Inai et al.
Title Page
Abstract Introduction
Conclusions References
Tables Figures
◭ ◮
◭ ◮
Back Close
Full Screen / Esc
Printer-friendly Version Interactive Discussion
Discussion
P
a
per
|
Dis
cussion
P
a
per
|
Discussion
P
a
per
|
Discussio
n
P
a
per
|
water vapor measurements. As its cooling ability is limited, the SW cannot measure wa-ter vapor above about 15 km or about the 360 K potential temperature level. The CFH is developed by the University of Colorado and the National Oceanic and Atmospheric Association (NOAA) for high-quality measurements of stratospheric water vapor. The uncertainty of CFH measurements is estimated to be approximately 0.5 K in terms of
5
frost point and less than 9 % in terms of mixing ratio in the TTL (V ¨omel et al., 2007); the equivalent uncertainties for the SW are somewhat larger. We tentatively assume that the accuracy of water vapor measurements is±10 % and±1 ppmv. The accuracy of ozonesonde measurements is about ±10 % in the TTL, and the response time is 20–30 s from the troposphere to the stratosphere (Smit et al., 2007). The accuracy of
10
the corresponding background current of ECC is±10 ppbv in the TTL, following V ¨omel and Diaz (2010).
ECMWF operational analysis data are used to calculate trajectories (see Sect. 3.1). The data are gridded horizontally to a 1.0◦ latitude–longitude resolution with 60 (for December 2004 and January 2006) or 91 (for January 2007, 2008, and 2009) model
15
levels in the vertical. The temporal resolution is 6 h. For the detection of convective clouds, the values of equivalent black body temperature (Tbb) are estimated from satel-lite (Geostationary Operational Environmental Satelsatel-lite-9: GOES-9 and Multi-functional Transport Satellite-1 Replacement: MTSAT-1R) IR images (Channel 1: 10.3–11.3 µm) with latitude–longitude grid spacings of 0.05◦ (for 70◦N–20◦S, 70◦E–150◦E) or 0.25◦
20
(for 70◦N–70◦S, 70◦E–150◦W) with a 1-h time interval (http://weather.is.kochi-u.ac.jp/). The water vapor mixing ratio and the saturation mixing ratio are estimated from satu-ration water pressure corresponding to the frost point and atmospheric temperatures, respectively, using the Goff–Gratch equation (Goffand Gratch, 1946; List, 1984).
The SOWER data are analyzed after applying the pressure correction method
follow-25
ACPD
13, 633–688, 2013Dehydration in the TTL from match
estimates
Y. Inai et al.
Title Page
Abstract Introduction
Conclusions References
Tables Figures
◭ ◮
◭ ◮
Back Close
Full Screen / Esc
Printer-friendly Version Interactive Discussion
Discussion
P
a
per
|
Dis
cussion
P
a
per
|
Discussion
P
a
per
|
Discussio
n
P
a
per
|
3 Water vapor match
The match cases (i.e. the observation pairs that had measured the water vapor amounts for the same air mass twice) are searched for among the SOWER campaigns (the numbers of soundings are listed in Table 1). This search is conducted using tra-jectory calculations (Sect. 3.1) and intensive screening procedures (Sect. 3.3 and
Ap-5
pendix A). After applying these procedures, the amount of change in the water vapor mixing ratio is quantified using the match cases.
3.1 Definition of matched air parcels
The values observed by sonde are assumed to represent those of the air parcel within a circle with a radius of 1◦ latitude–longitude (i.e. the match radius) centered at the
10
observation station. The circular region covers∼200 km in diameter. This assumption is supported by the fact that the vertical profiles of variables measured by sonde during ascent and descent are in agreement with each other. The air parcel is composed of a number of air segments gridded at every 0.1◦×0.1◦latitude–longitude in the circular area defined by the match radius. The air mass observed by sonde is assumed to
15
be expressed by a set of these air segments. Consequently, the air mass that may encounter deformation during advection can be estimated along with the uncertainty of the trajectory calculation. Isentropic trajectories are initialized at each segment at 50 min after the launch. This time delay corresponds to the time taken for the sonde to reach the TTL; i.e. the altitudes of 15 and 18 km for standard ascending rates of 5 and
20
6 m s−1, respectively.
The isentropic trajectories are calculated by integrating the isentropic wind velocities at 1-h intervals for 10 days at every 0.2 K potential temperature level from 350.0 to 360.0 K, and at every 1.0 K level from 360.0 to 400.0 K by using the ECMWF field. Note that the ECMWF data are 6-hourly; hence, the linearly interpolated ECMWF field is
25
ACPD
13, 633–688, 2013Dehydration in the TTL from match
estimates
Y. Inai et al.
Title Page
Abstract Introduction
Conclusions References
Tables Figures
◭ ◮
◭ ◮
Back Close
Full Screen / Esc
Printer-friendly Version Interactive Discussion
Discussion
P
a
per
|
Dis
cussion
P
a
per
|
Discussion
P
a
per
|
Discussio
n
P
a
per
|
at 50 min after the launch), they are assumed to constitute a match air parcel. This means that each match air parcel is defined by a cluster of air segments included in both the first and second match circular areas. The trajectories are calculated in two ways (forward and backward), and we only consider those cases for which the match air parcels could be defined in both ways. The matches are finally confirmed after applying
5
the screening processes described below (Sect. 3.3 and Appendix A).
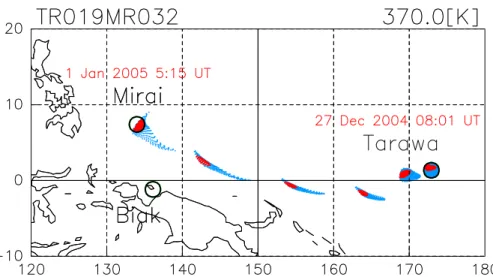
Figure 1 is an example of a match air parcel identified using forward trajectories. The air parcel observed over Tarawa on 27 December 2004 (first observation) was ob-served again (second observation) over Mirai after about 5 days. We sought to identify observation pairs connected by trajectories, as shown in Fig. 1, among all the
obser-10
vations listed in Table 1. Figure 2 shows scatter plots of the mixing ratio for the first and second observations of ozone and water vapor from such observation pairs. Figure 2 shows that, in addition to the general tendency of higher ozone mixing ratio and lower water vapor mixing ratio at higher altitudes, the data for water vapor are located more to the lower right, indicating a decrease in the water amount (dehydration) during the
15
successive observations; in contrast, the data for ozone are distributed more or less symmetrically with respect to the diagonal.
3.2 Ozone conservation
The odd oxygen Ox (=O+O3) has a very long photochemical lifetime of more than one year in the lower stratosphere (Brasseur and Solomon, 1986) and even longer
20
in the TTL. The photolysis of O2 yields an ozone production rate ranging from about 0.1 ppbv day−1 at the 355 K potential temperature level to about 2.4 ppbv day−1 at the 400 K level, being dependent on altitude (Dessler, 2002). In the stratosphere, where there is little nitrogen oxide, hydrogen oxide acts as a catalyst for ozone. In contrast in the troposphere, it reacts with nitrogen oxide, producing odd oxygen. In the TTL, the
25
ACPD
13, 633–688, 2013Dehydration in the TTL from match
estimates
Y. Inai et al.
Title Page
Abstract Introduction
Conclusions References
Tables Figures
◭ ◮
◭ ◮
Back Close
Full Screen / Esc
Printer-friendly Version Interactive Discussion
Discussion
P
a
per
|
Dis
cussion
P
a
per
|
Discussion
P
a
per
|
Discussio
n
P
a
per
|
for several days within the range of uncertainty of ECC measurements (see Sect. 2), as long as the air parcel retains its identity.
Before examining the match results in detail, it is interesting to assess whether the air parcels identified as “match” retain their identity during advection. To minimize possible chemical/dynamical effects, we only consider cases for which the time interval between
5
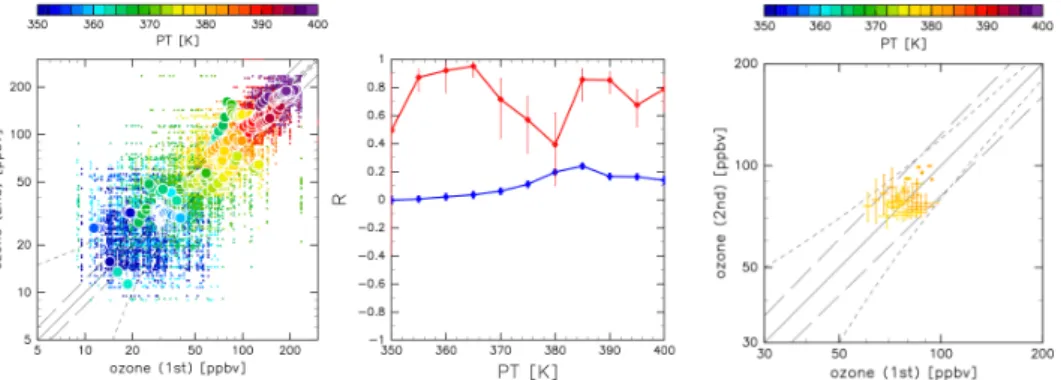
the first and second observations is less than 3 days. Figure 3 (left) shows a scatter plot of the ozone mixing ratio between all possible pairs (i.e. all possible combinations of observations, sorted by potential temperature and campaign) of the observed ozone mixing ratio on every 1 K potential temperature surface between 350 and 400 K. Fig-ure 3 (center) shows the correlation coefficients between the first and second ozone
10
mixing ratios for observations paired by trajectories shorter than 3 days, as a function of the advected potential temperature, and it also shows the correlation coefficients be-tween all the possible pairs of observations. The correlation coefficients are calculated on a logarithmic scale because the ozone mixing ratio shows an exponential increase with altitude. The correlation coefficients for the observation pairs connected by
trajec-15
tories shorter than 3 days are significantly higher than those for all the possible pairs, except at the 350 and 380 K levels. The exemption at the 350 K level may arise because this level has a relatively high frequency of convective penetration. Consequently, it is necessary to carefully examine whether convections reached the match air parcels (see Sect. 3.3). For the 380 K level, the ozone mixing ratios measured by the first and
20
second observations are similar for all cases with time intervals (between the first and second observations) of less than 3 days. Therefore, the distribution of data in these plots is near-spherical, as shown in the right panel of Fig. 3, thereby yielding a low correlation coefficient.
As the background amount of ozone is around 20 ppbv at 350 K and more than
25
100 ppbv at 400 K, as shown in Fig. 2, the uncertainty in ECC, which is ±10 % or
ACPD
13, 633–688, 2013Dehydration in the TTL from match
estimates
Y. Inai et al.
Title Page
Abstract Introduction
Conclusions References
Tables Figures
◭ ◮
◭ ◮
Back Close
Full Screen / Esc
Printer-friendly Version Interactive Discussion
Discussion
P
a
per
|
Dis
cussion
P
a
per
|
Discussion
P
a
per
|
Discussio
n
P
a
per
|
air parcel retains its identity. In this study, the values equivalent to twice the uncertainty (i.e. ±20 % or ±20 ppbv) are employed as the threshold of the acceptable difference in the ozone mixing ratio between the first and second observations. We use “ozone conservation” as the second principle in the screening procedure for match pairs. Note that this principle is applied after the first principle (the representativeness) during the
5
screening procedure (see Sect. 3.3).
3.3 Screening of match pairs
The effectiveness of pairing the observations by trajectories, using the ozone mixing ratio as a conserved property, is confirmed in Sect. 3.2. Before applying the match technique to dehydration in the TTL, we sought to screen out false match pairs. The
10
problems addressed by the screening procedure are the representativeness of the match air parcel, the degree of convective penetration, the validity of the isentropic treatment, and the consistency between sonde data and the analysis field.
Representativeness of match air parcel
A match air parcel that is composed of segments common to the first and second
15
circular areas defined by a match radius (match air segments: see Sect. 3.1) must be representative of the circular area for both observations. Otherwise, the meteorological values measured at the first or second observations cannot be considered as those of a match air parcel. Consequently, it is important to examine the representativeness of the match air parcel. The representativeness is examined based on the temperature
20
ACPD
13, 633–688, 2013Dehydration in the TTL from match
estimates
Y. Inai et al.
Title Page
Abstract Introduction
Conclusions References
Tables Figures
◭ ◮
◭ ◮
Back Close
Full Screen / Esc
Printer-friendly Version Interactive Discussion
Discussion
P
a
per
|
Dis
cussion
P
a
per
|
Discussion
P
a
per
|
Discussio
n
P
a
per
|
Convective penetration
The possible penetration of the deep convection is diagnosed by comparing the tem-peratures of the match air segments (T) and the equivalent blackbody temperature of the underlying cloud (Tbb). If we assume monotonously decreasing atmospheric tem-perature with increasing altitude, we may consider that the top of the convection is
5
higher than the altitude of the advected air segment whenTbb minusT (≡δTbb) is neg-ative. However, it is well known that observed values of Tbb tend to overestimate the cloud top temperature; i.e. to underestimate the cloud top altitude (e.g. Sherwood et al., 2004). To address this problem, we add some margin toδTbb values for the diagnosis of convective penetration, as described below. If some deep convective clouds reach
10
match air segments that advected in the TTL, some part of the segments will be mixed with the tropospheric air mass, thereby changing the ozone mixing ratio. Thus, the degree of inconsistency between the ozone mixing ratios at the first and second obser-vations (for observational pairs) could be used as an indicator of convective mixing. To statistically quantify such inconsistencies, we use the correlation coefficients between
15
the ozone mixing ratios of the first and second observations as a function of the mini-mum value ofδTbb during the advection. In this screening procedure, we adopt+12 K as the critical value of the margin for the minimum value ofδTbb during the advection (see Appendix A2 for details).
Validity of the isentropic treatment
20
Our trajectory calculations are made under the assumption of adiabatic conditions; however, this assumption becomes invalid with increasing advection time, because ra-diative heating or cooling occurs in the TTL depending on the altitude and cloud condi-tions. Therefore, we need to establish an upper limit of advection time that ensures the validity of the isentropic treatment and that is acceptable for our match analysis. This
25
ACPD
13, 633–688, 2013Dehydration in the TTL from match
estimates
Y. Inai et al.
Title Page
Abstract Introduction
Conclusions References
Tables Figures
◭ ◮
◭ ◮
Back Close
Full Screen / Esc
Printer-friendly Version Interactive Discussion
Discussion
P
a
per
|
Dis
cussion
P
a
per
|
Discussion
P
a
per
|
Discussio
n
P
a
per
|
observed ozone mixing ratios are calculated as a function of the advection time of the match air parcels. We choose 5 days as the threshold of advection-time length (see Appendix A3 for details).
Consistency between sonde data and analysis field
The saturation water vapor mixing ratio (SMR) is estimated from the temperature field
5
of the meteorological objective analysis (ECMWF data are used in this study) along the trajectories. Bias between the sonde data and analysis field would result in erro-neous conclusions, including false initialization of trajectory calculations. Inconsisten-cies between these factors could also arise from small-scale perturbations that are not resolved in the analysis field but are detected by sonde observations. We could reduce
10
such differences by using an isentropic coordinate system, because the air parcels stay on an isentrope even when displaced by small-scale transient waves, such as gravity waves. However, temperature and pressure disturbances associated with the adiabatic motion appear on the isentropes. If the temperature difference between the sonde and analysis field on the same potential temperature surface is large, then the
15
dehydration process cannot be discussed by using both the water vapor mixing ratio measured by sonde and the saturation water vapor mixing ratio estimated from the analysis field. In addition, errors may exist in one or both of the data sets. Therefore, it is important to check for consistency between the sonde data and the analysis field. The consistency is assessed by calculating the correlation coefficients between the
20
first and second ozone mixing ratios as a function of the difference in temperature be-tween the ECMWF analysis and sonde data. We consider temperature differences of between−4.0 and 5.0 K for assessing the consistency between the sonde data and analysis field (see Appendix A4 for details). These temperature differences correspond to saturation water vapor mixing ratios of∼1 to∼6 ppmv in the TTL.
ACPD
13, 633–688, 2013Dehydration in the TTL from match
estimates
Y. Inai et al.
Title Page
Abstract Introduction
Conclusions References
Tables Figures
◭ ◮
◭ ◮
Back Close
Full Screen / Esc
Printer-friendly Version Interactive Discussion
Discussion
P
a
per
|
Dis
cussion
P
a
per
|
Discussion
P
a
per
|
Discussio
n
P
a
per
|
4 Dehydration estimated from the match
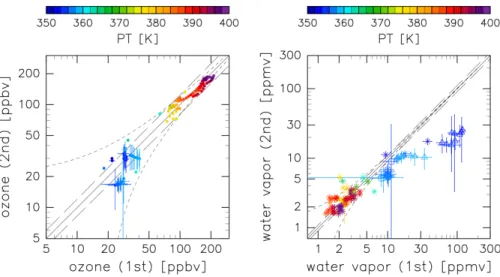
The water vapor match in the TTL is defined by trajectory calculations and the screen-ing procedures described in Sect. 3. In this section, we discuss the amounts of water vapor change quantified from the match cases. Figure 4 shows scatter plots of the first and second observations of the ozone and water vapor mixing ratios for 110 identified
5
matches. Note that this number includes matches of observational pairs and potential temperature levels. Among the 110 matches are 26 different observational pairs. The values for water vapor are similar between the first and second observations at poten-tial temperature levels above 365 K (right panel), which suggests that the water vapor mixing ratios show little change. In turn, this means that we found no dehydrated cases
10
in the altitude region where the amount of water vapor entering the stratosphere is con-trolled. The reasons why no such cases were found are discussed in Sect. 5.4. Below the 360 K level, almost all of the cases show smaller water vapor amounts for the sec-ond observation than for the first. This result represents the first piece of evidence from the water vapor match that appreciable dehydration occurred at these levels. In the
15
following sections, the match cases are analyzed, focusing on hydration and dehydra-tion during advecdehydra-tion. Detailed case studies are presented in Sect. 4.1, while statistical features of the dehydration are derived in Sect. 4.2.
4.1 Detailed case studies
Figure 5 shows an example of a match between the first (01:42 UT, 11 January 2007)
20
and second observations (00:37 UT, 15 January 2007), both at Kototabang. The match air parcel advected for approximately 4 days at 371.0 K. The water vapor mixing ratios were measured by CFH, and the values are 3.1±0.3 ppmv for the first observation (left-hand red bar in (b)) and 3.4±0.3 ppmv for the second (right-hand red bar). Therefore, the water vapor amount was conserved during the advection. The histories of pressure,
25
ACPD
13, 633–688, 2013Dehydration in the TTL from match
estimates
Y. Inai et al.
Title Page
Abstract Introduction
Conclusions References
Tables Figures
◭ ◮
◭ ◮
Back Close
Full Screen / Esc
Printer-friendly Version Interactive Discussion
Discussion
P
a
per
|
Dis
cussion
P
a
per
|
Discussion
P
a
per
|
Discussio
n
P
a
per
|
underlying atmosphere, corresponding to the advected air parcels. Isentropic backward trajectories, color-coded by the SMR, are shown in (e) in Fig. 5. Panel (d) in Fig. 5 shows vertical profiles of water vapor observed at the first (orange) and second (red) sonde observations, along with uncertainties. While the SMR of the match air mass, as estimated from the analysis field, reaches about 6.5 ppmv on the two days after the first
5
observation, it is possible that the air mass experienced supersaturation on 11, 13, and 14 January 2007. The SMR during these periods may have become smaller than the measured water vapor mixing ratio. Because this case is a match on a 371.0 K potential temperature level, the screening procedure for convective penetration (Appendix A2) is not applied. However, the values ofTbb are appreciably larger than those of the match
10
air mass (≤195 K). In other words, the values ofTbb are high enough to keep the air mass away from the area of convection.
In this case, it is possible that the air mass was exposed to supersaturation dur-ing the advection, as described above, while the water vapor amount of the air mass was conserved. If we assume that nucleation of ice particles was not initiated at any
15
period of the advection, the estimated maximum value of RHice during the advection is 124 % with an uncertainty of −17 %/+16 % when the SMR becomes the minimum value (SMRmin), taking a value of 2.6 ppmv.
Figure 6 is the same as Fig. 5 but for the match case from Tarawa (03:48 UT, 13 December 2004) to Mirai (05:17 UT on 16 December 2004) on the 356.4 K potential
20
temperature surface with an advection time of about 3 days. The water vapor mixing ratios are 10.2±1.9 ppmv (the first observation) and 5.3±1.3 ppmv (the second), indi-cating some dehydration during advection.
The time evolution of SMR has small perturbations with an SMRminvalue of 6.5 ppmv at about 5 h before the second observation. At this time, the temperature of the air
25
de-ACPD
13, 633–688, 2013Dehydration in the TTL from match
estimates
Y. Inai et al.
Title Page
Abstract Introduction
Conclusions References
Tables Figures
◭ ◮
◭ ◮
Back Close
Full Screen / Esc
Printer-friendly Version Interactive Discussion
Discussion
P
a
per
|
Dis
cussion
P
a
per
|
Discussion
P
a
per
|
Discussio
n
P
a
per
|
hydrated, this case indicates that ice nucleation must have started before the RHice value reached 157 %; in other words, the upper limit of RHice is estimated to be 157 % from this match case. A comparison between the second water vapor observation and SMRmin suggests that dehydration continued until RHice reached 82 % with an uncer-tainty of±20 %. If the dehydration does not proceed to less than 100 % of RHice, the
5
temperature of the air mass must have decreased by about 1.2 K from the tempera-ture 195.4 K, when the air mass is coldest, falling to 194.2 K on the 356.4 K potential temperature surface.
Information on the existence of ice particles is important when interpreting the RHice value in terms of dehydration efficiency. For this purpose, we use the backscattering
co-10
efficients observed by lidar installed on the research vesselMirai. According to Fig. 3 of Fujiwara et al. (2009), cirrus clouds were observed at around the 355 K potential tem-perature level (about 15.5 km height) when the sonde measured this particular match air mass. The cirrus clouds may have resulted from dehydration of the match air mass shown in Fig. 6, meaning that the match air mass may have experienced a temperature
15
below 194.2 K.
Figure 7 is the same as Fig. 5 but for the match from Biak (09:46 UT, 15 January 2008) to Hanoi (06:45 UT, 20 January 2008) on the 350.4 K potential temperature sur-face with an advection time of about 5 days. The observed water vapor mixing ratios are 37.7±5.6 ppmv (the first observation) and 17.5±1.9 ppmv (the second), indicating
20
appreciable dehydration during advection.
This match air mass has also experienced an SMR value smaller than the first ob-served water vapor mixing ratio. The SMRmin value of 15.1 ppmv is estimated just be-fore 00:00 UT on 18 January 2008 (2.5 days after the first observation). A comparison between the water vapor mixing ratio measured at the first observation and the SMRmin
25
value suggests that the RHice value should not exceed 249 % with an uncertainty of
ACPD
13, 633–688, 2013Dehydration in the TTL from match
estimates
Y. Inai et al.
Title Page
Abstract Introduction
Conclusions References
Tables Figures
◭ ◮
◭ ◮
Back Close
Full Screen / Esc
Printer-friendly Version Interactive Discussion
Discussion
P
a
per
|
Dis
cussion
P
a
per
|
Discussion
P
a
per
|
Discussio
n
P
a
per
|
116 % with uncertainty of±12 % when the SMR attains the minimum value. This result suggests that the air mass was dehydrated down to 116 % RHice when the air mass experienced SMRmin. The SMR history of this match air mass and the water vapor mix-ing ratios observed at the first and second observations are discussed again in Sect. 5, along with a description of the procedure for estimating the efficiency of dehydration.
5
While some of the match cases detected reduction or conservation of the water va-por amount, others showed increase, probably due to convective penetration. Although a screening procedure for convective penetration was applied, it was not applied above the 370 K level, as explained in Appendix A2. An example of a hydrated case is pro-vided in Fig. 8, which shows the vertical profiles of frost point temperature (red),
tem-10
perature (black), and ozone mixing ratio (green) at the second observation of a match case. This match case is identified at altitudes ranging from potential temperatures of 378 to 383 K. The thin humid layer around 380 K shown in Fig. 8 may result from the penetration of some deep convection. A similar water vapor profile, affected by con-vective penetration, has been reported by Khaykin et al. (2009) during the monsoon
15
season over West Africa. These authors investigated the features of water vapor and ozone profiles in the case that deep convections penetrated into the TTL. However, it is puzzling in our case that the ozone mixing ratio (green) in Fig. 8 shows a monotonous increase with increasing altitude, reaching as high as 80 ppbv at the hydrated layer. Such a large amount of ozone is inconsistent with the idea that the air mass originated
20
from convection (Folkins et al., 2002). One possible explanation of the puzzling corre-lation between water vapor and the ozone profiles is that the convection is injected into an altitude above 380 K where the ozone profile has a local minima after which only ice particles fall to below the 380 K level and evaporate there.
4.2 Statistical features of dehydration
25
ACPD
13, 633–688, 2013Dehydration in the TTL from match
estimates
Y. Inai et al.
Title Page
Abstract Introduction
Conclusions References
Tables Figures
◭ ◮
◭ ◮
Back Close
Full Screen / Esc
Printer-friendly Version Interactive Discussion
Discussion
P
a
per
|
Dis
cussion
P
a
per
|
Discussion
P
a
per
|
Discussio
n
P
a
per
|
as discussed using the dehydrated cases. In this section, the statistical features of the dehydration in the TTL are examined.
Figure 9 shows a scatter plot of the ratio of the water vapor mixing ratio at the first ob-servation to SMRmin estimated from the SMR history during the advection (abscissa), versus the ratio of the water vapor mixing ratio at the second observation to SMRmin
5
(ordinate), for all match pairs. The colors indicate potential temperatures. The cases for which the water amount was conserved plot on the diagonal, while dehydrated cases plot in the lower right part of the figure. The match cases for which the first (the sec-ond) water vapor mixing ratio coincides with SMRmin appear on the black line oriented vertically (horizontally).
10
The match cases above 370 K potential temperature plot near the diagonal line and in a square-shaped region at lower left. These features indicate that the air mass of these cases was never saturated; consequently, the water vapor amounts were con-served. Some cases plot to the upper left of the diagonal, and these hydrated cases may be attributed to the injection of ice particles associated with the convective process
15
and evaporation, as described in Sect. 4.1. At altitudes below the cold point in particu-lar, the hydration process is not only convective penetration but also the sedimentation of ice particles resulting from the upper (i.e. colder) level of cold point dehydration and from evaporation of the particles (e.g. Jensen and Pfister, 2004). The latter hydration process could not be detected in the present study, and is therefore not considered
20
further. The neglecting of this process is unlikely to significantly affect the results, be-cause the absolute amount of water vapor generally shows an exponential decrease with decreasing temperature.
Below the 360 K level, on the other hand, many match pairs plot in the lower-right part of Fig. 9. Such air parcels encounter cold events in which SMRminis smaller than
25
the first observed water vapor mixing ratio (right-hand side of the vertical line), and are eventually dehydrated (lower right, near the diagonal).
ACPD
13, 633–688, 2013Dehydration in the TTL from match
estimates
Y. Inai et al.
Title Page
Abstract Introduction
Conclusions References
Tables Figures
◭ ◮
◭ ◮
Back Close
Full Screen / Esc
Printer-friendly Version Interactive Discussion
Discussion
P
a
per
|
Dis
cussion
P
a
per
|
Discussion
P
a
per
|
Discussio
n
P
a
per
|
RHicewith ongoing dehydration, use all match cases for which the match air mass expe-rienced saturation or supersaturation and then became dehydrated (i.e. cases for which the first observed water vapor amount is larger than both the second observed water vapor amount and SMRmin) in the altitude region from 350 to 360 K. A few cases expe-rienced dehydration and supersaturation above 360 K; however, the number of cases
5
is too small to enable a meaningful statistical analysis. The mean ratio of the water vapor mixing ratio at the first observation to SMRminis calculated to be 207±81 %(1σ) for cases dehydrated below 360 K. The mean ratio of the water vapor mixing ratio at the second observation to SMRmin is calculated to be 83±30 % (1σ). These values suggest that the upper limit of RHice, before ice nucleation starts, is about 207 %, while
10
dehydration continues until RHicereaches, statistically, about 83 % in the altitude region from 350 to 360 K. The implications of these values are discussed in Sect. 5.2.
5 Discussion
In general, tropical convective activities lift air masses from the planetary boundary layer to the level of zero radiative heating. Above the approximately 400 K potential
15
temperature surface, the Brewer–Dobson circulation lifts air masses to the deeper stratosphere. In the TTL, existing between these two regions, the air mass moves hor-izontally with a gradual ascent caused by radiative heating. Rare detrainment of deep convective clouds may occur throughout the TTL, and this is likely to influence the wa-ter vapor concentrations of the TTL to some degree. The local temperature minimum in
20
the TTL (approximately 370 K) over the western Pacific leads to cold trap dehydration. This dehydration process is considered to be the most important process controlling the amount of water vapor entering the stratosphere (e.g. Holton and Gettelman, 2001; Hatsushika and Yamazaki, 2003; Fueglistaler et al., 2009; Hasebe et al., 2012).
A companion paper to the present study, Hasebe et al. (2012), conducted a
statisti-25
ACPD
13, 633–688, 2013Dehydration in the TTL from match
estimates
Y. Inai et al.
Title Page
Abstract Introduction
Conclusions References
Tables Figures
◭ ◮
◭ ◮
Back Close
Full Screen / Esc
Printer-friendly Version Interactive Discussion
Discussion
P
a
per
|
Dis
cussion
P
a
per
|
Discussion
P
a
per
|
Discussio
n
P
a
per
|
seven days. The results showed that the cold trap dehydration progressed with slow diabatic ascent from 360 K to 380 K. In the present study, it is unfortunate that dehy-drated air masses are rare in the altitude region around the 370 K potential temperature surface (the reasons for this are discussed in Sect. 5.4); nonetheless, dehydration as-sociated with horizontal advection is evident in the lower part of the TTL, as revealed
5
by the match technique. The following section discusses the applicability of the screen-ing parameters examined in Sect. 3.3, the two RHice values evaluated as the ratios of the first- and second-observed water vapor mixing ratios against SMRmin in the previ-ous section, the efficiency of dehydration in the lower TTL, and the lack of dehydrated cases near the cold point.
10
5.1 Applicability of screening parameters
In this study, several numerical values of the screening criteria were examined and estimated as screening parameters (Sect. 3.3 and Appendix A). Here, we consider whether the parameters estimated in this study could be applied to other TTL studies that consider different regions or seasons.
15
From 2004, the SOWER campaigns have been conducted in the western Pacific in boreal winter. The spatial–temporal region is convectively active and the TTL is the coldest. The active convection results in a condition in which sub-grid-scale pertur-bations occur, resulting in inconsistencies between meteorological profiles observed by sonde and the meteorological analysis (objective analysis) field, as well as
small-20
scale temperature perturbations on each isentrope in the TTL. Consequently, it is possible that the criteria for “consistency between sonde data and analysis field” (i.e.
−4.0 K≤δT≤5.0 K; see Appendix A4) and “representativeness of the match air parcel” (i.e. the difference between the match air segments and the whole segments inside the match circle is within [−2.0, 2.0] K; see Appendix A1) can be stricter (i.e. these
accept-25
ACPD
13, 633–688, 2013Dehydration in the TTL from match
estimates
Y. Inai et al.
Title Page
Abstract Introduction
Conclusions References
Tables Figures
◭ ◮
◭ ◮
Back Close
Full Screen / Esc
Printer-friendly Version Interactive Discussion
Discussion
P
a
per
|
Dis
cussion
P
a
per
|
Discussion
P
a
per
|
Discussio
n
P
a
per
|
formed in the TTL, resulting in diabatic uplift of the air mass by radiative heating (e.g. Corti et al., 2006). The clouds make it difficult to track the air parcel because isentropic trajectories are used in this study. Therefore, it is possible that the criterion for “validity of the isentropic treatment” (i.e. advection time of less than 5 days; see Appendix A3) can be relaxed in other spatial–temporal regions where cirrus clouds are rarely formed.
5
According to Hamada and Nishi (2010), the relationship betweenTbbvalue and cloud top height is largely independent of the observation season; however, it depends on the satellite zenith angle. The SOWER campaign sites are located from approximately 100◦E to 170◦E and the nadir of MTSAT-1R/GOES-9 is approximately 140◦E; conse-quently, the zenith angles at SOWER campaign sites range from 0◦ to 40◦. This angle
10
may be even larger for the “match-paired air parcels” (Sect. 3.1). Even so, the dif-ference between average cloud top height in the nadir region and in the region with satellite zenith angle around 50◦ is less than 1 km. This difference is not statistically significant, according to Fig. 7 in Hamada and Nishi (2010). Therefore, the criterion for “convective penetration” (i.e.hδTbbimin≥12 K; see Appendix A2) may be applied to
15
studies in different regions and seasons. However, the numerical value of the crite-rion should be re-evaluated when usingTbb data with different resolution from that of MTSAT-1R/GOES-9, such as data observed by MODerate resolution Imaging Spectro-radiometer (MODIS).
5.2 Relative humidity before ice nucleation and after dehydration in the lower
20
TTL
As described in Sect. 4.2, the upper limit of RHice before the initiation of condensa-tion is estimated to be 207±81 % (1σ) from match cases, indicating dehydration in the altitude range from 350 to 360 K in potential temperature. This estimate is based on a meteorological analysis field having finite temporal–spatial resolution; hence,
sub-25
ACPD
13, 633–688, 2013Dehydration in the TTL from match
estimates
Y. Inai et al.
Title Page
Abstract Introduction
Conclusions References
Tables Figures
◭ ◮
◭ ◮
Back Close
Full Screen / Esc
Printer-friendly Version Interactive Discussion
Discussion
P
a
per
|
Dis
cussion
P
a
per
|
Discussion
P
a
per
|
Discussio
n
P
a
per
|
yield an estimate of the air masses being dehydrated to the level of RHice reaching 83±30 % (1σ). If we take this result at face value, TTL dehydration could proceed be-yond the apparent saturation level, although the estimated uncertainty is too large to make conclusive argument. One possible explanation of ice growth under unsaturated conditions is that the value of our estimate is affected by sub-grid-scale temperature
5
perturbations that could not be resolved in our analysis, as described above. Chepfer and Noel (2009) raised the possibility that nitric acid trihydrate (HNO3–3H2O) exists in the TTL, formed below a temperature of approximately 200 K. In such a case, although the interpretation of our results would become even more complex, it may be possible that the dehydration could progress to a RHice state of less than 100 %.
10
Our estimates on the initiation and termination of ice nucleation have large uncer-tainties so that there are little we could learn from the result. However, by accumulating more match pairs with improved accuracy of both observations and trajectory calcula-tions, we would like to have better view on the necessary condition for ice nucleation.
5.3 Estimation of the efficiency of dehydration in the lower TTL
15
The efficiency of dehydration depends on various factors, including the concentration and size distribution of cloud condensation nuclei, the duration of a cold event, and the degree of supersaturation of the air mass. Although a complete set of observations is unavailable, our match pairs would provide some useful constraints on the processes of dehydration in the TTL. We attempt to model the efficiency of dehydration using two
20
terms: the critical value of RHice that enables ice nucleation (RHcri) and the dehydra-tion rate as a gross measure of the nucleadehydra-tion rate and the gravitadehydra-tional removal of ice particles. Here, the dehydration rate is defined as the relaxation time (e-folding time:
τ[hour]) taken by a supersaturated air parcel to approach the saturation state by the nucleation and removal of ice particles. These two parameters, RHcri and τ, are
esti-25
ACPD
13, 633–688, 2013Dehydration in the TTL from match
estimates
Y. Inai et al.
Title Page
Abstract Introduction
Conclusions References
Tables Figures
◭ ◮
◭ ◮
Back Close
Full Screen / Esc
Printer-friendly Version Interactive Discussion
Discussion
P
a
per
|
Dis
cussion
P
a
per
|
Discussion
P
a
per
|
Discussio
n
P
a
per
|
air parcel. Such calculations are repeated for a given value of RHcri (from 100 % to 250 % at 5 % increments) to identify the value ofτ that is consistent with the second observation of water vapor. Here,τis assumed to be independent of temperature and pressure, and it is assumed to have a fixed value during advection.
Figure 10 shows examples for such calculations corresponding to the match air mass
5
shown in Fig. 7. For a RHcrivalue of 100 %, it is evident that the air mass is dehydrated every time the SMR becomes smaller than the water vapor it contains (Fig. 10a). On the other hand, dehydration does not occur in other cases until some additional cooling is applied. In most cases (but not all), we find a unique value ofτ that best fits the second water vapor observation for any given value of RHcri. Of note, no value of τ
10
yields the second observed water vapor mixing ratio for a RHcri value of near 160 % (Fig. 10c).
The statistical features of the efficiency of dehydration are analyzed in terms of the values of RHcri and τ. Figure 11 shows the variation in τ (ordinate) for each RHcri value (abscissa) derived from all dehydrated match pairs.τshows a general decrease
15
with increasing RHcri, although there are exceptions. The mean values ofτare around 2.5 h, regardless of RHcri. These values are much shorter than the typical time scale of horizontal advection in the TTL, and are shorter than the time interval of available ECMWF data. If the value of RHcriis assumed to be the RHicevalues of supersaturation reported previously (e.g. Koop et al., 2000; Gao et al., 2004; Shibata et al., 2007;
20
Jensen et al., 2008; Kr ¨amer et al., 2009; Selkirk et al., 2010; Inai et al., 2012), then the corresponding values ofτ are estimated to be 2–3 h, and these values are nearly equivalent to the formation time of ice particles with a mean radius of about 40 µm (Kr ¨amer et al., 2009). Therefore, it is suggested that cold trap dehydration is quite efficient in the lower levels of the TTL. On the other hand, values of τ are estimated
25
to be more than 100 h at 369 K for the RHcrivalues of less than 140 %. This suggests a possibility that the value ofτbecomes larger in the upper levels of the TTL.
ACPD
13, 633–688, 2013Dehydration in the TTL from match
estimates
Y. Inai et al.
Title Page
Abstract Introduction
Conclusions References
Tables Figures
◭ ◮
◭ ◮
Back Close
Full Screen / Esc
Printer-friendly Version Interactive Discussion
Discussion
P
a
per
|
Dis
cussion
P
a
per
|
Discussion
P
a
per
|
Discussio
n
P
a
per
|
beginning of ice nucleation, thereby depending on the value of assumed RHcri. In ad-dition, the value ofτ is largely independent of the value of RHcri, as shown in Fig. 11. Therefore, the estimate ofτis unlikely to show marked changes with the background aerosol condition. However, it may be sensitive to the altitude range, as indicated by the facts that values ofτare estimated to be more than 100 h at 369 K and that
dehy-5
drated cases are lacking near the cold point (the possible reason for this is discussed in Sect. 5.4).
5.4 Lack of dehydrated cases near the cold point
Sixteen matches were found in the altitude region from 370 K to 380 K (eight different observational pairs are included in this number). However, there are no dehydrated
10
cases that exceed the uncertainty of water vapor measurements. In contrast, two hy-drated cases exceed the uncertainty, as described in last part of Sect. 4.1. Here, we examine one possible reason for the lack of dehydrated cases around the cold point altitude. The microphysical behavior of cirrus cloud particles in the TTL is largely un-known. Even so, we presume that the dehydration associated with horizontal advection
15
is less efficient with reduced water vapor and temperature, based on previous results (e.g. Koop et al., 2000; Murray et al., 2010). In this analysis, only those observational pairs for which the advection time (from the first to the second observation) is less than 5 days are identified as match cases, in order to assure the reliability of the trajectory (see Appendix A3). If the time required to complete the dehydration around 370 K was
20
longer than 5 days, any dehydrated cases would not be found in this analysis at such an altitude. Actually, it is suggested that the relaxation time scale at 369 K was much larger than those at lower levels in previous section. In such a case, it is necessary to reduce the uncertainty of the trajectory calculation in order to track the air mass for long enough to enable the dehydration to reach completion.
25
ACPD
13, 633–688, 2013Dehydration in the TTL from match
estimates
Y. Inai et al.
Title Page
Abstract Introduction
Conclusions References
Tables Figures
◭ ◮
◭ ◮
Back Close
Full Screen / Esc
Printer-friendly Version Interactive Discussion
Discussion
P
a
per
|
Dis
cussion
P
a
per
|
Discussion
P
a
per
|
Discussio
n
P
a
per
|
of the water vapor mixing ratio in the TTL environment. According to Boehm et al. (1999), an ice particle of 10 µm in size requires approximately 34 h to fall through 1 km. However, these values correspond to cirrus clouds with a relatively thick optical depth; in contrast, the ice particles in optically thin cirrus clouds are much smaller than 10 µm. For example, Boehm et al. (1999) stated that a particle of 1 µm in size (the existence of
5
such small ice particles was suggested by Iwasaki et al., 2007) requires approximately 14 days to fall through 1 km. If the dehydration process around the cold point results in the formation of such small particles, then the period required for ice removal is too long to enable tracking of the air parcel. Unfortunately, such a long-running trajectory would be difficult to calculate accurately and it would be inappropriate for match analysis; as
10
well as, it could be used to estimate the global-scale distribution of water vapor, as shown by Fueglistaler et al. (2004) and Ploeger et al. (2011).
If the lack of dehydrated cases around the cold point reflects the fact that the de-hydration time scale is too long, one effective approach to resolve this problem would be to reduce the uncertainty in water vapor measurements and to observe the size
15
distribution and concentration of ice particles together with the amount of water vapor. Because the default soundings in previous SOWER campaigns did not include any sen-sors for particles, we could not estimate the total water content in which the air mass has ice particles. In addition, for the campaign region and period (i.e. over the western Pacific in the boreal winter), cirrus clouds are common in the TTL (Fujiwara et al., 2009;
20
Massie et al., 2010; Yang et al., 2010; Inai et al., 2012; Shibata et al., 2007, 2012). If we could observe ice particles and measure their concentration and size distribution, we could estimate their growth rate under the assumption that a critical relative humidity leads to the initiation of ice nucleation, using the same technique as that employed to estimate the efficiency of dehydration (Sect. 5.3). The history of relative humidity of the
25
ad-ACPD
13, 633–688, 2013Dehydration in the TTL from match
estimates
Y. Inai et al.
Title Page
Abstract Introduction
Conclusions References
Tables Figures
◭ ◮
◭ ◮
Back Close
Full Screen / Esc
Printer-friendly Version Interactive Discussion
Discussion
P
a
per
|
Dis
cussion
P
a
per
|
Discussion
P
a
per
|
Discussio
n
P
a
per
|
dition, if we confirm or assume that no ice particles fall from the upper layer, we can estimate the net removal rate of water vapor from the match air parcel. Estimations of these parameters would provide quantitative description on the efficiency of cold trap dehydration.
6 Conclusions
5
This study investigated evidence for, and the efficiency of, cold trap dehydration in the TTL by applying the match technique, which was originally proposed for the study of ozone depletion in the polar stratosphere. The water vapor match in the TTL was developed by trajectory calculations with intensive screening procedures to reduce the uncertainty in the results.
10
The match cases were identified by using screening procedures. Some of the match cases indicated a decrease in the amount of water vapor between the first and second observations of the water vapor mixing ratio. This finding represents the first direct evidence of cold trap dehydration in the TTL.
The match cases were investigated in detail in case studies and by statistical
anal-15
yses. A case study of the 370.0 K potential temperature revealed a match air mass that was not effectively dehydrated even though it was supersaturated. On the lev-els between 350 and 360 K, there were cases that indicate dehydration. Some cases showed a water vapor increase for which there is no reasonable explanation. The sta-tistical features of dehydration for air parcels advected in the TTL were derived from
20
the match cases. The results showed that the estimated upper limit of relative humidity with respect to ice, before the initiation of ice nucleation, is consistent with the super-saturation reported in previous studies. It is suggested that sub-grid-scale temperature fluctuations (or possibly nitric acid trihydrate or other particles) influence cold trap de-hydration in the lower TTL. The efficiency of dehydration was defined as the relaxation
25
ACPD
13, 633–688, 2013Dehydration in the TTL from match
estimates
Y. Inai et al.
Title Page
Abstract Introduction
Conclusions References
Tables Figures
◭ ◮
◭ ◮
Back Close
Full Screen / Esc
Printer-friendly Version Interactive Discussion
Discussion
P
a
per
|
Dis
cussion
P
a
per
|
Discussion
P
a
per
|
Discussio
n
P
a
per
|
process is efficiently driven in the lower part of the TTL. These findings may improve our understanding of cloud-microphysical processes in the TTL.
The match cases that indicate dehydration were not found at altitudes close to the cold point tropopause (i.e. potential temperature ranging from 370 to 380 K). Given that the dehydration around this level determines the amount of water vapor entering the
5
stratosphere, additional observation data at this level are required.
Appendix A
Detailed descriptions of screening procedures
A1 Representativeness of the match air parcel
The match air parcels must be representative of a certain area; otherwise, the values
10
observed by the sonde are not considered as those of the match air parcel. Figure A1 shows the horizontal distribution (left) and frequency distribution (right) of tempera-ture in the match circular areas corresponding to the sonde observations at Tarawa (top) and Biak (bottom) on the 355.8 K potential temperature surface. These match segments are the origins of the forward (backward) trajectories in the upper (lower)
15
panel. In this case, the temperature fields in the circular regions with a match radius for the first and second observations are almost uniform. In addition, the match air segments are widely distributed, covering the match circular areas. Therefore, these match air segments are representative of the temperatures inside both match circles. The confidence intervals of the mean temperature difference between the match air
20
ACPD
13, 633–688, 2013Dehydration in the TTL from match
estimates
Y. Inai et al.
Title Page
Abstract Introduction
Conclusions References
Tables Figures
◭ ◮
◭ ◮
Back Close
Full Screen / Esc
Printer-friendly Version Interactive Discussion
Discussion
P
a
per
|
Dis
cussion
P
a
per
|
Discussion
P
a
per
|
Discussio
n
P
a
per
|
Another example of temperature distributions, shown in Fig. A2, is the same as in Fig. A1 but for observations paired between Biak and Hanoi by trajectory calculations. In this case, the temperature field in the match circle shows a strong meridional gradient over Biak (top panels in Fig. A2). The match air segments occur only at the northern edge of the match circle. Consequently, the subset of match air segments is found
5
only at the right-hand end of the histogram (red bars). As a result, the confidence interval of the mean temperature difference between the match air segments and the whole segments inside the match circle is from 2.18 to 2.56 K for the first observation (significance level of 0.1). Such cases should not be considered in the match analysis. According to the screening procedure adopted in this study, observational pairs are
10
rejected if the confidence interval of the mean temperature difference between the match air segments and the whole segments inside the match circle does not fall within [−2.0, 2.0] K for the first and second observations at a significance level of 0.1. This temperature range is determined empirically; the temperature difference of 2.0 K cor-responds to a difference in the saturation water vapor mixing ratio in the TTL of∼0.5
15
to∼2.0 ppmv.
A2 Convective penetration
To diagnose convective penetration into the match air parcel, the temperatures of the match air segments (T) and the equivalent blackbody temperature of the underlying cloud (Tbb) are compared, and the value ofTbbminusT (≡δTbb) is defined. The values
20
ofTbbare estimated from hourly MTSAT-1R/GOES-9 infrared images (Channel 1: 10.3– 11.3 µm). Figure A3 shows an example of advected match air segments similar to the red dots in Fig. 1, superposed on theTbb distribution at 06:00 (UT) on 29 December 2004.
To determine an appropriate margin for δTbb in diagnosing the penetration of deep
25