www.atmos-chem-phys.net/15/1843/2015/ doi:10.5194/acp-15-1843-2015
© Author(s) 2015. CC Attribution 3.0 License.
SO
2
photolysis as a source for sulfur mass-independent isotope
signatures in stratospehric aerosols
A. R. Whitehill1, B. Jiang2, H. Guo2, and S. Ono1
1Department of Earth, Atmospheric, and Planetary Sciences, Massachusetts Institute of Technology, 77 Massachusetts Ave., Cambridge, MA 02139, USA
2Department of Chemistry and Chemical Biology, University of New Mexico, Albuquerque, NM 87131, USA Correspondence to:A. R. Whitehill (arwhite@mit.edu)
Received: 14 August 2014 – Published in Atmos. Chem. Phys. Discuss.: 12 September 2014 Revised: 13 December 2014 – Accepted: 3 January 2015 – Published: 20 February 2015
Abstract. Signatures of sulfur isotope mass-independent
fractionation (S-MIF) have been observed in stratospheric sulfate aerosols deposited in polar ice. The S-MIF signatures are thought to be associated with stratospheric photochem-istry following stratospheric volcanic eruptions, but the exact mechanism responsible for the production and preservation of these signatures is debated. In order to identify the ori-gin and the mechanism of preservation for these signatures, a series of laboratory photochemical experiments were car-ried out to investigate the effect of temperature and added O2 on the S-MIF produced by two absorption band systems of SO2: photolysis in the 190 to 220 nm region and photoexcita-tion in the 250 to 350 nm region. The SO2photolysis (SO2+
hν→SO+O) experiments showed S-MIF signals with large
34S/32S fractionations, which increases with decreasing tem-perature. The overall S-MIF pattern observed for photolysis experiments, including high34S/32S fractionations, positive mass-independent anomalies in33S, and negative anomalies in 36S, is consistent with a major contribution from opti-cal isotopologue screening effects and data for stratospheric sulfate aerosols. In contrast, SO2photoexcitation produced products with positive S-MIF anomalies in both33S and36S, which is different from stratospheric sulfate aerosols. SO2 photolysis in the presence of O2produced SO3with S-MIF signals, suggesting the transfer of the S-MIF anomalies from SO to SO3 by the SO+O2+M→SO3+M reaction. This
is supported with energy calculations of stationary points on the SO3potential energy surfaces, which indicate that this re-action occurs slowly on a single adiabatic surface, but that it can occur more rapidly through intersystem crossing. Based on our experimental results, we estimate a termolecular rate
constant on the order of 10−37cm6molecule−2s−1. This rate
can explain the preservation of mass independent isotope sig-natures in stratospheric sulfate aerosols and provides a minor, but important, oxidation pathway for stratospheric SO2. The production and preservation of S-MIF signals requires a high SO2column density to allow for optical isotopologue screen-ing effects to occur and to generate a large enough signature that it can be preserved. In addition, the SO2 plume must reach an altitude of around 20 to 25 km, where SO2 photol-ysis becomes a dominant process. These experiments are the first step towards understanding the origin of the sulfur iso-tope anomalies in stratospheric sulfate aerosols.
1 Introduction
Explosive volcanic eruptions that inject sulfur dioxide (SO2) into the stratosphere can cause perturbations to the strato-spheric sulfur cycle for years following eruptions. The in-crease in stratospheric sulfate aerosols associated with injec-tions of SO2result in stratospheric warming and tropospheric cooling, and can also trigger changes in atmospheric circula-tion and increases in ozone deplecircula-tion (Robock, 2000). Per-turbations to the stratospheric sulfur cycle following large volcanic eruptions are recorded as changes in sulfur iso-tope ratios, as measured in stratospheric sulfate aerosol sam-ples (Castleman et al., 1974), as well as in ice core records (Savarino et al., 2003; Baroni et al., 2007).
The reaction with OH is the dominant oxidation pathway for SO2in the stratosphere:
This reaction is followed by
HOSO2+O2→SO3+HO2. (R2)
In the presence of H2O, SO3 readily forms sulfuric acid (H2SO4) via the following:
SO3+H2O→H2SO4. (R3)
Ab initio transition state theory calculations of the isotope effect for OH oxidation Reaction (R1) predict that34SO
2is oxidized 0.9 % slower than 32SO
2(Tanaka et al., 1994), al-though calculations with RRKM theory predict an inverse isotope effect, in which 34SO2 reactions 12 to 15 % faster than32SO2(Leung et al., 2001). Experimental studies of OH oxidation (R1) showed an inverse isotope effect, but with a smaller magnitude, with 34SO2 reacting about 1 % faster than 32SO2 (Harris et al., 2012). Although the experimen-tally measured isotope effect might be sufficient to explain the roughly 2 % enrichment in H342 SO4 relative to H322 SO4 following the major Mt. Agung (1963) eruption (Castleman et al., 1974), the large observed isotope effect suggests the possibility of an additional oxidation reaction with larger34S fractionations.
An additional unexplained observation is the isotope anomalies in33S/32S and36S/32S ratios relative to34S/32S ratios. These signatures of mass-independent fractionation (MIF) have been observed in ice cores associated with large volcanic eruptions (Savarino et al., 2003; Baroni et al., 2007, 2008; Lanciki, 2010; Lanciki et al., 2012). Ice core sulfate peaks are commonly used to reconstruct the impact of past volcanic activity, which is critical to forcing climate mod-els (Robock, 2000). For several years following large injec-tions of SO2into the stratosphere, stratosphere-derived sul-fate can dominate sulsul-fate deposition in ice cores and, when corrected for background levels, can preserve the sulfur iso-topic composition of stratospheric sulfate aerosols. Experi-mental studies demonstrate that OH oxidation of SO2 (R1) does not produce mass-independent sulfur isotope anomalies (Harris et al., 2012, 2013), so an additional oxidation mecha-nism is required to produce the mass-independent sulfur iso-tope signatures. Three reactions have been proposed to ex-plain these isotope anomalies: excited-state photochemistry of SO2in the 250 to 350 nm absorption region (Savarino et al., 2003; Hattori et al., 2013), SO2photolysis in the 190 to 220 nm absorption region (Ono et al., 2013), and SO3 pho-tolysis (Pavlov et al., 2005).
We present results of laboratory photochemical experi-ments that support SO2 photolysis as the main source for the MIF signatures observed in stratospheric sulfate aerosols following some large (stratospheric) volcanic eruptions. In particular, SO2photolysis produces large MIF anomalies, as well as large mass-dependent isotope fractionations (Master-son et al., 2011; Whitehill and Ono, 2012; Ono et al., 2013) that are consistent with the isotopic signatures observed in stratospheric sulfate aerosols in ice cores (Ono et al., 2013).
Photolysis of SO2occurs above around 20 to 25 km in the wavelength region of 190 to 220 nm, which lies in the spec-tral window between the Schumann–Runge absorption edge of oxygen (O2) and the Hartley bands of ozone (O3). SO2 photolysis produces sulfur monoxide (SO) and O(3P) via the following reaction:
SO2+hν→SO+O(3P) (R4)
It is generally accepted that this reaction is followed by rapid oxidation of SO to SO2via the following (Black et al., 1982; Savarino et al., 2003; Pavlov et al., 2005):
SO+O2→SO2+O(3P) (R5)
Reactions (R4) and (R5) combine to form a null cycle for sulfur, but catalyzes the formation of odd oxygen (Bekki, 1995). If SO is completely oxidized to SO2, no isotopic sig-nature from SO2photolysis can be preserved (Pavlov et al., 2005).
We propose an additional channel where SO is oxidized directly to SO3via the termolecular reaction:
SO+O2+M→SO3+M. (R6)
A previous study by Black et al. (1982) showed that the maximum termolecular rate constant for Reaction (R6) is 10−36cm6molecule−2s−1. This rate is considered too slow
to play an important role for stratospheric chemistry (Black et al., 1982). However, given the large isotope effects pro-duced during SO2photolysis, even a minor contribution from Reaction (R6) will produce a significant signal on the sulfur isotopic composition of stratospheric sulfate aerosols.
We present results from laboratory photochemical experi-ments that investigate the effect of temperature and molecu-lar oxygen on the isotope effects produced during SO2 pho-tolysis (190 to 220 nm) and SO2 photoexcitation (250 to 350 nm). Using the results of the experiments in the presence of molecular oxygen, we calculate an order of magnitude es-timate on the rate of Reaction (R6). Our proposal is further supported by ab initio calculations of stationary points along the potential energy surfaces (PESs) for the SO oxidation Re-actions (R5 and R6). Finally, we present a simple steady state photochemical model to show that the rate constraints on Re-action (R6) are sufficient for it to make a significant contribu-tion to the isotopic signature of stratospheric sulfate aerosols during volcanically perturbed periods.
2 Methods
2.1 Photochemical reaction set-up
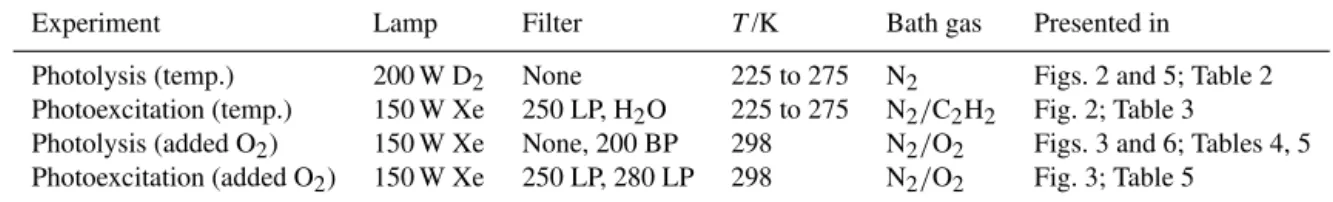
Table 1.Summary of experiments performed.
Experiment Lamp Filter T/K Bath gas Presented in
Photolysis (temp.) 200 W D2 None 225 to 275 N2 Figs. 2 and 5; Table 2 Photoexcitation (temp.) 150 W Xe 250 LP, H2O 225 to 275 N2/C2H2 Fig. 2; Table 3
Photolysis (added O2) 150 W Xe None, 200 BP 298 N2/O2 Figs. 3 and 6; Tables 4, 5
Photoexcitation (added O2) 150 W Xe 250 LP, 280 LP 298 N2/O2 Fig. 3; Table 5
Temperature-controlled experiments were performed in a jacketed cell of the same dimensions. The front window of the cell was made of UV-grade SiO2 (Corning 7980) with greater than 90 % transmittance at wavelengths longer than 190 nm. The window was sealed to the cell with an O-ring and held in place securely with a plastic clamp. Temperature-controlled experiments also utilized a second pre-cell (5.3 cm path length) attached to the front window of the reaction cell and held under vacuum. The purpose of the pre-cell was to thermally insulate the front window and prevent condensa-tion from occurring on the front window during low temper-ature experiments.
A series of mass-flow controllers controlled the flow rate of gases into the cell. Gas entered the cell through an inlet at the rear of the cell (for temperature experiments) or the front of the cell (for other experiments) and exited through an outlet at the opposite end of the cell. An 8 to 10 cm length of glass tubing packed with glass wool was placed immedi-ately after the cell to trap aerosols formed within the cell. Following the aerosol trap, the gas was made to flow through a proportionating valve to a vacuum pump. A capacitance manometer placed before the entrance to the cell monitored the pressure within the cell. The proportionating valve was used to control the pressure within the cell to within 30 Pa of a set-point pressure, which was usually 101.3 kPa.
Prior to each temperatucontrolled experiment, the re-action cell was flushed with nitrogen (N2) for several hours and the chiller was allowed to reach its set-point temperature and equilibrate for at least an hour. The temperature of the reaction cell was calibrated relative to the chiller set-point temperature on two occasions using a series of K-type ther-mocouples suspended within the cell. During calibrations, N2 (without SO2) was made to flow through the cell at a rate of 3.33 cm3s−1 (200 sccm, standard cubic centimeter per minute). Thermocouples placed at the front and rear of the cell gave consistent measurements to within 5 K, with a higher gradient at lower temperature. No significant differ-ences were observed between the two calibrations. Results for the temperature calibration are shown in Fig. 1.
2.2 Temperature effect on SO2photolysis (190 to
220 nm) and photoexcitation (250 to 350 nm)
The temperature effect on SO2 photolysis (190 to 220 nm) was tested using the temperature-controlled reaction cell described in Sect. 2.1. Experiments were performed in a
70 60 50 40 30 20 10 0
10
Chiller Setpoint Temperature /
◦C
50
40
30
20
10
0
10
Me
asu
red
C
ell
Te
mp
era
ture
/
◦
C
Calibration 1 - Cell Back Calibration 1 - Cell Front Calibration 2 - Cell Back Calibration 2 - Cell Front Linear regression
Figure 1.Results of the temperature calibration for the temperature controlled photochemical reactor described in Sect. 2.1. The linear regression shown was used to calibrate the temperature within the cell based on the set-point temperature of the chiller. The regression line is (TCell/◦C)=0.8160×(TChiller/◦C)+2.3514.
nitrogen-flushed glove box to prevent the spectral interfer-ence from the Schumann–Runge band of oxygen (O2). A 200 W deuterium (D2) arc lamp (D 200 F, Heraeus Noble-light) was used as the light source without optical filters. The output from the lamp was collimated using a fused sil-ica plano-convex lens. 1000 ppm SO2 (in N2) was made to flow through the cell at a rate of 3.33 cm3s−1(200 sccm) for
all experiments, and pressure within the cell was held con-stant at 101.3 kPa, giving an SO2partial pressure of 0.10 kPa within the cell.
Photoexcitation experiments were performed in a room air atmosphere using a 150 W UV-enhanced xenon (Xe) arc lamp (Newport Model 6254) housed in a lamp hous-ing (Newport Model 67005), which focused and collimated the light to a 3.3 cm diameter beam. The light was passed through a liquid filter (Newport Model 51945) filled with deionized (18.2 M) water and a 250 nm long-pass filter (Asahi Spectra, ZUL0250).
Following Whitehill et al. (2013), acetylene (C2H2) was used to trap triplet excited-state SO2 (3SO2). Dur-ing experiments, 5 % SO2 (in N2), pure C2H2 (atomic absorption grade), and pure N2 (ultra high purity grade) were made to flow through the cell continuously at a rate of 0.67 cm3s−1 (40 sccm), 0.03 cm3s−1 (2 sccm), and
2.63 cm3s−1 (158 sccm), respectively. Pressure in the cell
was held constant at 101.3 kPa, giving a total flow rate of 3.33 cm3s−1, an SO2 partial pressure of 1.01 kPa, and a
C2H2partial pressure of 1.01 kPa within the cell during the experiments.
Following the experiments, the interior walls of the cell and the window were rinsed with ethanol and water to dis-solve any organosulfur products formed. The glass wool in the aerosol trap was also collected. The organosulfur prod-ucts were converted to silver sulfide using the Raney nickel hydrodesulfurization method of Oduro et al. (2011). Multiple sulfur isotope ratios were measured as described in Sect. 2.4.
2.3 SO2photochemistry in the presence of O2
The photochemistry of SO2+O2 with ultraviolet radiation
was studied using a reaction cell at room temperature. The 150 W Xe arc lamp (described in Sect. 2.2) was used as the light source without the liquid filter. Several experiments were performed with a 200±35 nm bandpass filter (Model
200-B, Acton Research, Acton, MA), a 250 nm long-pass fil-ter (Asahi Spectra, ZUL0250), or a 280 nm (285 nm cut-on) long-pass filter (Newport Model FSR-WG280) to isolate par-ticular absorption bands of SO2, but most experiments were performed with the Xe lamp and no filters (Table 1).
Following experiments, the cell was rinsed well first with dichloromethane then with water. Although sulfate was the dominant product, the cell was rinsed well with dichloromethane first to ensure the removal of elemental sul-fur. For two experiments performed with no oxygen, ele-mental sulfur was recovered. After rinsing the cell with wa-ter, 5.0 cm3 of a 1.0 mol dm−3 solution of barium chloride (BaCl2) was added to the water used to rinse the cell to pre-cipitate sulfate as barium sulfate. Barium sulfate was rinsed several times with deionized water and dried. The glass wool inside the aerosol trap was combined with the barium sul-fate and all sulsul-fate was converted to silver sulfide using the method of Forrest and Newman (1977). Multiple sulfur iso-topes were measured as described in Sect. 2.4.
2.4 Isotope analysis of photochemical products
Photochemical products were converted to silver sulfide (Ag2S). Ag2S was rinsed well three to four times with deion-ized water and then dried completely at 353 K. Dried Ag2S was weighed for total yield and about 8 µmol of Ag2S was weighed into an aluminum foil capsule for isotope analysis. Capsules were loaded into nickel reaction chambers and re-acted under approximately 7.3 kPa of fluorine gas (F2) for at least 8 h at 573 K. The resultant SF6was purified cryogeni-cally and by gas chromatography. Isotope ratios of pure SF6 were measured as SF+
5 ions using a Thermo Scientific MAT 253 Isotope Ratio Mass Spectrometer. For sample where less than 1.6 µmol of Ag2S was recovered, a microvolume (0.4 cm3 volume) cold finger was used to concentrate the sample for analysis.
Replicate analyses (N=28) of the reference material
IAEA-S-1 gave 2σ standard deviations of 0.26 ‰ forδ34S, 0.014 ‰ for133S, and 0.19 ‰ for136S for standard isotope ratio mass spectrometry analysis. Microvolume analyses for smaller samples gave 2σ standard deviations for replicate analyses of IAEA-S-1 (N=14) of 0.9 ‰ forδ34S, 0.08 ‰ for 133S, and 0.8 ‰ for 136S. Replicate experiments per-formed under identical conditions had differences larger than the analytical uncertainty, suggesting experimental variabil-ity was the dominant source of uncertainty in our measure-ments.
2.5 Potential energy surfaces of
SO+O2→SO3→SO2+O reactions
To test the feasibility of Reaction (R6), ab initio energy calculations at multiple levels of theory were performed to search important stationary points on the SO3 PESs. The lowest SO(36−)+O2(36g−)asymptote of the SO3PESs in-volves three degenerate states, namely the singlet, triplet, and quintet states. The singlet state corresponds to the ground state of the SO3molecule (1A′
1), but does not dissociate to the ground state products SO2(1A1) + O(3P) but to SO2(1A1) + O(1D). The triplet surface corresponds to the ground state products but is adiabatically associated with a higher en-ergy excited-state (triplet) SO3. The quintet state is much higher in energy than the other two states except at the SO(36−)+O2(36g−)asymptote and will thus not be con-sidered in this study.
The B3LYP density functional (Becke, 1988; Lee et al., 1988) was initially used to optimize each minimum and/or transition state on the singlet and triplet PESs. Single point calculations at these stationary points were then carried out using an explicitly correlated version of the unrestricted cou-pled cluster method with single, double, and perturbative triple excitations (UCCSD(T)-F12a) (Knizia et al., 2009).
perturbation theory of second order (RSPT2 or CASPT2) cal-culations (Celani and Werner, 2000) were performed based on the CASSCF wave functions in order to account for part of the dynamical correlation. Calculations including the full valence orbitals would involve 24 electrons in 16 or-bitals and were not feasible. Instead, the 2 s orbital for O and the 3s orbital for S were closed, resulting in an active space of 16 electrons in 12 orbitals (16e,12o). Dunning’s augmented correlation-consistent polarized valence triplet-zeta (aug-cc-pVTZ) basis set was used in all cases (Dun-ning, 1989). B3LYP calculations were performed with Gaus-sian09 (Frisch et al., 2009) and the other calculations were performed using MOLPRO (Werner et al., 2012).
2.6 Definitions
Isotopic results will be presented with conventionalδ nota-tion: as relative deviations of isotope ratios with respect to reference sulfur.
δxS= xR
product
xRreference−1, (1)
wherex=33, 34, or 36 and xRis the ratio of xS to32S in the substance. For experimental results all isotope ratios will be normalized to the isotope ratios of the initial SO2. For natural samples (i.e., stratospheric sulfate aerosol samples), the reference is Vienna Canyon Diablo Troilite (V-CDT).
Mass-independent isotope fractionations in 33S/32S and 36S/32S ratios (relative to34S/32S ratios) will be presented as133S and136S values, respectively. These are defined as
133S= (δ
33S+1)
(δ34S+1)0.515−1 (2) and
136S= (δ
36S+1)
(δ34S+1)1.90−1. (3) Almost all physical, chemical, and biological processes frac-tionate isotopes mass dependently (i.e.,133S and136S are approximately equal to 0). SO2photochemistry, as well as the photochemistry of other sulfur gases such as CS2, are some of the few exceptions that produce mass-independent fractionation. Therefore, non-zero133S and136S values can be unique tracers of photochemical processes.
3 Results
All experiments performed are summarized in Table 1. Re-sults from temperature experiments on SO2 photolysis and SO2photoexcitation are given in Tables 2 and 3, whereas re-sults from SO2+O2experiments are presented in Tables 4
and 5. Tables 6, 7, and 8 give the results from energy calcu-lations on the PESs of SO3.
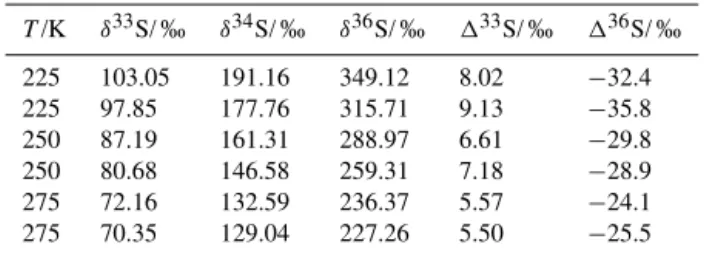
Table 2.Isotope ratios of elemental sulfur products from the SO2 photolysis temperature experiments (Sect. 2.2).
T/K δ33S/ ‰ δ34S/ ‰ δ36S/ ‰ 133S/ ‰ 136S/ ‰
225 103.05 191.16 349.12 8.02 −32.4
225 97.85 177.76 315.71 9.13 −35.8
250 87.19 161.31 288.97 6.61 −29.8
250 80.68 146.58 259.31 7.18 −28.9
275 72.16 132.59 236.37 5.57 −24.1
275 70.35 129.04 227.26 5.50 −25.5
Table 3.Isotope ratios of organosulfur products from the SO2 pho-toexcitation temperature experiments (Sect. 2.2).
T/K δ33S/ ‰ δ34S/ ‰ δ36S/ ‰ 133S/ ‰ 136S/ ‰
225 24.18 9.88 65.72 19.01 46.0
225 24.94 9.95 67.09 19.73 47.2
250 25.29 7.33 64.39 21.44 49.7
250 24.30 6.37 62.38 20.96 49.6
275 26.24 5.39 63.29 23.4 52.5
275 25.39 4.84 61.27 22.84 51.6
3.1 Temperature experiments
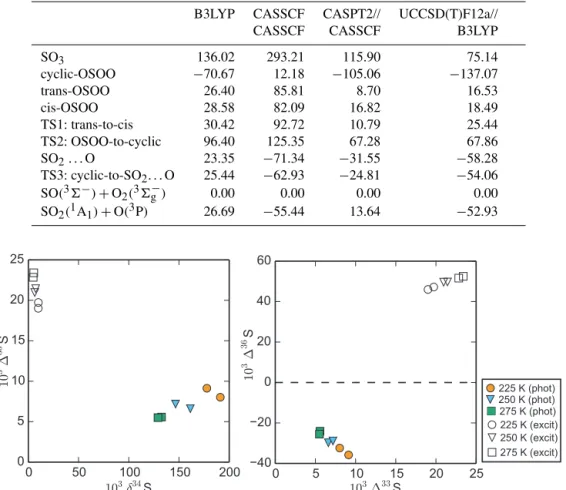
Results from the temperature experiments (Sect. 2.2) are shown in Fig. 2. The SO2 photolysis (190 to 220 nm) ex-periments (Table 2) revealed that the magnitude of the iso-tope effects increase with decreasing temperatures, from 129 to 191 ‰, 5.5 to 9.1 ‰, and −24.1 to −35.8 ‰ for δ34S, 133S, and136S, respectively. The relationship between iso-topes (i.e.,133S vs.δ34S and136S vs.133S) did not change significantly as temperature was decreased (0.04 to 0.05 for 133S/δ34S and −3.9 to −4.6 for 136S/133S). Variability between duplicate experiments also increased at lower tem-peratures, highlighting the difficulty of the low temperature experiments and indicating a strong sensitivity to experimen-tal conditions.
SO2 photoexcitation (250 to 350 nm) experiments show decreasing magnitude133S and136S values at lower tem-peratures (22.8 to 19.0 ‰ and 52.5 to 46.0 ‰ for 133S and 136S, respectively; Table 3). Even at lower temper-atures, the product from SO2 photoexcitation experiments show positive133S and136S values, as shown previously in room-temperature experiments (Whitehill and Ono, 2012; Whitehill et al., 2013). As discussed previously (Whitehill et al., 2013), these signatures do not match predictions from isotopologue-specific absorption cross sections (Danielache et al., 2012), suggesting an additional isotope effect be-yond differences in the initial excitation for different isotopo-logues.
3.2 Oxygen experiments
Table 4.Results from experiments of SO2photolysis in the presence of varying amounts of O2(Sect. 2.3) used to estimatekR6(Sects. 4.3
and 4.4).
Product pO2/ Time/ Yield/ δ33S/ δ34S/ δ36S/ 133S/ 136S/ calculatedkR6/
kPa ks µmol S ‰ ‰ ‰ ‰ ‰ cm6molecule−2s−1
S0−1∗ 0.00 21.6 74.00 129.68 220.54 8.63 −31.9
S0−2∗ 0.00 21.6 78.42 137.52 232.90 9.18 −34.8
S0avg 0.00 8.91 −33.3
SO3−1∗ 0.00 21.6 35.3 14.16 25.64 43.82 1.02 −5.2
SO3−2∗ 0.00 21.6 28.9 11.51 21.14 36.21 0.67 −4.2
SO3 5.07 7.2 46.0 45.47 79.75 134.34 4.97 −19.5 1.4×10−37
SO3 5.07 7.2 32.6 50.85 89.24 150.93 5.59 −21.6 1.1×10−37
SO3 10.13 7.2 37.1 51.60 90.27 151.99 5.82 −22.5 1.3×10−37
SO3 10.13 7.2 41.3 51.35 91.22 155.00 5.13 −21.5 1.3×10−37
SO3 15.20 7.2 37.4 51.43 89.67 150.68 5.94 −22.6 1.3×10−37
SO3 15.20 7.2 20.8 55.14 97.09 164.55 5.97 −23.4 7.3×10−38
SO3 19.75 10.8 40.4 53.18 94.68 161.22 5.24 −22.2 8.3×10−38
SO3 19.75 10.8 39.1 54.18 96.59 164.45 5.29 −22.7 8.1×10−38
∗S0−1and SO
3−1are elemental sulfur and SO3from the same experiment. Similarly, S0−2and SO3−2are elemental sulfur and SO3from the
same experiment.
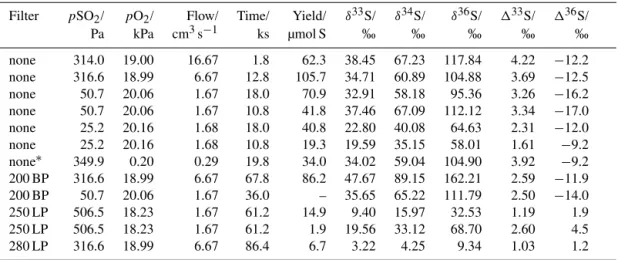
Table 5.Results from additional experiments of SO2photolysis in the presence of O2(Sect. 2.3). All results are from sulfate (SO3) product. Experiments were performed at a constant total pressure of 101.3 kPa unless marked otherwise. Filter types are as follows: 200 BP=200 nm
bandpass filter, 250 LP=250 nm long-pass filter, 280 LP=280 nm long-pass filter.
Filter pSO2/ pO2/ Flow/ Time/ Yield/ δ33S/ δ34S/ δ36S/ 133S/ 136S/
Pa kPa cm3s−1 ks µmol S ‰ ‰ ‰ ‰ ‰
none 314.0 19.00 16.67 1.8 62.3 38.45 67.23 117.84 4.22 −12.2
none 316.6 18.99 6.67 12.8 105.7 34.71 60.89 104.88 3.69 −12.5
none 50.7 20.06 1.67 18.0 70.9 32.91 58.18 95.36 3.26 −16.2
none 50.7 20.06 1.67 10.8 41.8 37.46 67.09 112.12 3.34 −17.0
none 25.2 20.16 1.68 18.0 40.8 22.80 40.08 64.63 2.31 −12.0
none 25.2 20.16 1.68 10.8 19.3 19.59 35.15 58.01 1.61 −9.2
none∗ 349.9 0.20 0.29 19.8 34.0 34.02 59.04 104.90 3.92 −9.2
200 BP 316.6 18.99 6.67 67.8 86.2 47.67 89.15 162.21 2.59 −11.9
200 BP 50.7 20.06 1.67 36.0 – 35.65 65.22 111.79 2.50 −14.0
250 LP 506.5 18.23 1.67 61.2 14.9 9.40 15.97 32.53 1.19 1.9
250 LP 506.5 18.23 1.67 61.2 1.9 19.56 33.12 68.70 2.60 4.5
280 LP 316.6 18.99 6.67 86.4 6.7 3.22 4.25 9.34 1.03 1.2
∗Experiment performed at 7.7 kPa total pressure to test low pressure limit.
signatures in sulfate products (Tables 4 and 5). Isotope ratios of this product sulfate are shown in Fig. 3 and compared with stratospheric sulfate aerosol data from ice cores (Savarino et al., 2003; Baroni et al., 2007, 2008; Lanciki, 2010; Lanciki et al., 2012). Strong agreement between Xe lamp data, 200 nm bandpass (200 BP) data, and previous SO2 photolysis data (Ono et al., 2013) suggest an SO2photolysis source for the isotope effects during broadband SO2irradiation with the Xe lamp light source.
Experiments focusing on the photoexcitation band of SO2 using the 250 nm long-pass filter (250 LP) and the 280 nm long-pass filter (280 LP) display a different isotope signature,
characterized by positive133S and 136S values, whereas sulfate from SO2 photolysis has positive 133S and nega-tive136S values. This is consistent with previous findings (Whitehill and Ono, 2012; Whitehill et al., 2013), and it demonstrates that MIF in this band region is not produced by chemistry related to acetylene or oxygen. However, the magnitude of the sulfur MIF signatures (i.e.,133S and136S values) are considerably smaller than previous experiments using C2H2 (Table 3; Whitehill et al., 2013). This sug-gests that a considerable amount of the sulfate in the sys-tem is being produced by a mass-dependent process, such as
∗SO
Table 6.Comparison of asymptotic energies of SO+O2obtained on the singlet and triplet potential energy surfaces for SO3and those
obtained by the sum of two separated species. All energies are in kJ mole−1and are relative to the SO(36−
)+O2(36g−)calculated separately
in each ab initio method.
B3LYP CASSCF CASPT2// UCCSD(T)F12a//
CASSCF B3LYP
SO(36−)+O2(36−g)
(separated) 0 0 0 0
SO(11)+O2(36g−)
(separated) 118.78 64.60 136.36 94.98
SO(36−)+O2(11g)
(separated) 160.83 86.57 98.28 121.55
SO(11)+O2(11g)
(separated) 279.57 151.17 234.64 216.48
SO+O2(singlet) 279.57 0.00 −6.86 217.19
SO+O2(triplet) 27.61 0.00 −6.61 122.59
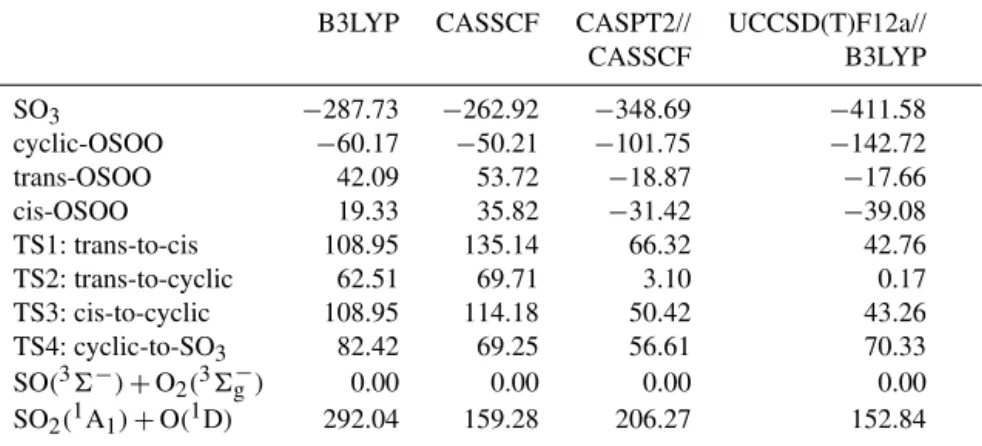
Table 7.Energies for stationary points on the singlet state potential energy surface at various ab initio levels. The energy is relative to the SO(36−)+O2(36g−)asymptote and zero point energy is not included. All energies are given in kJ mole−1.
B3LYP CASSCF CASPT2// UCCSD(T)F12a//
CASSCF B3LYP
SO3 −287.73 −262.92 −348.69 −411.58
cyclic-OSOO −60.17 −50.21 −101.75 −142.72
trans-OSOO 42.09 53.72 −18.87 −17.66
cis-OSOO 19.33 35.82 −31.42 −39.08
TS1: trans-to-cis 108.95 135.14 66.32 42.76
TS2: trans-to-cyclic 62.51 69.71 3.10 0.17
TS3: cis-to-cyclic 108.95 114.18 50.42 43.26
TS4: cyclic-to-SO3 82.42 69.25 56.61 70.33
SO(36−)+O2(36−g) 0.00 0.00 0.00 0.00
SO2(1A1)+O(1D) 292.04 159.28 206.27 152.84
would dilute the MIF signature. In addition, there is con-siderable variability (i.e., a factor of ∼2) between the two
250 nm long-pass filter experiments, despite identical con-ditions. The cause of this variability is uncertain but could relate to the amount of water vapor within the system.
3.3 Potential energy surfaces of SO3
Asymptotic energies of SO+O2 on each PES were
com-pared with the energies obtained by separate calculations of each species with a certain spin (Table 6). The CASSCF re-sults correctly produced degenerate energies for the SO+
O2 asymptote on the singlet and triplet states, which ex-actly match the sum of the energies of the SO(36−)and
O2(36g−)species calculated separately. The CASPT2 results also showed the correct degenerate behavior but the energies shift slightly from those calculated separately, which presum-ably arises from the perturbative treatment in CASPT2. On the other hand, the UCCSD(T)-F12a and B3LYP results both attribute SO+O2on the singlet state to SO(11)+O2(11g), and B3LYP even gives a qualitatively incorrect energy for
SO+O2on the triplet state, while UCCSD(T)-F12a attributes
the triplet state to SO(1)+O2(36g−). An important conclu-sion from these data is that one has to use a multi-reference method if accurate global adiabatic PESs are desired for this system. Otherwise, the asymptotic behavior can be com-pletely wrong. None of the previous studies noticed this, and as a result a single-reference method was always se-lected (Jou et al., 1996; Martin, 1999; Goodarzi et al., 2010; Ahmed, 2013). Fortunately, single reference methods can ac-curately describe the PES away from the SO+O2 region;
they are capable of describing several SO3isomers and the SO2+O product channel reasonably well.
Table 8.Energies for stationary points on the triplet state potential energy surface at various ab initio levels. The energy is relative to the SO(36−)+O2(36g−)asymptote and zero point energy is not included. All energies are given in kJ mole−1.
B3LYP CASSCF CASPT2// UCCSD(T)F12a//
CASSCF CASSCF B3LYP
SO3 136.02 293.21 115.90 75.14
cyclic-OSOO −70.67 12.18 −105.06 −137.07
trans-OSOO 26.40 85.81 8.70 16.53
cis-OSOO 28.58 82.09 16.82 18.49
TS1: trans-to-cis 30.42 92.72 10.79 25.44
TS2: OSOO-to-cyclic 96.40 125.35 67.28 67.86
SO2. . . O 23.35 −71.34 −31.55 −58.28
TS3: cyclic-to-SO2. . . O 25.44 −62.93 −24.81 −54.06
SO(36−)+O2(36g−) 0.00 0.00 0.00 0.00
SO2(1A1)+O(3P) 26.69 −55.44 13.64 −52.93
Figure 2.Results of the temperature experiments for SO2photolysis and SO2 photoexcitation (Sect. 2.2). Results from SO2photolysis experiments (phot) are shown in filled symbols and SO2photoexcitation experiments (excit) are in empty symbols.
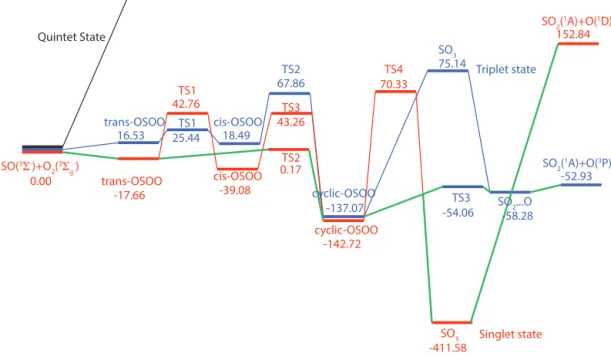
the aforementioned problems in the SO(36−)+O2(36g−) asymptote, we have used the UCCSD(T) energy sum of the two reactants with the correct spin calculated separately, which has been shown above to be accurate. The sum of these two energies thus provides the reference for other sta-tionary points on both the singlet and triplet PESs. All en-ergies of stationary points are listed in Tables 7 and 8, and the reaction pathways on both PESs are shown graphically in Fig. 4, using the energies of the UCCSD(T)//B3LYP calcu-lations. It is seen from Tables 7 and 8 that the experimental derived energy differences (from Chase et al., 1986) between the reactants and products for the SO(36−)+O2(36g−)→
SO3(1A′1) reaction (−411.29 kJ mole−1, the SO(36−)+
O2(36g−)→SO2(1A1)+O(3P)reaction (−54.56 kJ mole−1) and the SO(36−)+O2(36g−)→SO2(1A1)+O(1D)reaction (135.27 kJ mole−1) are reproduced well by the UCCSD(T)-F12a//B3LYP calculations, while the other methods contain significant errors.
4 Discussion
4.1 Origin of mass-independent fractionation during SO2photochemistry
The differences in the photophysics and photochemistry be-tween the photolysis region (190 to 220 nm) and the pho-toexcitation region (250 to 350 nm) suggest different mecha-nisms for MIF formation, as discussed previously (Whitehill and Ono, 2012; Ono et al., 2013; Whitehill et al., 2013).
A B
Figure 3.Isotopic results of the SO2+O2experiments described in Sect. 2.3, compared with stratospheric sulfate aerosol samples (SSA
Data) from Savarino et al. (2003), Baroni et al. (2007, 2008), Lanciki (2010), and Lanciki et al. (2012).
Quintet State
trans-OSOO
trans-OSOO cis-OSOO
cyclic-OSOO TS1
TS2
SO3
TS3 SO
2...O
Triplet state
SO2( 1A)+O(3P) TS1
TS2 TS3
TS4
cis-OSOO
Singlet state SO3
SO2( 1A)+O(1D)
-17.66 SO(3Σ-)+O
2(
3Σ
g
-)
0.00
42.76
-39.08 0.17 43.26
-142.72 70.33
-411.58
152.84
16.53 25.44 18.49
67.86
-137.07
75.14
-54.06 -58.28
-52.93
cyclic-OSOO
Figure 4.Potential energy profiles on the singlet (red) and triplet (blue) potential energy surfaces for the SO3system obtained using B3LYP optimization followed by UCCSD(T)-F12a single point calculation, with the aug-cc-pVTZ basis set. The possible intersystem crossing pathway is depicted by the solid green line. All energies are given in kJ mole−1relative to the SO(36−
)+O2(36g−)asymptote. The quintet
(black) state is shown qualitatively due to its high energy.
et al., 2008) and optical screening effects under high SO2 column densities (Lyons, 2007, 2008; Ono et al., 2013). In the narrow spectral region from 215 to 218.7 nm, where the quantum yield of photodissociation varies, it is possible that quantum yield differences between isotopologues could po-tentially produce additional isotope effects beyond those pdicted from absorption cross sections. However, in this re-gion, photodissociation occurs primarily via vibronic mixing of theC(e1B2)state levels with dissociative continuum of the electronic ground,X(e1A1)state (Katagiri et al., 1997). Due to the high density of vibronic levels for the X(e1A1)state, it is unlikely that there will be significant isotope effects in
the coupling strength between theC(e1B2)andX(e1A1)states. Dissociation occurring through mixing with repulsive sin-glet and triplet states is expected to be small, as is the non-adiabatic coupling of theC(e1B2)andD(e1A1)states (Tokue and Nanbu, 2010).
effects at higher SO2 column densities (Ono et al., 2013). In addition to the above effects, there appears to be a total (or bath gas) pressure effect on133S values. This manifests as reduced133S values at higher total (i.e., bath gas) pres-sures, which is observed with He, SO2, and N2 bath gases (Masterson et al., 2011; Whitehill and Ono, 2012; Ono et al., 2013). The mechanism responsible for these pressure effects is still uncertain, but it could suggest that33SO2has a longer excited-state lifetime prior to dissociation than the other iso-topologues.
SO2photoexcitation in the 250 to 350 nm absorption re-gion also produces absorption-based isotope effects due to differences in cross sections and optical screening effects. In addition, it produces isotope effects by a completely different mechanism. SO2photoexcitation in the 250 to 350 nm region occurs by initial excitation into a coupled A(e1A2)/B(e1B1) singlet excited state that undergoes intersystem crossing to the photochemically active tripletea(3B1)state (Xie et al., 2013; Lévêque et al., 2014). Unlike SO2photolysis, where the quantum yield of reaction (i.e., photolysis) is near unity, the quantum yield for intersystem crossing between the sin-glet and triplet states is highly variable and state-dependent. Due to the relatively low density of states in the crossing region (A(e1A2)→ea(3B1)), the branching between quench-ing to the ground state and intersystem crossquench-ing to the triplet state will be a strong function of isotope substitution. White-hill et al. (2013) argue for this isotope selective intersystem crossing as the origin of part of the isotope effects in photo-chemical products following SO2photoexcitation in the 250 to 350 nm absorption region.
Photoexcitation of SO2in the presence of O2produces sul-fate with positive133S and positive136S signals, similar to the organic sulfur observed in Whitehill et al. (2013) and the elemental sulfur in Whitehill and Ono (2012). This suggests that the anomalous isotope signatures observed from pho-toexcitation in the previous studies are a result of the photo-physics and photochemistry of excited-state SO2rather than the chemistry of the subsequent reactions (i.e., chemistry with acetylene). Our experimental results show significant discrepancy with isotope effects predicted by isotopologue-specific absorption cross sections (Danielache et al., 2012; Hattori et al., 2013) for the 250 to 350 nm region (Whitehill et al., 2013). This is expected if isotope selective intersystem crossing is contributing to the isotope signals in addition to cross-section differences and shielding effects.
4.2 Temperature effects on SO2photolysis
Lyons (2007, 2008) presented isotopologue-specific absorp-tion cross secabsorp-tions for SO2in the 190 to 220 nm absorption region by shifting the measured32SO2absorption cross sec-tions of Freeman et al. (1984) by an amount based on the cal-culated isotope shifts of Ran et al. (2007). It has been unclear whether these absorption cross sections can correctly predict the isotope effects due to SO2photolysis (Danielache et al.,
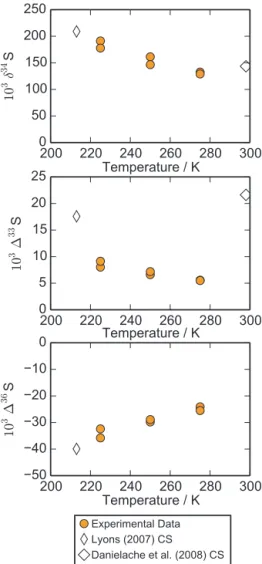
2008), as they include only isotope shifts and not other poten-tial differences among isotopologues. Previous comparisons with experimental data showed significant discrepancies (i.e., a factor of∼2 in δ34S values) between experimental data and that predicted by the Lyons (2007, 2008) cross sections (Whitehill and Ono, 2012; Ono et al., 2013). Such discrepan-cies were attributed to the difference in temperature between the Lyons (2007, 2008) cross sections, which are based on cross sections measured at 213 K (Freeman et al., 1984) and the temperature of the experiments (298 K). Given the new temperature data in the present study, it is possible to com-pare calculations based on the Lyons (2007, 2008) cross sec-tions with temperature-dependent experimental isotope data. Calculations were performed as described in previous papers (Whitehill and Ono, 2012; Ono et al., 2013) and are com-pared to experimental data in Fig. 5.
Excellent agreement with the Lyons (2007, 2008) cross sections can be seen when the observed temperature depen-dence onδ34S is extrapolated back to 213 K. A similar strong agreement is also seen in the 136S values. This new data fills in the major gap between predictions based on the Lyons (2007, 2008) cross sections and the room-temperature exper-imental data, and provides further support to an optical origin of mass-independent fractionation during SO2photolysis un-der laboratory conditions (Ono et al., 2013).
Despite the strong agreement forδ34S and 136S values, the Lyons (2007, 2008) cross sections overpredict the mag-nitude of the mass-independent isotope anomaly in33S (i.e., 133S values) when compared with experimental data. There are several possible explanations for this. One reason is that there are significant differences between the actual cross sec-tions and those predicted by shifting the32SO2 cross sec-tions for33SO2. Measurements by Danielache et al. (2008) at room temperature suggest that there are some differences between the isotopologue-specific absorption cross sections aside from just the spectral shifts accounted for by Lyons (2007, 2008). A second possibility is that the high total pres-sure (101.3 kPa, including the N2 bath gas) of the experi-ments caused a decrease in the133S value relative to the val-ues observed at lower total pressures. It has been previously observed (Masterson et al., 2011; Whitehill and Ono, 2012; Ono et al., 2013) that133S values decrease in the presence of high bath gas pressures. This pressure-quenching effect is most noticeable for133S and does not affectδ34S or 136S values as strongly.
Figure 5.Comparison of SO2 photolysis temperature experiment results with predictions from isotopologue-specific absorption cross sections (CSs).
4.3 Constraining the rate of the SO+O2+M reaction
using product formation
Our results demonstrate that photolysis of SO2in the pres-ence of molecular oxygen (O2) produces large amounts of sulfate with considerable mass-independent sulfur isotope anomalies. In our experimental system, there are three domi-nant pathways for SO3formation: OH oxidation of SO2 (Re-actions (R1) and R2, if water is present), O2oxidation of SO from SO2photolysis (Reactions R4 and R6), and O oxidation of SO2via
SO2+O+M→SO3+M. (R7)
OH and O oxidation of SO2(Reactions R1 and R7) are mass-dependent (Harris et al., 2012; Whitehill and Ono, 2012; Ono et al., 2013). However, oxidation of SO via Reaction (R6) will trap the isotopic composition of SO as SO3 and carry the mass-independent isotope signature from SO2photolysis (R4).
We performed a series of experiments at a total pressure of 101.3 kPa, a flow rate of 6.67 cm3s−1 (400 sccm), and
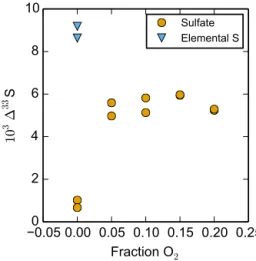
an SO2partial pressure of 0.127 kPa (Table 4; Fig. 6). The partial pressure of molecular oxygen was varied from 0 kPa to 19.8 kPa (0 to 19.5 % O2). In all experiments, SO2 was photolyzed via Reaction (R4). In the experiments with no oxygen, both elemental sulfur (S0) and SO3 aerosols were formed, with the elemental sulfur (S and related species) formed from SO via
SO+SO→SO2+S. (R8)
SO photolysis is expected to be a minor source of S com-pared to Reaction (R8). In the absence of oxygen, SO3 is formed primarily via O oxidation of SO2(R7), which is mass dependent (Ono et al., 2013).
At 5.1 kPa O2and above, elemental sulfur formation was shut off and SO3was the major product. Under these condi-tions, oxidation of SO (to SO2or SO3via Reactions (R5) or (R6)) competes with SO disproportionation Reaction (R8).
By comparing the133S value of elemental sulfur in the absence of O2(0 kPa O2) with the133S value of sulfate in the presence of O2(5.1 to 19.8 kPa O2), it is possible to es-timate the fraction of sulfate formed through Reaction (R6). In particular,
fR6=1
33S
sulfate, with O2
133SS0, no O2
, (4)
wherefR6 is the fraction of total SO3 formed that comes from Reaction (R6). Given the product yields (Table 4), the time each experiment was run, and the volume of the reaction cell (approximately 325 cm3), the sulfate forma-tion rate per unit volume per unit time can be calculated. In experiments with 5.1 to 19.8 kPa O2, the sulfate forma-tion rates were between 5.3×10¹²molecules cm−3s−1 and
1.2×10¹³molecules cm−3s−1. Combining this with thefR6 values calculated from Eq. (4), we can estimate the rate of sulfate formation from Reaction (R6) under our experimen-tal conditions. This gave a rate for Reaction (R6) of 3.6×
1012molecules cm−3s−1 to 6.6×10¹²molecules cm−3s−1.
Assuming Reaction (R6) is a termolecular reaction, the rate for Reaction (R6) can be written as
rate R6=kR6[SO][O2][M], (5) wherekR6is the termolecular rate constant for Reaction (R6) and[SO],[O2], and [M]are the concentrations of SO, O2,
and total third body gases (M=N2, O2) in the reaction cell.
In Eq. (5), the[O2]and[M]terms are known from the
experi-mental conditions. The[SO]term is estimated by assuming a
photochemical steady state for SO in the cell. SO production via Reaction (R4) is balanced by SO destruction via Reac-tions (R5) and (R6). This gives us a steady state SO concen-tration of
[SO] = JSO2[SO2]
0.05 0.00 0.05 0.10 0.15 0.20 0.25
Fraction O
20
2
4
6
8
10
10
3 ∆ 33
S
Sulfate Elemental S
Figure 6.133S values of sulfate from the photolysis of SO2in the presence of O2 compared with elemental sulfur and sulfate from SO2photolysis in the absence of O2. Conditions are described in Sect. 4.3 and Table 4.
whereJSO2 is the photolysis rate constant for Reaction (R4).
This photolysis rate constant was calculated assuming a spec-tral irradiance for our 150 W Xe arc lamp of
F0/mW nm−1=0.11·1.6·(14−9·exp
(−0.013·(λ/nm−200))), (7) where F0 is the spectral irradiance of the xenon lamp at wavelengthλ(Ono et al., 2013). This flux might be modified slightly as a function of the distance between the cell and the lamp, due to interferences from the absorption of oxy-gen. However, sensitivity studies performed here and previ-ously (Whitehill and Ono, 2012) suggest that the effect of the oxygen absorption on the total SO2 photolysis rate is minor compared to the uncertainty in the lamp photon flux. The lamp photon flux data was determined from the manu-facturer’s data and uncertainty estimates were not available. Despite this, the function used by Ono et al. (2013) (Eq. 7) was used to obtain an estimate for the total SO2photolysis rate.
The spectral irradiance of the lamp was used to cal-culate the photon flux entering the cell, accounting for the absorption of the cell windows from measured trans-mission data. The SO2 absorption cross sections of Man-att and Lane (1993) were used to calculate the photoly-sis rate in the cell, accounting for optical screening ef-fects from SO2and O2within the cell. With an SO2partial pressure of 0.127 kPa, this provided a photolysis rate con-stant of JSO2=5.2×10⁻³s−1, The rate constant for
Reac-tion (R5) iskR5=8.0×10−37cm3molecule−1s−1(Sander
et al., 2011) at room temperature (298 K). Using these values and Eqs. (5) and (6), the rate constant for Reac-tion (R6) was calculated iteratively. Calculated rate constants ranged fromkR6=7.3×10−38cm6molecule−2s−1tokR6=
1.4×10−37cm6molecule−2s−1, with an average value of
kR6=1.1×10−37cm6molecule−2s−1 (Table 4). This rate
estimate is consistent with the upper bound on kR6≤1×
10−36cm6molecule−2s−1by Black et al. (1982).
The calculated rate constant (kR6) appears to decrease at 19.8 kPa O2compared with the calculated rate for lowerpO2 values. It is unclear why this behavior is observed. The rela-tively strong agreement for the other conditions strengthens our confidence that the model is robust.
The derived rate constant carries uncertainty due to a num-ber of sources of error in the rate calculation. One source of error in the calculation is in the spectral irradiance of the xenon lamp, which was fit from the manufacturer’s literature and not directly measured. Because the spectral irradiance is likely to change over the lamp’s lifetime, the actual spec-tral irradiance at the time the experiments were performed might be different than the values calculated here. As the spectral irradiance in the high-energy side of the ultravio-let (190 to 220 nm) is likely to decrease over the course of the lamp’s lifetime, this makes the calculated SO2 photoly-sis rate (and resulting SO number density) most likely to be an upper bound. Reducing the SO2photolysis rate increases the effective rate constant. A second source of error is the assumption that we trapped 100 % of the SO3formed as sul-fate. It is possible that some fraction of the SO3remained in the gas phase and did not condense as aerosol particles. A third source of error is the assumption that the Reaction (R6) behaves as a termolecular reaction despite the high total pres-sure (101.3 kPa) of the system. It is possible that the reaction is saturated at (or near) this pressure and is thus behaving as an effective bimolecular reaction In any of these three cases, the estimate of the rate constant for Reaction (R6) would be a lower bound on the actual termolecular rate constant.
It is also important to consider the impact of water vapor within the system. Although attempts were made to minimize the amount of water vapor in the system, there was almost certainly some water vapor in the system during our experi-ments. This is evidenced by the visible formation of sulfate aerosols from SO3during the experiments. Unfortunately, we did not have the analytical capability to quantitatively con-strain the amount of water vapor in the system during the ex-periments. The Zero Air and Ultra High Purity Nitrogen used as a source of gas to the cell had maximum of 3 ppm H2O (by volume), but there could be additional water absorbed onto the surfaces of the system while the cell was disassembled. We assume 100 % of the SO3was trapped as sulfate, giving a lower bound estimate on the rate of Reaction (R6).
4.4 Constraining the rate of the SO+O2+M reaction
using a kinetic model
To further constrain the rate of Reaction (R6) (the SO+O2+
M→SO3+M reaction), we constructed a kinetic model of
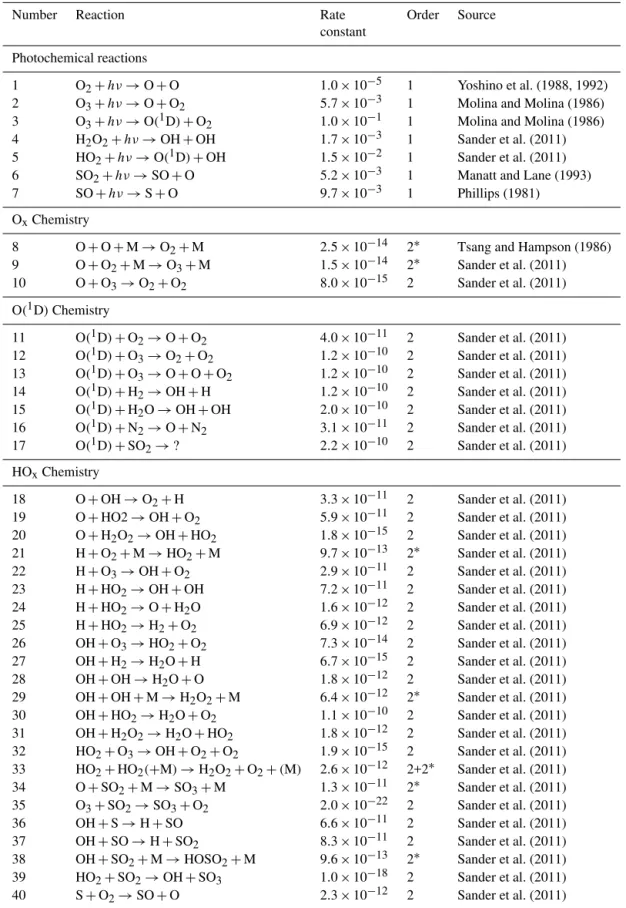
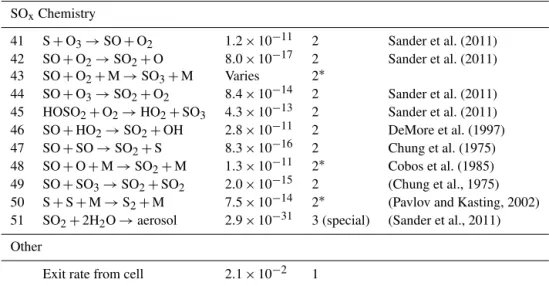
rates were calculated using the cross sections of Yoshino et al. (1988, 1992) for O2 and Molina and Molina (1986) for O3. Quantum yields for O(1D)vs. O(3P)formation from O3 photolysis were parameterized based on the recommenda-tion of DeMore et al. (1997). Photolysis rates for HO2and H2O2were calculated using the recommended cross sections of Sander et al. (2011). HO2photolysis was assumed to pro-duce O(1D)and OH as products, and H2O2 photolysis was assumed to produce 2OH.
The rate constants and their sources are given in Ta-ble 9. Effective second-order rate constants (assumingT =
298 K and [M] =2.5×10¹⁹molecule cm−3) were used for
termolecular reactions. Initial guesses were made for the con-centration of species within the system. The system was as-sumed to be in photochemical steady state and solved iter-atively until convergence. Comparisons were made between the data and the calculations forfR6 values (Eq. 4). Simu-lations were performed with values of kR6 of 1.0×10−37,
1.0×10−36, and 1.0×10⁻³⁵cm6molecule−2s−1. Since the
amount of water vapor in the system was not constrained ex-perimentally, three simulations were performed, with H2O concentrations of 0 ppm (by volume), 10 ppm (by volume), and 100 ppm (by volume), which spans a range of reason-able estimates for water vapor concentration within the sys-tem. Although water vapor in the bath gas (N2 and N2/O2) are less than 3 ppm (by volume), additional water could be absorbed onto the inner surfaces of the cell and re-leased during the experiment. Results for 0 ppm H2O and 10 ppm H2O predict rate for Reaction (R6) on the order of 10−36cm6molecule−2s−1, with predictions for 100 ppm
H2O being slightly higher.
There is a discrepancy between model predictions and the observed experimental behavior. In particular, lower O2 frac-tions produce higher estimated rates and vice versa. In addi-tion, the model predicts rates mostly higher than the previous upper bound on the rate calculated by Black et al. (1982) of 10−36cm6molecule−2s−1. Helium was used as a bath gas
for the Black et al. (1982) experiments, as compared with nitrogen or nitrogen/oxygen used as the bath gas here. Ni-trogen (N2) and oxygen (O2) are more efficient third body quenchers than helium. Thus, the rate of the termolecular reaction with nitrogen (or nitrogen/oxygen) as a bath gas could be higher than the maximum constraint suggested by Black et al. (1982). There is also an order of magnitude dis-crepancy between predictions here and those in Sect. 4.3, with those in Sect. 4.3 being an order of magnitude smaller than those in Sect. 4.4. This could be based on the as-sumption that 100 % of the SO3 was trapped as sulfate in Sect. 4.3, whereas the actual amount might be less than that (implying a higher rate than predicted in Sect. 4.3). However, the model predicts rate constants within an order of magni-tude of previous constraints from the literature Black et al. (1982) and within an order of magnitude of predictions from Sect. 4.3. Based on this work, we estimate the termolecular rate constant of Reaction (R6) to be on the order of 10−37to
10−36cm6molecule−2s−1. Future work is necessary to
bet-ter constrain the rate of this reaction.
4.5 Exploring the potential energy surfaces of the SO+O2reactions
The experimental evidence presented above suggests the for-mation of SO3via the SO+O2reaction. Our theoretical
anal-yses shows that the singlet PES is associated with the ground state of the SO3 molecule, and thus is the primary surface related to the SO(36−)+O2(36−g)→SO3(1A′1) reaction (Fig. 4). As shown in Table 7, four isomers of SO3are located on the singlet PES. It is predicted that the D3hSO3isomer is the global minimum, followed by cyclic-OSOO. There are two shallower wells, denoted as trans-OSOO and cis-OSOO, at the CASPT2 and UCCSD(T)-F12a levels, but they ap-pear to be energetically higher than the SO(36−)+O
2(36g−) asymptote at the B3LYP and CASSCF levels. No barrier was found for the formation of either trans-OSOO or cis-OSOO, but there is a barrier for the isomerization and the barrier height depends upon the level of the ab initio cal-culation. The rate-determining barrier for the SO(36−)+
O2(36g−)→SO3(1A′1)reaction is the one connecting cyclic-OSOO and SO3. The lowest barrier height for this reac-tion (given by CASPT2) is 56.6 kJ mole−1. Using the
par-tition function at the B3LYP level, a conventional transition-state theory rate calculation predicts a pressure-saturated (i.e., effective bimolecular) thermal rate constant for Reac-tion (R6) at 298 K of 2.7×10⁻²⁴cm3molecule−1s−1. This is
about 8 orders of magnitude lower than the experimental rate constant for Reaction (R5) (8.0×10⁻¹⁷cm3molecule−1s−1,
Sander et al., 2011), and about 6 orders of magni-tude lower than the predicted effective second-order rate constant for Reaction (R6) at 101.3 kPa total pressure (about 2.5×10⁻¹⁸cm3molecule−1s−1, calculated
assum-ingkR6=1.0×10−37cm6molecule−2s−1and[M] =2.5×
1019molecules cm−3). We thus conclude that the SO(36−)+
O2(36g−)→SO2(1A1)+O(3P)reaction cannot occur on the singlet surface without invoking the spin-forbidden intersys-tem crossing between the singlet and triplet surfaces.
The triplet PES is very different from the singlet PES with regard to the energy of each SO3 isomer (Fig. 4, Ta-ble 8). The global minimum moves to the cyclic-OSOO iso-mer, which has a similar geometry to the singlet (ground) state counterpart but with different bond lengths. On the other hand, SO3(3A′1)becomes highly unfavorable; for ex-ample, it is 75.14 kJ mole−1higher than the SO
+O2reactants
at the UCCSD(T)-F12a level. The trans-OSOO complex re-mains in a planar geometry, in which the O-S-O-O dihedral angle is 180◦; however, the cis-OSOO complex was found
to be out of plane, in which the O-S-O-O dihedral angle is about 74◦. We still use “cis-OSOO” to denote this isomer for
Table 9.Reactions and rate constants included in the kinetic model of the chemistry occurring within reaction cell. Rate constants have units of s−1for first order reactions, cm3molecule−1s−1for second order reactions (and effective second order reactions, denoted 2∗), and cm6molecule−2s−1for third order reactions.
Number Reaction Rate Order Source
constant
Photochemical reactions
1 O2+hν→O+O 1.0×10⁻⁵ 1 Yoshino et al. (1988, 1992)
2 O3+hν→O+O2 5.7×10⁻³ 1 Molina and Molina (1986)
3 O3+hν→O(1D)+O2 1.0×10⁻¹ 1 Molina and Molina (1986)
4 H2O2+hν→OH+OH 1.7×10⁻³ 1 Sander et al. (2011)
5 HO2+hν→O(1D)+OH 1.5×10⁻² 1 Sander et al. (2011)
6 SO2+hν→SO+O 5.2×10⁻³ 1 Manatt and Lane (1993)
7 SO+hν→S+O 9.7×10⁻³ 1 Phillips (1981)
OxChemistry
8 O+O+M→O2+M 2.5×10⁻¹⁴ 2∗ Tsang and Hampson (1986)
9 O+O2+M→O3+M 1.5×10⁻¹⁴ 2∗ Sander et al. (2011)
10 O+O3→O2+O2 8.0×10⁻¹⁵ 2 Sander et al. (2011)
O(1D)Chemistry
11 O(1D)+O2→O+O2 4.0×10⁻¹¹ 2 Sander et al. (2011)
12 O(1D)+O3→O2+O2 1.2×10⁻¹⁰ 2 Sander et al. (2011)
13 O(1D)+O3→O+O+O2 1.2×10⁻¹⁰ 2 Sander et al. (2011)
14 O(1D)+H2→OH+H 1.2×10⁻¹⁰ 2 Sander et al. (2011)
15 O(1D)+H2O→OH+OH 2.0×10⁻¹⁰ 2 Sander et al. (2011)
16 O(1D)+N2→O+N2 3.1×10⁻¹¹ 2 Sander et al. (2011)
17 O(1D)+SO2→? 2.2×10⁻¹⁰ 2 Sander et al. (2011)
HOxChemistry
18 O+OH→O2+H 3.3×10⁻¹¹ 2 Sander et al. (2011)
19 O+HO2→OH+O2 5.9×10⁻¹¹ 2 Sander et al. (2011)
20 O+H2O2→OH+HO2 1.8×10⁻¹⁵ 2 Sander et al. (2011)
21 H+O2+M→HO2+M 9.7×10⁻¹³ 2∗ Sander et al. (2011)
22 H+O3→OH+O2 2.9×10⁻¹¹ 2 Sander et al. (2011)
23 H+HO2→OH+OH 7.2×10⁻¹¹ 2 Sander et al. (2011)
24 H+HO2→O+H2O 1.6×10⁻¹² 2 Sander et al. (2011)
25 H+HO2→H2+O2 6.9×10⁻¹² 2 Sander et al. (2011)
26 OH+O3→HO2+O2 7.3×10⁻¹⁴ 2 Sander et al. (2011)
27 OH+H2→H2O+H 6.7×10⁻¹⁵ 2 Sander et al. (2011)
28 OH+OH→H2O+O 1.8×10⁻¹² 2 Sander et al. (2011)
29 OH+OH+M→H2O2+M 6.4×10⁻¹² 2∗ Sander et al. (2011)
30 OH+HO2→H2O+O2 1.1×10⁻¹⁰ 2 Sander et al. (2011)
31 OH+H2O2→H2O+HO2 1.8×10⁻¹² 2 Sander et al. (2011)
32 HO2+O3→OH+O2+O2 1.9×10⁻¹⁵ 2 Sander et al. (2011)
33 HO2+HO2(+M)→H2O2+O2+(M) 2.6×10⁻¹² 2+2∗ Sander et al. (2011)
34 O+SO2+M→SO3+M 1.3×10⁻¹¹ 2∗ Sander et al. (2011)
35 O3+SO2→SO3+O2 2.0×10⁻²² 2 Sander et al. (2011)
36 OH+S→H+SO 6.6×10⁻¹¹ 2 Sander et al. (2011)
37 OH+SO→H+SO2 8.3×10⁻¹¹ 2 Sander et al. (2011)
38 OH+SO2+M→HOSO2+M 9.6×10⁻¹³ 2∗ Sander et al. (2011)
39 HO2+SO2→OH+SO3 1.0×10⁻¹⁸ 2 Sander et al. (2011)
Table 9.Continued.
SOxChemistry
41 S+O3→SO+O2 1.2×10⁻¹¹ 2 Sander et al. (2011)
42 SO+O2→SO2+O 8.0×10⁻¹⁷ 2 Sander et al. (2011)
43 SO+O2+M→SO3+M Varies 2∗
44 SO+O3→SO2+O2 8.4×10⁻¹⁴ 2 Sander et al. (2011)
45 HOSO2+O2→HO2+SO3 4.3×10⁻¹³ 2 Sander et al. (2011)
46 SO+HO2→SO2+OH 2.8×10⁻¹¹ 2 DeMore et al. (1997)
47 SO+SO→SO2+S 8.3×10⁻¹⁶ 2 Chung et al. (1975)
48 SO+O+M→SO2+M 1.3×10⁻¹¹ 2∗ Cobos et al. (1985)
49 SO+SO3→SO2+SO2 2.0×10⁻¹⁵ 2 (Chung et al., 1975)
50 S+S+M→S2+M 7.5×10⁻¹⁴ 2∗ (Pavlov and Kasting, 2002)
51 SO2+2H2O→aerosol 2.9×10⁻³¹ 3 (special) (Sander et al., 2011)
Other
Exit rate from cell 2.1×10⁻² 1
∗Effective second order reactions based on falloff curves for [M]=2.5×10¹⁹and M=N
2, O2. See sources for additional
information.
for the reaction on the triplet surface. The barrier height is 67.86 kJ mole−1at the UCCSD(T)-F12a level, which is still
high. In the adiabatic picture, the SO(36−)+O2(36g−)→
SO2(1A1)+O(3P)reaction on the triplet PES has a rate con-stant of 2.7×10⁻²⁵cm3molecule−1s−1at 298 K, estimated
using transition-state theory. This is still considerably slower than the experimentally measured rate constant for Reac-tion (R5).
It is clear that a single PES is unable to reproduce the perimental data for Reactions (R5) and (R6). In order to ex-plore the possibility of intersystem crossing, two adiabatic minimum energy pathways on both spin states are shown in Fig. 4 and the energies are extracted at the UCCSD(T)-F12a//B3LYP level. There are several places that the two PESs cross each other, and a spin flip could happen in the region near the cyclic-OSOO isomer due to the fact that this isomer on both PESs has nearly the same energy. A pos-sible non-adiabatic reaction pathway is depicted in Fig. 4 by green solid lines connecting every two stationary points. Specifically, for the SO(36−)+O2(36g−)→SO3(1A′1) re-action, the two reactants first approach each other to form cyclic-OSOO on the singlet PES, and jump to the triplet PES to avoid the high barrier region, followed by back tran-sition to the singlet state to form the SO3 product. For the SO(36−)+O2(36g−)→SO2(1A1)+O(3P)reaction, the in-termediate cyclic-OSOO may be generated on the singlet PES < followed by intersystem crossing from the singlet to triplet surface and then reach the products without overcom-ing a high barrier. Indeed, several different mechanisms in-troducing the intersystem crossing have been proposed by other authors for the SO3→SO2+O reaction (Davis, 1974;
Westenberg and Dehaas, 1975; Astholz et al., 1979), thanks to the relatively large spin-orbit coupling of the heavy sulfur. The barrier associated with the intersystem crossing pathway
seems to be consistent with the fast rate of Reaction (R5), and supports the facile formation of SO3.
Unfortunately, rate constants involving the intersystem crossing cannot be readily determined from the current cal-culations. Global PESs for both spin states and the coupling between them would be required for a complete calcula-tion. Such a goal can only be achieved by a multi-reference method or configuration interaction method, which is infea-sible at the current level. On-the-fly surface-hopping calcula-tions would present an alternative method to derive rate con-stants without the need for global potential energy surfaces and should be pursued in future work.
4.6 Contribution of the SO+O2+M reaction to
sulfate formation in the stratosphere
To determine the significance of Reaction (R6) to sulfate for-mation in the stratosphere, we compared the rate of sulfate formation via Reaction (R6) to that formed via OH oxida-tion of SO2 (Reaction R1) and O oxidation of SO2 (Reac-tion R7) under a select set of atmospheric condi(Reac-tions. We as-sumed an atmospheric temperature and pressure profile of the U.S. Standard Atmosphere 1976 (COESA, 1976) and noon-time O, OH, and O3concentrations given by DeMore et al. (1997). Spectral photon flux in the 180 to 220 nm region was calculated as a function of altitude for a solar zenith angle of 40◦, assuming the spectral photon irradiance of Rottman et
photoly-sis rates (JSO2) were calculated as a function of altitude using the calculated spectral photon fluxes and the SO2absorption cross sections of Manatt and Lane (1993).
The lifetime of SO with respect to oxidation by O2(i.e., Reactions (R5) and (R6)) is relatively short (on the order of seconds), so SO and SO2were assumed to be in photochem-ical steady state, i.e.,
[SO] [SO2]=
JSO2
kR5[O2] +kR6[O2][M]. (8)
The rate constant kR5 was calculated as a function of al-titude (i.e., temperature) based on the recommendations of Sander et al. (2011). kR6 was varied between 1.0×10−37
and 1.0×10−36cm6molecule−2s−1to encompass the order
of magnitude rate estimates from Sects. 4.3 and 4.4. SO ox-idation by other oxidants (O3, O, NO3, etc.) was assumed to be minor compared to oxidation by O2given the minor con-centration of most of these species compared with that of O2. Using the[SO]to[SO2]ratios, the rates of Reactions (R1),
(R6), and (R7) can be compared. Assuming these three re-actions are the dominant sources of SO3(and subsequently sulfate) in the stratosphere, the fraction of sulfate from Reac-tion (R6) (fSO) can be calculated as
fSO=
[SO]
[SO2]·kR6[O2][M]
kSO2+OH[OH] +kSO2+O[O] +[[SOSO2]]·kR6[O2][M]
. (9)
The rate constantskSO2+OHandkSO2+Oare the effective
bi-molecular rate constants for Reactions (R1) and (R7), as rec-ommended by Sander et al. (2011).fSOvalues were calcu-lated for a 40◦solar zenith angle (local noon at 40◦N latitude
and a 0◦] solar declination angle) and are shown in Fig. 8.
Given that SO, OH, and O(3P)are all formed as a result of photochemistry, they should have similar daily cycles. As a result, the fSOvalues calculated for local noon should be similar to daily averagefSOvalues.
As seen in Fig. 8, the lower estimate for kR6 (1.0×
10−37cm6molecule−2s−1) gives 4 % to 10 % of sulfate from
Reaction (R6) between 25 and 50 km altitude. A faster esti-mate forkR6of 2.0×10−37cm6molecule−2s−1gives 8 % to
18 % of sulfate from Reaction (R6) between 25 and 50 km altitude. The upper bound estimate for the rate (kR6=1.0×
10−36cm6molecule−2s−1, from Black et al., 1982)
sug-gests that over 45 % of sulfate could be coming from Re-action (R6) between 31 and 34 km altitude and is probably unrealistic. The contribution from Reaction (R6) depends upon the amount of photons available for SO2 photolysis, which increases with altitude because of less absorption by the Schumann–Runge band of O2and the Hartley bands of O3. The rate of Reaction (R6) decreases at higher altitude as the total number density decreases. The maximumfSOvalue, thus, is between around 30 and 35 km (Fig. 8).
Some insight into the rate can be obtained from SO2 life-times in the stratosphere. Following the Mt. Pinatubo (1991) eruption, the Total Ozone Mapping Spectrometer (TOMS)
% O 2
5 10 15 20
fR6
0 0.2 0.4 0.6 0.8
1 0 ppm H2O
% O 2
5 10 15 20
fR6
0 0.2 0.4 0.6 0.8
1 10 ppm H2O
% O 2
5 10 15 20
fR6
0 0.2 0.4 0.6 0.8
1 100 ppm H2O
k(3) = 10-37
k(3) = 10-36
k(3) = 10-35
k(3) = 10-37
k(3) = 10-36
k(3) = 10-35
k(3) = 10-37
k(3) = 10-36
k(3) = 10-35
Figure 7.Results of kinetic model (Sect. 4.4, Table 9) compared to experimental data (circles) forfR6 (Eq. 4) vs. fraction of SO3
formed from Reaction R6 in the model. Contours on the plot are labeled with the value of rate constantkR6input into the model for
a given run. Experimental data is plotted as black circles. The model was run for three input values of H2O concentration: 0 ppmv (top), 10 ppmv (middle), and 100 ppmv (bottom).