Article
J. Braz. Chem. Soc., Vol. 26, No. 5, 949-954, 2015. Printed in Brazil - ©2015 Sociedade Brasileira de Química 0103 - 5053 $6.00+0.00
A
*e-mail: [email protected]
Determination of Boron Isotope Ratios in Tooth Enamel by Inductively Coupled
Plasma Mass Spectrometry (ICP-MS) After Matrix Separation by Ion Exchange
Chromatography
Maoyong He,*,a Zhangdong Jin,a Chongguang Luo,b Li Deng,a Jun Xiaoa and Fei Zhang a
aState Key Laboratory of Loess and Quaternary Geology, Institute of Earth Environment,
Chinese Academy of Sciences, 710075 Xi’an, China
bState Key Laboratory of Ore Deposit Geochemistry, Institute of Geochemistry,
Chinese Academy of Sciences, 550002 Guiyang, China
Boron isotopes in teeth has been a new proxy for dietary reconstructions and its resistance to diagenetic alteration. In this study a method using inductively coupled plasma source mass spectrometry (ICP-MS) for the measurement of boron isotope ratio in human dental enamel has been developed. Human dental enamel were digested with HNO3-H2O2 in a microwave system.
Boron in solution was separated from the matrix components using Amberlite IRA-743 resin. The factors that may affect precision and accuracy in isotope ratio determination by ICP-MS, including memory effects, mass bias drift, and concentration effects, were investigated to obtain optimum conditions. Then, the 10B/11B ratios in teeth were measured. The results showed that 2% of HNO
3
+ 2% of NH3•H2O, selected as the diluent/rinse solution could be effective in the elimination of
boron memory effect. There was no concentration effect on boron isotope ratios when the ratio of samples B concentration to standard B concentration (refers to Csample/Cstd) varied from 0.5 to 2.
The result of 10B/11B ratios in tooth enamel by sex and age luctuated over a broad range, ranged
from 0.2007 to 0.2574. This method is expected to be used for boron isotope ratio analyses in archeometry, forensic identiication, paleoecology, and other disciplines in the future.
Keywords: boron isotope ratios, tooth enamel, inductively coupled plasma mass spectrometry (ICP-MS), ion exchange separation
Introduction
Human teeth are valuable archives of the life history and behaviour of vertebrates. The bioapatite of the skeletal remains records in its element and isotope composition information about the diet, physiology and mobility as well as climate and environmental conditions. If this geochemical information is not biased by chemical alteration during fossilisation, it can provide valuable insights into the palaeobiology, palaeoecology, and evolution of extinct vertebrates.1-3
Boron is shown to be an essential element for plants early this century and there is now evidence that it is also necessary for humans. Boron is distributed throughout the human body with the highest concentration in the bones and dental enamel. It is surprising that boron was found in teeth in the range as high as 25-85 ppm. Boron was found to
be signiicantly increased in carious teeth than non-carious teeth despite loss of minerals during cariogenesis.4 Because food provides most of the boron ingested daily by terrestrial mammals (e.g., ca. 90% in humans), the boron isotope of bioapatite could potentially be a new paleodietary proxy.5,6
The determination of boron isotope ratios (10B/11B) has been carried out by a variety of methods. These include atomic absorption spectrometry,7-9 thermal ionisation mass spectrometry (TIMS),10-14 multi-collector inductively coupled plasma mass spectrometry (MC-ICP-MS),15-18 glow discharge mass spectrometry (GDMS), the secondary ion mass spectrometry (SIMS),19 laser ablation multicollector inductively coupled plasma mass spectrometry (LA-MC-ICP-MS),20-22 spark source mass spectrometry,23 and inductively coupled plasma mass spectrometry (ICP-MS), etc.24-35
by ion exchange separation. The factors that may affect precision and accuracy in isotope ratio determination by ICP-MS include memory effects, mass bias drift, and concentration effects were carried out to obtain optimum conditions. The present method is applicable to a wide ield of boron isotopic research in teeth enamel for dietary reconstructions and its resistance to diagenetic alteration.
Experimental
Instrumentation
Instrumentation included a ICP-MS (Perkin Elmer-Nexion 300D, PerkinElmer Corporation, USA) with an S10 autosampler, optimized by using a standard 89Y solution at a concentration of 10 ppb in 2% HNO3, the MARS 6 microwave-assisted digestion system (CEM Microwave Technology Ltd operates, USA) and the Milli-Q ultrapure water system (Millipore Corporation, USA).
Reagents and materials
Boron isotopic reference materials: National Institute of Standards and Technology (NIST) boric acid SRM 951 (formerly NBS SRM 951 of the National Bureau of Standards, USA). A certiied reference material of bone ash (SRM NIST 1400) and bone meal (SRM NIST 1486) from National Institute of Standards and Technology were also used. Milli-Q H2O (18.2 MΩ at 25 °C) from Millipore (Elix-Millpore, USA). HNO3 was obtained from the Beijing Institute of Chemical Reagent and puriied using the SavillexTM DST-100 sub-boiling distillation system (Minnetonka, MN, USA). H2O2 (30 wt.% in H2O) was from Sigma-Aldrich Co. LLC.
Experimental methods
Collection and treatment of permanent teeth
The permanent teeth were collected from 7 to 79 years old male and female humans who have lived in Shaanxi (NW China) for many years.36 The healthy teeth were extracted from sample providers who do not smoke or drink. The teeth were healthy permanent teeth extracted due to impacted wisdom tooth deformity, orthodontic treatment, or other reasons. Extracted teeth with complete crowns, no caries or mottled enamel, complete enamel development, and no obvious wear or defects on the morsal surface were selected. The selected carious teeth exhibited clear cavities. The teeth were soaked in acetone solution for 24h. Then, the teeth were separated and ground following the method described in literature.37-41
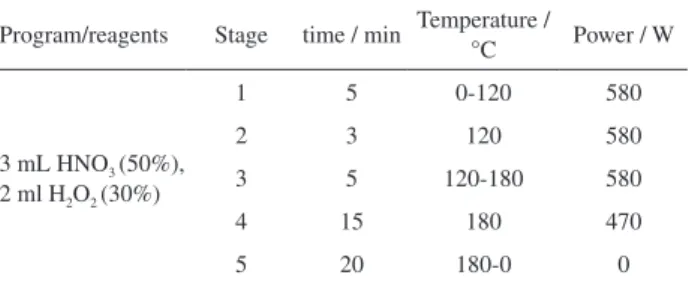
The microwave digestion conditions used in this study for teeth digestion were adapted to those previously used for biological samples following the method of Li et al.36 with some modiication.Teeth samples were weighed, ground to powder using mortar and pestle, and weighed again before the digestion (depending on the tooth type and size, they ranged from 0.0090 to 0.7350 g). In this study, powdered teeth samples were pre-dissolved in 3 mL of 50% HNO3 solution and 2 mL of 30% H2O2 solution using microwave digestion tank (The MARS 6 microwave-assisted digestion system, CEM Microwave Technology Ltd operates, USA). The tank was then gently shaken. Approximately 3 mL Milli-Q water was added dropwise, and the samples were digested according to procedure in Table 1.
For the certiied reference material (NIST SRM 1400 and NIST SRM 1486), an amount of ca. 0.0500 g of sample was digested in microwave as described above.
Separation and enrichment of B with an ion-exchange process
The mineral phases of tooth enamel are mostly hydroxyapatite crystals of various structures and composition with incorporated trace elements. Major elements found in enamel are Ca, P, Na, Mg, and Cl. Their mean concentrations are well known, and their approximate concentrations are 37% Ca; 18% P; 0.4% Mg; 0.7% Na, and 0.28% Cl. Because of unavoidable matrix interference during the measurement of the 10B and 11B isotopes with ICP-MS, even after microwave digestion of the samples, it was necessary to separate B from all the other elements and matrix components still present. An ion exchange procedure using Amberlite IRA 743 was adapted and optimized for this purpose.18,33 The detailed methods of the experiment are listed in Table 2.
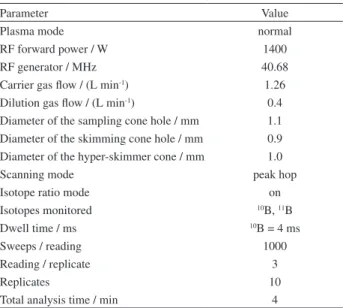
11B/10B isotope ratio measurements
11B/10B isotope ratio was determined by inductively
coupled plasma mass spectrometry (ICP-MS, Perkin Elmer-Nexion 300D, PerkinElmer Corporation, USA) with an S10 autosampler. The ICP-MS instrument operating parameters were established by automatically optimizing the Table 1. Microwave digestion programs for teeth
Program/reagents Stage time / min Temperature /
°C Power / W
3 mL HNO3 (50%),
2 ml H2O2 (30%)
1 5 0-120 580
2 3 120 580
3 5 120-180 580
4 15 180 470
instrument conditions. The ICP-MS operating parameters are given in Table 3.
Determination of the B isotope ratio, 11B/10B, by means of ICP-MS is complicated by a large mass discrimination effect (because of the relatively large mass difference between the two B isotopes) and the drift in the mass discrimination during measurement, which may lead to a concomitant drift in the measured isotope ratio. Therefore, to take into account the variations in mass bias with time, we employed the correction method using the NIST SRM 951 as standard sample.31 The isotopic ratio of boron (10B/11B)
meas was calculated by equations (1) and (2):
(
10 11)
10 samp 10 blk11 11
meas
samp blk
B B
B/ B = f
B B
−
×
− (1)
(
)
11 11 11 11
10 11
std1 blk std2 blk
10 10 10 10 cert
std1 blk std2 blk
B B B B
1
( ) B/ B
2 B B B B
f − + − ×
− −
= (2)
Here, the signal intensities of 10B and 11B in the sample solution is represented as 10B
samp and 11B
samp, the certiied standard value of the 10B/11B ratio for NIST SRM 951 is represented as (10B/11B)
cert, and the measured value of the isotopic ratio of boron for each sample as (10B/11B)
meas. The signal intensities of 10B and 11B in the blank solution and NIST SRM 951 solution averaged over n measurements are represented in the Table 4. The measurements were repeated 10 times for each sample and the average was set as the measured value.
Results and Discussion
Boron memory effects
The high sensitivity of ICP-MS makes this technique suitable, reliable and rapid for boron determinations. However, measuring boron at ultratrace levels by ICP-MS often present a signiicant memory effect. Over the past decades, most researchers have used several methods to eliminate boron memory effect. One was direct injection nebulization (d-DIHEN),29 and another was using different diluents/rinse solution, including water, nitric acid, Triton X-100, ammonia and mannitol in water, in nitric acid and in ammonia.26 These attempts has been achieved satisfactory results.
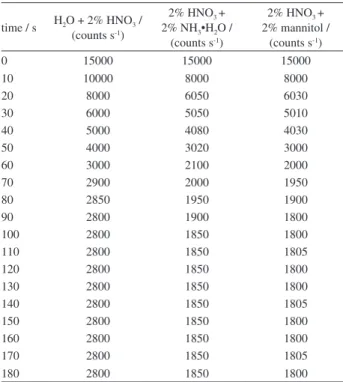
Several reagents, including water and 2% of HNO3, 2% of HNO3 + 2% NH3•H2O and 2% of HNO3 + 2% mannitol were tested and evaluated according to the memory effect, the analytical precision and the background. For each reagent, an equivalent blank and a 100 ng mL-1 standard solution were analyzed. The ion-time response for 11B+ was continuously monitored. First, the signal was collected with the reagent blank for about 5 min, then the B solution with the same reagent was introduced for 5 min, and inally the reagent blank was introduced again as the lush solution for about 10 min. Table 5 and Figure 1 gives the B ion-time response (counts s-1) for the selected reagents.
Table 3. Experimental conditions used for the ICP-MS measurements
Parameter Value
Plasma mode normal
RF forward power / W 1400
RF generator / MHz 40.68
Carrier gas low / (L min-1) 1.26
Dilution gas low / (L min-1) 0.4
Diameter of the sampling cone hole / mm 1.1 Diameter of the skimming cone hole / mm 0.9 Diameter of the hyper-skimmer cone / mm 1.0
Scanning mode peak hop
Isotope ratio mode on
Isotopes monitored 10B, 11B
Dwell time / ms 10B = 4 ms
Sweeps / reading 1000
Reading / replicate 3
Replicates 10
Total analysis time / min 4
Table 2. Columns for B separations using Amberlite IRA 743 resin
Stage Column Procedure Reagent 1 Rinse Milli-Q water (100 µL × 4) 2 Clean 2% HNO3 (100 µL × 4)
3 Precondition column Acetic buffer (100 µL × 4) 4 Precondition column Milli-Q water (100 µL × 4)
5 Load sample 50 µL × 10
6 Wash Milli-Q water (50 µL × 4) 7 Wash Milli-Q water (100 µL × 4) 8 Elute B 2% HNO3 (100 µL × 4) 9 Tailing check 2% HNO3 (50 µL × 2) 10 Neutralize resin Milli-Q water (100 µL × 4)
Table 4. The measurement procedure for boron isotope ratios
Step Procedure n
1 Measure signal ratio of 10B/11B of blank solution
(10B blk, 11Bblk)
3
2 Measure 10B/11B of standard sample NIST SRM 951
(10B std1, 11Bstd1)
10
3 Rinsing of sample introduction tube, spray chamber and nebulizer (500 s)
-4 Measure 10B/11B of sample solution (10B
samp, 11Bsamp) 10
5 Rinsing of sample introduction tube, spray chamber and nebulizer (500 s)
-6 Measure 10B/11B of standard sample NIST SRM 951
(10B std2, 11Bstd2)
Figure 1 gives the B ion-time response (counts s-1) for the selected reagents. The results show that 2% HNO3 + 2% NH3•H2O and 2% HNO3 + 2% mannitol exhibit similar and signiicant memory effects. Then 2% HNO3 + 2% NH3•H2O was selected for sample analysis in this text.
Effects of B concentration on the measured B isotope ratios
The term concentration effects used here refers to the phenomenon that mass fractionation during plasma source mass spectrometry varies with changes in concentration of sample solutions compared to the standard solution under a given set of working conditions. This phenomenon may
be regarded as a special case of matrix effects. So, it was important to maintain the similar concentration of B in sample and standard solution.
To investigate the feasibility of concentration effect, a series of measurements have been carried out using NIST SRM 951 B solutions with B concentrations varying from 0.05 to 1.5 ppm (refers to Csample) vs. the same NIST SRM 951 B solution at a ixed concentration of 0.5 ppm (refers to Cstd). The measured B isotope ratios of the “sample” varing with Csample/Cstd was plotted in Figure 2. These variations cannot be explained by molecular interferences, but must result from instrumental mass fractionation. This implies that the instrumental fractionation of B isotopes varies according to the B concentration introduced into the mass spectrometer, at least for the given set of working conditions. It can be seen from Figure 2, when Csample/Cstd varied from 0.5 to 2, and there was no effect on boron isotope ratios.
Reproducibility of the measurement
To test the analytical precision and accuracy of the methods above, the boron isotope ratios of NIST SRM 951 were measured in 220 days. The results are illustrated in Figure 3. The reproducibility of all the measurements shown in Figure 3 fell below 0.2% RSD, indicating the long-term reproducibility of measurement.
Determination of 10B/11B ratios in tooth enamel
Using the above described experimental procedures, the B isotopes in the enamel of the extracted teeth were chemically separated and measured. The result of 10B/11B ratios in tooth enamel by sex and age were shown in Table 6 and Figure 4.
Table 5. Relationship between boron ion strength and changes with the cleaning time
time / s H2O + 2% HNO3 /
(counts s-1)
2% HNO3 +
2% NH3•H2O /
(counts s-1)
2% HNO3 +
2% mannitol / (counts s-1)
0 15000 15000 15000
10 10000 8000 8000
20 8000 6050 6030
30 6000 5050 5010
40 5000 4080 4030
50 4000 3020 3000
60 3000 2100 2000
70 2900 2000 1950
80 2850 1950 1900
90 2800 1900 1800
100 2800 1850 1800
110 2800 1850 1805
120 2800 1850 1800
130 2800 1850 1800
140 2800 1850 1805
150 2800 1850 1800
160 2800 1850 1800
170 2800 1850 1805
180 2800 1850 1800
0 40 80 120 160 200
2000 4000 6000 8000 10000 12000 14000 16000
Signa
l
/
(count
s
s
-1 )
time / s
H2O + 2% HNO3 2% HNO3+ 2% NH4OH 2% HNO3+ 2% mannitol
Figure 1. Comparison of background values with various washing solutions.
0.0 0.5 1.0 1.5 2.0 2.5 3.0 3.5 -0.8
-0.4 0.0 0.4 0.8
D
e
v
ia
ti
o
n
10
B
/
1
1B
fr
o
m
N
IS
T
9
5
1
/
%
Csample/ Cstd
Figure 2. The effect of B concentration on B isotope ratio measurements under different mass bias correct modes (the standard content is 0.5 ppm).
0 40 80 120 160 200
2000 4000 6000 8000 10000 12000 14000 16000
Signa
l
/
(count
s
s
-1 )
time / s
H2O + 2% HNO3
2% HNO3+ 2% NH4OH
paleodietary proxy, but two important questions must irst be answered: (i) what is recorded in the 10B/11B of teeth? (e.g., diet, trophic level, inluence of the local vegetation or geology); and (ii) do the original 10B/11B values of teeth remain unaltered by the fossilization processes? In order to answer these two questions, the 10B/11B of teeth has been compared with other stable isotope proxies used in ecology, analyzed on the same specimens, to determine the inluence of diet (δ13C),42,43 water sources (δ18O),42,43 trophic levels (δ15N, δ44/42Ca),44-46 as well as with geological and vegetation maps (87Sr/86Sr),36,47,48 should be investigated the inluence of the local bedrock and plant matter contributions, respectively.
The Sr isotope composition (i.e., 87Sr/86Sr ratio) of the healthy teeth and carious teeth at the same region in Shaanxi (NW of China) was measured by Li et al.36 Their results demonstrate that 87Sr/86Sr does not appear to be affected by the caries formation, age or sex. The 87Sr/86Sr ratio in the enamel of the healthy and carious teeth of individuals of varying ages and genders ranged between 0.710935 and 0.711037, which falls into the range of the 87Sr/86Sr found in the local, naturally occurring water,
soils and rocks.
Conclusions
We present here a method to measure 10B/11B ratios in tooth enamel by ICP-MS after pre-treatment by ion exchange separation. The 10B/11B ratio in the enamel of the healthy teeth and carious teeth luctuated over a broad range, ranged from 0.2007 to 0.2574. It is anticipated that this technique offers the potential for using B isotope ratios to trace the geochemical cycling of B in scientiic archaeology, forensic identiication, paleoecology, and other disciplines.
Acknowledgements
This work was supported by the National Natural Science Foundation of China (41103008, U1407109) and by “Key Program” of the West Light Foundation of Chinese Academy of Sciences (42904101).
Table 6. The 10B/11B ratios in tooth enamel by sex and age
Tooth enamel by sex and age 7-11 years 12-19 years 20-39 years 40-59 years 60-79 years
Healthy teeth (male) 0.2437 0.2149 0.2297 0.2511 0.2574
Healthy teeth (female) 0.2019 0.2517 0.2557 0.2439 0.2322
Carious teeth (male) 0.2539 0.2195 0.2148 0.2222 0.2007
Carious teeth (female) 0.2459 0.2548 0.2394 0.2189 0.2346
0 50 100 150 200 0.00
0.02 0.04 0.06 0.08 0.10 0.12 0.14 0.16 0.18
time / days
D
e
v
ia
ti
o
n
10
B
/
1
1B
fr
o
m
N
IS
T
9
5
1
/
%
Figure 3. Repeatability of 10B/11B isotope ratios measurements of NIST
SRM 951.
Healthy teeth
(male)
Healthy teeth
(female)
Carious teeth
(male)
Carious teeth
(female)
0.20 0.21 0.22 0.23 0.24 0.25 0.26
7-11 years 12-19 years 20-39 years 40-59 years 60-79 years
10
B/
1
1B
is
o
to
p
ic
ratio
s
Figure 4. 10B/11B isotope ratios in the tooth samples (each group has
one sample).
The data in Figure 4 indicate that the 10B/11B ratio in the enamel of the healthy teeth and carious teeth by sex and age luctuated over a broad range, ranged from 0.2007 to 0.2574. Boron has two naturally occurring isotopes, 10B (19.9%) and 11B (80.1%). A relatively large mass difference (10%) between the two isotopes and high volatility results in signiicant boron isotopic variation from –70‰ to +75‰ in natural materials; thus, boron isotopes have numerous applications in geochemistry, isotope hydrology, oceanography, environmental sciences, cosmology, and nuclear technology.13 The 10B/11B ratio in the enamel of the teeth could potentially be a new
Healthy teeth (male) Healthy teeth
(female) Carious teeth
(male) Carious teeth
(female)
0.20 0.21 0.22 0.23 0.24 0.25 0.26
7-11 years 12-19 years 20-39 years 40-59 years 60-79 years
10
B/
1
1B
is
o
to
p
ic
ratio
References
1. Fischer, J.; Schneider, J. W.; Hodnett, J. P. M.; Elliott, D. K.; Johnson, G. D.; Voigt, S.; Joachimski, M. M.; Tichomirowa, M.; Götze, J.; Historical Biology2014, 26, 710.
2. Hedges, R. E. M.; Stevens, R. E.; Koch, P. L. In Isotopes in Palaeoenvironmental Research; Leng, M. J., ed.; Springer: Berlin, 2006, pp 117-138.
3. Fischer, J.; Schneider, J. W.; Voigt, S.; Joachimski, M. M.; Tichomirowa, M.; Tütken, T.; Götze, J.; Berner, U.; Chem. Geol. 2013, 342, 44.
4. Riyat, M.; Sharma, D. C.; Biol. Trace Elem. Res.2009, 129, 126.
5. Tasli, P. N.; Dogan, A.; Demirci, S.; Sahin, F.; Biol. Trace Elem. Res. 2013, 153, 419.
6. Clementz, M. T.; J. Mammal.2012, 93, 368.
7. Hannaford, P.; Lowe, R. M.; Anal. Chem. 1977, 49, 1852. 8. Wiltschea, H.; Prattesb, K.; Zischkaa, M.; Knappa, G.;
Spectrochim. Acta, Part B2009, 64, 341.
9. Thangavel, S.; Rao, S. V.; Dash, K.; Arunachalam, J.;
Spectrochim. Acta, Part B2006, 61, 314.
10. Rao, R. M.; Parab, A. R.; Bhushan, K. S.; Aggarwal, S. K.;
Analytical Methods2011, 3, 322.
11. Ishikawa, T.; Nagaishi, K.; J. Anal. At. Spectrom.2011, 26, 359. 12. Rao, R. M.; Parab, A. R.; Aggarwal, S. K.; Analytical Methods
2012, 4, 3593.
13. He, M. Y.; Xiao, Y. K.; Jin, Z. D.; Ma, Y. Q.; Xiao, J.; Zhang, Y. L.; Luo, C. G.; Zhang, F.; Anal. Chem.2013, 85, 6248. 14. He, M. Y.; Xiao, Y. K.; Jin, Z. D.; Liu, W. G.; Ma, Y. Q.; Zhang,
Y. L.; Luo, C. G.; Chem. Geol. 2013, 337-338, 67.
15. Louvat, P.; Bouchez, J.; Paris, G.; Geostand. Geoanal. Res.
2011, 35, 75.
16. Guerrot, C.; Millot, R.; Robert, M.; Négrel, P.; Geostand. Geoanal. Res.2011, 35, 275.
17. Ni, Y. Y.; Foster, G. L.; Elliott, T.; Chem. Geol. 2010, 274, 18. 18. Wang, B. S.; You, C. F.; Huang, K. F.; Wu, S. F.; Aggarwal,
S. K.; Chung, C. H.; Talanta 2010, 82, 1378.
19. Rollion-Bard, C.; Blamart, D.; Trebosc, J.; Tricot, G.; Mussi, A.; Cuif, J.; Geochim. Cosmochim. Acta2011, 75, 1003. 20. Manoravi, P.; Joseph, M.; Sivakumar, N.; Balasubramanian, R.;
Anal. Sci. 2005, 21, 1453.
21. Manoravi, P.; Joseph, M.; Sivakumar, N.; Int. J. Mass Spectrom.
2008, 276, 9.
22. Hou, K. J.; Li, Y. H.; Xiao, Y. K.; Liu, F.; Tian, Y. R.; Chin. Sci. Bull. 2010, 55, 3305.
23. Lukaszew, R. A.; Marrero, J. G.; Cretella, R. F.; Noutary, C. J.;
Analyst1990, 115, 915.
24. Gregoire, D. C.; Anal. Chem. 1987, 59, 2479.
25. Smith, F. C.; Wiederin, D. R.; Houk, R. S.; Anal. Chim. Acta
1991, 248, 229.
26. Sun, D. H.; Ma, R. L.; McLeod, C. W.; Wang, X. R.; Cox, A. G.;
J. Anal. At. Spectrom. 2000, 15, 257.
27. Al-Ammar, A. S.; Gupta, R. K.; Barnes, R. M.; Spectrochim. Acta, Part B2000, 55, 629.
28. Vanderpool, R. A.; Hoff, D.; Johnson, P. E.; Environ. Health Perspect.1994, 102, 13.
29. Al-Ammar, A.; Reitznerová, E.; Barnes, R. M.; Spectrochim. Acta, Part B 2000, 55, 1861.
30. Bellato, A. C. S.; Menegário, A. A.; Giné, M. F.; J. Braz. Chem. Soc.2003, 14, 269.
31. Coetzee, P. P.; Vanhaecke, F.; Anal. Bioanal. Chem.2005, 383, 977.
32. Forcada, E. G.; Evangelista, I. M.; Hydrogeol. J.2008, 16, 547. 33. Coetzee, P. P.; Greeff, L.; Vanhaecke, F.; S. Afr. J. Enol. Vitic.
2011, 32, 28.
34. Takasaki, I.; Nagumo, T.; Inaba, T.; Yoshino, N.; Maruyama, T.;
J. Nucl. Sci. Technol.2011, 49, 867.
35. Sakata, M.; Ishikawa, T.; Mitsunobu, S.; Atmos. Environ. 2013,
67, 296.
36. Li, Z. X.; He, M. Y.; Peng, B.; Jin, Z. D.; Rapid Commun. Mass Spectrom.2013, 27, 1919.
37. He, M. Y.; Lu, H.; Jin, Z. D.; Wang, J.; Chin. J. Anal. Chem.
2012, 40, 1109.
38. Amr, M. A.; Int. J. Phys. Sci. 2012, 6, 6241.
39. Kohn, M. J.; Morris, J.; Olin, P.; J. Archaeol. Sci. 2013, 40, 1689.
40. Kumagai, A.; Fujita, Y.; Endo, S.; Itai, K.; Forensic Sci. Int.
2012, 219, 29.
41. Dolphin, A. E.; Naftel, S. J.; Nelson, A. J.; Martin, R. R.;
J. Archaeol. Sci. 2013, 40, 1778.
42. Loftus, E.; Sealy, J.; Am. J. Phys. Anthropol. 2012, 147, 499. 43. Forbesa, M. S.; Kohnb, M. J.; Bestlanda, E. A.; Wellsc, R. T.;
Palaeogeogr., Palaeoclimatol., Palaeoecol.2010, 291, 319. 44. Richards, M. P.; Mays, S.; Fuller, B. T.; Am. J. Phys. Anthropol.
2002, 119, 205.
45. Reynarda, L. M.; Hendersonb, G. M.; Hedgesa, R. E. M.;
J. Archaeol. Sci. 2011,38, 657.
46. Heusera, A.; Tütkena, T.; Gussoneb, N.; Galerc, S. J. G.;
Geochim. Cosmochim. Acta2011, 75, 3419.
47. Brntley, R. A.; Price, T. D.; Stephan, E.; J. Archaeol. Sci. 2004,
31, 365.
48. Hu, Z. W.; Huang, S. J.; Liu, L. H.; Tong, H. P.; He, Y. X.; Acta Geosci. Sin. 2010, 31, 853.