ORIGINAL ARTICLE
SUMMARY
Objective: To evaluate the inluence of body composition on bone mass in children and adolescents. Methods: A cross-sectional study with 267 healthy students of both sexes (141 males and 126 females) aged 8 to 18 years. Weight, height, body mass index, lean mass, fat mass, fat mass index, body fat percentage, waist and hip circumferences, and waist-to-hip ratio were evaluated. Bone mass was assessed using ultrasound of hand pha-langes (DBM Sonic BP – IGEA, Carpi, Italy). Results: Females showed greater bone mass in relation to males with advances in age and pubertal stage. In both sexes, the bone mass showed signiicant and positive correlations with age, weight, height, body mass index, lean mass, waist and hip circumferences; and negative correlations with waist-to-hip ratio. In females, there was also a positive correlation with fat mass, fat mass index, and body fat percentage. Age and lean mass were predictors for bone mass in males, and age, pubertal stage and fat mass index were predictors in females.
Conclusion: he correlation between bone mass and body composition occurred in both sexes, with lean mass and fat mass index being the predictor of bone mass in males and females, respectively.
Keywords: Ultrasonography; bone density; inger phalanges; obesity; school health. Study conducted at the Laboratory
of Growth and Body Composition, Centro de Investigação em Pediatria (CIPED), Department of Pediatrics, Faculdade de Ciências Médicas, Universidade Estadual de Campinas (FCM-UNICAMP), Campinas, São Paulo, SP, Brazil
Submitted on: 04/27/2011
Approved on: 09/06/2011
Financial Support:
Capes (Doctoral grants to WRGC and EMG)
Correspondence to:
Gil Guerra-Júnior Cidade Universitária
“Zeferino Vaz” CEP: 13083-970 Campinas, SP, Brazil Phone: +55 (19) 3521-7322
Conlict of interest: None.
©2011 Elsevier Editora Ltda. All rights reserved.
Influence of body composition on bone mass in children and
adolescents
WELLINGTON ROBERTO GOMESDE CARVALHO1, EZEQUIEL MOREIRA GONÇALVES2, ROBERTO REGIS RIBEIRO3, EDSON SANTOS FARIAS4, SARA SILVEIRA PENIDODE CARVALHO5, GIL GUERRA-JÚNIOR6
1 PhD in Child and Adolescent Health; Professor, Instituto Federal de Educação, Ciência e Tecnologia do Sul de Minas Gerais (IFSULDEMINAS), Centro de Ciências Aplicadas à
Educação e Saúde (CeCAES), Campus Muzambinho, Muzambinho, MG, Brazil
2 MSc in Child and Adolescent Health; PhD Student, Postgraduate Program in Child and Adolescent Health, Faculdade de Ciências Médicas, Universidade Estadual de Campinas
(FCM-UNICAMP), Campinas, SP, Brazil
3 PhD in Child and Adolescent Health; Professor, Department of Physical Education, Faculdade Assis Gurgacz, Cascavel, PR, Brazil
4 PhD in Child and Adolescent Health; Professor, Centro de Ciências da Saúde e do Desporto (CCSD), Universidade Federal do Acre (UFAC), Rio Branco, AC, Brazil 5 Physical Education Professional; Universidade Vale do Rio Verde (UNINCOR), Três Corações, MG, Brazil
INTRODUCTION
he assessment of body composition in children and adolescents is of great importance, as it expresses the life and health status of the population and its inluence on the morbimortality risks. he incidence of obesity has been increasing steadily around the world and can be currently considered a major public health problem1. Childhood has been identiied as a critical period for the development of obesity2,3.
In contrast to such consequences, studies have suggest-ed that obesity seems to be a protective factor against risk of fractures and osteoporosis4, given that obese individu-als have greater bone mass compared with normal weight individuals5. In theory, the greater bone mass in obese in-dividuals may be a consequence of increased body weight.
he actual contribution of fat mass to bone mass re-mains controversial. Arabi et al.6 carried out a cross-sec-tional study conducted with 363 school children aged 10 to 17 years and observed that the lean and fat masses were predictors of bone mass in boys and girls.
It was observed that bone mass assessment in children and adolescents is important not only for the development of intervention programs, but mainly because the accu-mulation of bone mass during the growth phase plays an important factor in preventing osteoporosis in the adult phase7. Studies leading to a better understanding of this question are of great interest for the scientiic community, especially considering that the contribution of body com-position to bone mass is not yet fully understood.
Hence, the purpose of this study was to evaluate the inluence of body composition on bone mass in children and adolescents.
METHODS
his is cross-sectional study carried out with school children of both sexes, aged 8 to 18 years, enrolled in a public school in the city of Francisco Morato, located in the north-north-east region of the state of São Paulo, Brazil. he study was approved by the Ethics Committee of Faculdade de Ciências Médicas of Universidade Estadual de Campinas (protocol # 504/2009) and informed written consent was given by the school direction and by the students’ parents and/or tutors.
All students enrolled in the school in the year 2009 were included. Exclusion criteria were the presence of physical disability (permanent or temporary) that would prevent assessments, use of drugs that could interfere with body composition or bone mass, non-compliance by par-ents or studpar-ents, or non-attendance at the evaluation. he sample consisted of 267 students (males = 141 or 52.8% and females = 126 or 47.2%).
he chronological ages were established by calculating decimal age, having as reference the date of birth and of data collection, adopting decimal intervals between 0.50 to 0.49
according to Eveleth and Tanner8, i.e., for a child to be in-cluded in the age group of eight years, he or she would have to be a centesimal age of 7.50 to 8.49 years at the time of data collection. Based on this data, all students were divided into groups of 8 to 10 years, 11 to 13 years, 14 to 16 years and 17 to 18 years.
he economic proile was veriied according to criteria suggested by the Brazilian Association of Research Compa-nies9, and all students belonged to socioeconomic classes C (28.5%), D (58.8%) or E (12.7%).
All measurements were performed according to stan-dard techniques10. Weight was measured (in kilograms) us-ing a portable digital scale with a 0.1 kg precision. Height was measured (in centimeters) using a vertical stadiometer with a 0.1 cm precision. Based on these measurements, body mass index (BMI) was obtained by dividing weight (in kilograms) by height (in meters) squared.
he skinfold thickness in the tricipital (TRI) and sub-scapularis (SBS) regions were measured on the right side of the body, by a single previously trained experienced ex-aminer, using an adipometer (Holtain Tanner-Whitehouse Skinfold Caliper, UK) with a 0.2 mm precision. Based on the sum of skinfold thickness of the TRI and SBS regions, we used the equations of Slaughter et al.11 to calculate the percentage of body fat (%BF). Based on these data, the fat mass (FM) was obtained by multiplying the %BF content by weight and the fat mass index (FMI) was obtained by dividing the FM by the height squared. he lean mass (LM) was obtained by subtracting the weight by the fat mass.
Waist circumference (WC) was measured using a metal-lic measuring tape with a precision of 0.1 cm, by measuring around the waist at the narrowest part of the trunk, between the last rib and the iliac crest, with the subjects in the stand-ing position ater a normal expiration. Hip circumference (HC) was measured with subjects in the standing position, using a metallic measuring tape with a precision of 0.1 cm, by measuring around the maximum posterior extension of the buttocks. he waist-to-hip ratio (WHR) was then cal-culated using these measures, by dividing the WC by HC.
he AD-SoS is obtained automatically and represents 96 ac-quisitions of ultrasound velocity measurements (m/s), rang-ing from 1650 to 2250 m/s. he AD-SoS assesses the speed of ultrasound (m/s), which, by transmission, scans the tra-beculae of bone tissue in the four proximal phalanges12.
he stage of sexual maturation was evaluated by self-assessment13, with the help of boards with speciic pictures for each sex according to the stage of breast development (M1-5) for girls14 and genitals (G1-5) for boys15, classiied as prepubertal (stage I), intrapubertal (stages II and III) and pubertal (stages IV and V). Menarche was assessed by ask-ing the girls whether it had occurred and when. All the girls that had had menarche were included in the pubertal group (stage IV or V).
Data storage and statistical analysis were performed using the SPSS (Statistical Package for Social Sciences, Inc., Chicago, IL, USA) sotware, release 16.0. he data were processed using descriptive procedures, and mean, median, standard deviation, minimum and maximum val-ues were calculated. Data distribution was veriied regard-ing normality usregard-ing the Kolmogorov-Smirnov test. For variables with normal distribution, data were presented as mean and standard deviation, and for variables with non-normal distribution, as median, minimum and maximum values. he Mann-Whitney test was used to compare dif-ferences between the sexes. Spearman’s correlation test was used to verify the correlations between bone measurement data and anthropometric variables and body composition. Step-by-step multivariate linear regression analysis was used to determine the possible efects of each independent variable (age, weight, height, BMI, LM, FM, FMI, %BF, WC, HC, WHR and pubertal stage) on the dependent one (AD-SoS). he results were considered statistically signii-cant at p < 0.05.
RESULTS
he results of body composition by age, sex and pubertal stage are shown in Table 1 and the bone mass results (in AD-SoS) in Table 2.
It was observed that 57 (45.2%) girls had had menarche, with age ranging from 9.9 to 14.6 years (12.2 ± 1.1 years).
Spearman’s linear correlation coeicients demonstrat-ed that in both sexes, AD-SoS showdemonstrat-ed signiicant positive correlations with age, weight, height, BMI, LM, WC, HC and a signiicant negative correlation with WHR. Only in girls, the AD-SoS showed signiicant positive correlations with FM, FMI and %BF (Table 3).
he step-by-step multivariate linear regression analysis showed that the most important variables as independent predictors of AD-SoS were age and lean mass, with a co-eicient of determination (R2) of 0.348 in boys and age, pubertal stage and FMI with a coeicient of determination (R2) of 0.588 in girls (Table 3).
DISCUSSION
he present study observed, with age increase, higher val-ues of weight, height, LM, WC and WHR for boys in tion to girls and FM, FMI, %BF and HC for girls in rela-tion to boys. In general, these were consistent with other studies and these gender diferences can be explained by sexual dimorphism. he diferences between the sexes oc-cur in response to genetic determinants, hormonal and environmental inluences, acting since the prenatal pe-riod and showing variability in their progression at the time of puberty16.
Gültekin et al.17, in a cross-sectional study that evalu-ated 332 boys and 269 girls from Turkey aged 8 to 11 years, showed clear evidence of sexual dimorphism in the body fat pattern; girls showed greater body fat content. In the present study, the anthropometric and body composition variables followed an expected result according to pubertal stage progression. Higher LM value in boys was observed in the pre-pubertal group, when compared with girls. A higher WHR was observed in boys in the intrapubertal group when compared to girls, but the latter had higher values of FM, FMI, %BF and HC in relation to boys.
Boys in the pubertal group had higher height and LM values when compared to girls, but the latter had higher BMI, FM, FMI, %BF and HC values in relation to boys.
hese results can be explained by the natural process of pubertal development, as the growth spurt occurs dur-ing puberty, as well as changes in body composition. Dur-ing the growth and development of children, the content, proportion and distribution of body fat may change with age, especially in the pre- and post-adolescence phase, when girls continue to present an increase in fat mass18.
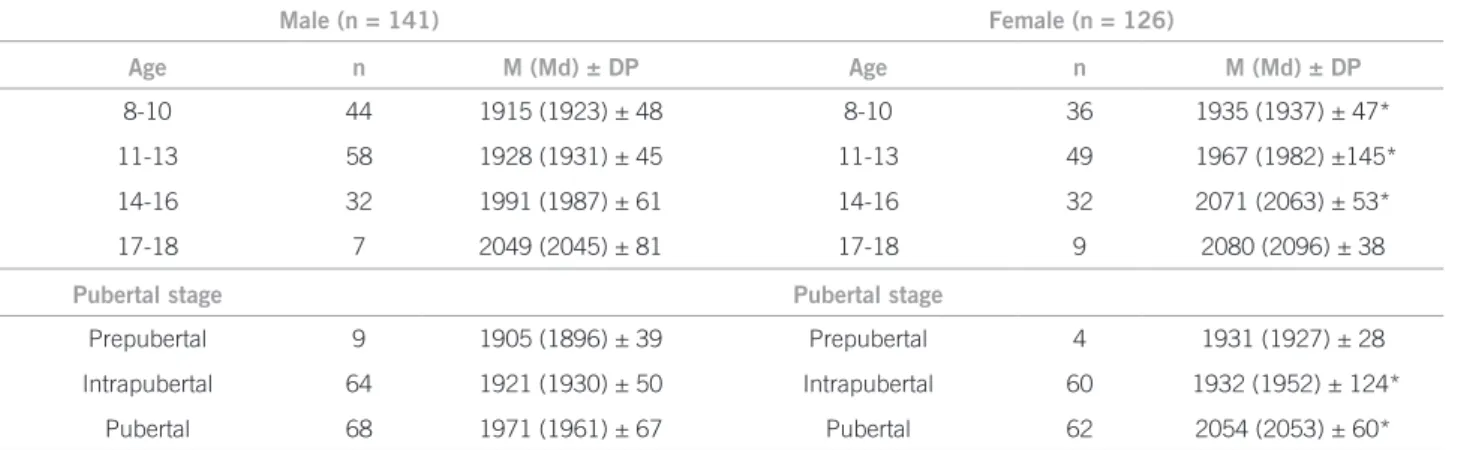
In the present study, the bone mass showed the ex-pected increase for age and pubertal stage. It was ob-served that girls in general and those at the intrapubertal and pubertal stages had greater bone mass than boys, cor-roborating data from cross-sectional19,20 and longitudinal studies21-23.
Adolescence is a critical period for bone mineraliza-tion and bone mass acquisimineraliza-tion during the pubertal phase has a strong association with Tanner stages24. Studies have shown that bone mass is greater in girls when compared with boys until late adolescence25, but these diferences may disappear with growth velocity and pubertal de-velopment26. In this study, the diferences between boys and girls persisted both in the intrapubertal and pubertal groups.
Our indings demonstrated that in both sexes, AD-SoS showed signiicant positive correlations with age, weight, height, BMI, LM, WC, HC and a signiicant negative cor-relation with WHR, but only in girls the AD-SoS showed signiicant positive correlations with FM, FMI and %BF.
he AD-SoS was associated with the anthropomet-ric and body composition variables. Considering that, it might be possible to conirm that the AD-SoS can provide accurate information on bone mass accumulation and microarchitectural alterations with the growth process, as suggested by some studies28.
Based on the literature, it can be observed that there is inconsistency in the results of studies investigating the inluence of body fat on bone mass among diferent populations. Wosje et al.29, in order to verify the associa-tion between fat mass and bone mass gain, and the role of physical activity, assessed 214 children aged 3.5 to 7 years and demonstrated that fat mass was associated with bone mass and time spent watching TV was associated with lower gains in bone mass. Lippo et al.30, in a case-control study, showed that female adolescents are at greater risk for physical inactivity, and spend more time watching TV.
Male (n = 141) Female (n = 126)
Variables
Age Age
8-10 (n = 44)
11-13 (n = 58)
14-16 (n = 32)
17-18 (n = 7)
8-10 (n = 36)
11-13 (n = 49)
14-16 (n = 32)
17-18 (n = 9)
Weight (kg) 31.7 ± 7.3 42.3 ± 10.4 57.1 ± 13.3 66.8 ± 14.9* 32.0 ± 7.0 43.7 ± 9.3 55.0 ± 10.2 55.3 ± 4.7 Height (cm) 133.0 ± 6.7 149.3 ± 9.2 166.7 ± 10.2* 169.2 ± 3.6* 134.0 ± 6.5 148.9 ± 8.2 159.2 ± 6.0 159.6 ± 3.8
BMI (kg/m2) 16.6
(14.4-27.4) 18.3 (14.4-28.6) 19.4 (15.8-28.4) 20.8 (20.4-32.9) 17.0 (13-24.2) 19.1 (14.8-25.5) 21.4 (15.2-30.3) 22.0 (18.0-25.9)
FM (kg) 3.4 (1.5-19.6) 4.4 (1.6-27.1) 5.2 (1.8-29.6) 11.4 (4.7-45.0) 5.3* (2.1-17.0) 8.3* (3.5-20.6) 12.4* (1.1-32.0) 12.7 (9.8-22.3) LM (kg) 26.8 ± 3.8 35.9 ± 7.1 50.0 ± 9.4* 53.7 ± 4.1* 25.9 ± 4.3 34.2 ± 5.4 41.3 ± 5.5 41.8 ± 2.1
FMI (kg/m2) 1.9
(1.0-1.9) 2.0 (0.9-11.4) 1.8 (0.7-9.6) 2.4 (1.7-15.2) 3.0* (1.3-7.8) 3.6* (1.8-8.2) 4.8* (0.4-12.4) 5.2* (3.6-9.4)
% BF 11.3 (6.0-36.0) 11.9 (5.9-39.5) 9.3 (4.2-33.9) 11.4 (8.6-46.1) 18.0* (9.3-32.4) 18.9* (12.2-33.7) 22.8* (15.0-40.9) 24.1* (5.0-19.9) WC (cm) 57.9 ± 5.9 62.2 ± 6.5 68.3 ± 9.0 73.5 ± 9.5* 57.3 ± 6.6 60.9 ± 5.4 65.7 ± 6.0 65.2 ± 3.7 HC (cm) 68.7 ± 8.2 75.5 ± 8.6 83.7 ± 7.7 92.1 ± 11.5 70.8 ± 7.3 80.0 ± 9.0* 89.7 ± 7.5* 91.0 ± 4.3 WHR (cm) 0.85 ± 0.04* 0.83 ± 0.04* 0.80 ± 0.03* 0.80 ± 0.02* 0.81 ± 0.04 0.76 ± 0.04 0.73 ± 0.03 0.72 ± 0.02 Table 1 – Mean (M), median (Md) and standard deviation (SD) values, age (years), anthropometric variables and body composition, regarding sex and pubertal stage, Francisco Morato (SP), Brazil, 2009
Male (n = 141) Female (n = 126)
Variables
Age Age
Prepubertal 9.1 ± 1.1
(n = 9)
Intrapubertal 10.4 ± 1.5
(n = 64)
Pubertal 14.0 ± 1.8
(n = 68)
Prepubertal 9.3 ± 1.5
(n = 9)
Intrapubertal 10.4 ± 1.4
(n = 64)
Pubertal 14.4 ± 1.8
(n = 68)
Weight (kg) 30.8 ± 5.1 34.0 ± 7.9 54.6 ± 13.4 27.2 ± 3.7 35.8 ± 8.1 53.4 ± 9.0 Height (cm) 132.3 ± 5.9 137.8 ± 8.3 162.4 ± 10.6* 129.4 ± 1.3 139.9 ± 9.6 157.1 ± 6.2
BMI (kg/m2) 17.4
(13.9-26.1) 16.6 (13.9-27.5) 19.3 (16.6-28.3) 15.5 (13.4-21.1) 17.2 (13.3-23.7) 21.3* (14.7-28.7)
FM (kg) 4.2
(1.4-17.3) 3.5 (1.3-30.1) 5.2 (3.0-37.9) 4.3 (2.0-9.3) 5.7* (1.9-17.9) 12.5* (4.9-26.5) LM (kg) 26.0 ± 3.0* 28.9 ± 4.7 46.4 ± 9.2* 22.4 ± 1.3 28.8 ± 5.3 40.2 ± 4.9
FMI (kg/m2) 2.3
(1.4-4.9) 1.8 (0.9-9.9) 2.0 (0.7-15.2) 2.5 (1.5-4.9) 3.0* (1.3-8.1) 5.0* (0.4-12.4) %BF 12.9 (6.7-35.8) 11.2 (5.6-49.1) 10.3 (6.7-47.5) 16.2 (9.5-29.7) 17.5* (9.5-39.2) 23.4* (13.9-38.1) WC (cm) 57.5 ± 4.0 58.5 ± 5.9 67.6 ± 8.2 55.0 ± 4.5 58.2 ± 6.0 65.1 ± 5.6 HC (cm) 67.3 ± 7.4 69.8 ± 7.7 83.2 ± 8.8 65.3 ± 5.2 73.5 ± 7.9* 88.6 ± 7.1* WHR (cm) 0.86 ± 0.05 0.84 ± 0.04* 0.81 ± 0.03* 0.84 ± 0.03 0.79 ± 0.05 0.74 ± 0.03
In view of that, physical inactivity may contribute to in-creased adiposity.
he present study demonstrated, in this group of stu-dents, that age and lean mass were independent predictors of AD-SoS for boys, and age, pubertal stage and FMI were independent predictors of AD-SoS for girls. his ind-ing demonstrates that the independent variables age and lean mass can explain 34.8% of the variability in AD-SoS in boys, and that age, pubertal stage and FMI can explain 58.8% of the variability in AD-SoS in girls.
Some limiting factors can be mentioned in this study,
such as not comparing ultrasound data with other meth-ods such as DXA, not assessing the intake of speciic nutri-ents for the acquisition of bone mass such as calcium and vitamin D and not assessing the level of physical activity.
Although the physiological basis for explaining the as-sociation between weight, body fat distribution and bone mass remains uncertain, particularly when considering diferent population groups, the data from this study open perspectives to the inluence of peri- and intrapubertal body composition, as we clearly observe more LM in the male sex and more FM in the female sex.
Male (n = 141) Female (n = 126)
Age n M (Md) ± DP Age n M (Md) ± DP
8-10 44 1915 (1923) ± 48 8-10 36 1935 (1937) ± 47*
11-13 58 1928 (1931) ± 45 11-13 49 1967 (1982) ±145* 14-16 32 1991 (1987) ± 61 14-16 32 2071 (2063) ± 53*
17-18 7 2049 (2045) ± 81 17-18 9 2080 (2096) ± 38
Pubertal stage Pubertal stage
Prepubertal 9 1905 (1896) ± 39 Prepubertal 4 1931 (1927) ± 28 Intrapubertal 64 1921 (1930) ± 50 Intrapubertal 60 1932 (1952) ± 124*
Pubertal 68 1971 (1961) ± 67 Pubertal 62 2054 (2053) ± 60*
AD-SoS, amplitude-dependent speed of sound; *p < 0.05; Mann-Whitney non-parametric test.
Table 2 – Mean (M), median (Md), standard deviation (SD) and AD-SoS values according to age (years), pubertal stage and sex, Francisco Morato (SP), Brazil, 2009
Table 3 – Spearman’s coefficient of linear correlation of bone quantity (AD-SoS) according to sex, anthropometric variables and body composition, and multivariate linear regression analysis of AD-SoS in relation to sex, Francisco Morato (SP), Brazil, 2009
Variables
Male (n = 141) Female (n = 126)
AD-SoS AD-SoS
rs p rs p
Age (years) 0.53 0.001 0.77 0.001
Weight (kg) 0.45 0.001 0.60 0.001
Height (cm) 0.53 0.001 0.71 0.001
BMI (kg/m2) 0.23 0.007 0.34 0.001
FM (kg) 0.14 0.11 0.41 0.001
LM (kg) 0.51 0.001 0.68 0.001
IMG -0.05 0.52 0.24 0.006
%BF -0.15 0.07 0.23 0.01
WC (cm) 0.34 0.001 0.37 0.001
HC (cm) 0.41 0.001 0.57 0.001
WHR (cm) -0.39 0.001 -0.60 0.001
Sex Model R2 R2 adjusted p
Male AD-SoS = 1777.048 + (9.441 x age) + (1.450 x LM) 0.357 0.348 0.0001
Female AD-SoS = 1831.144 + (13.613 x age) +
(66.514 x pubertal stage) + (-7.306 x FMI) 0.598 0.588 0.0001
CONCLUSION
It was concluded in this study with children and adoles-cents that there was a correlation between bone mass and body composition, with LM being a predictor of bone mass in boys and FMI in girls.
ACKNOWLEDGEMENTS
he authors would like to thank the Coordenação de Aperfeiçoamento de Pessoal de Nível Superior (CAPES) for the doctoral grants (to WRGC and EMG), the school Principal, the students and their parents or tutors who col-laborated with the study.
REFERENCES
1. Orsi CM, Hale DE, Lynch JL. Pediatric obesity epidemiology. Curr Opin Endocrinol Diabetes Obes. 2011;18:14-22.
2. Kim S, Popkin BM. Commentary: Understanding the epidemiology of overweight and obesity - a real global public health concern. Int J Epidemiol. 2006;35:60-7.
3. Parisi SM, Goodman E. Obesity and cardiovascular disease risk in children and adolescents. Curr Cardiovasc Risk Rep. 2008;2:47-52. 4. Ducher G, Bass SL, Naughton GA, Eser P, Telford RD, Daly RM.
Overweight children have a greater proportion of fat mass relative to muscle mass in the upper limbs than in the lower limbs: impli-cations for bone strength at the distal forearm. Am J Clin Nutr. 2009;90:1104-11.
5. Wang MC, Bachrach LK, Van Loan M, Hudes M, Flegal KM, Craw-ford PB. he relative contributions of lean tissue mass and fat mass to bone density in young women. Bone. 2005;37:474-81.
6. Arabi A, Tamim H, Nabulsi M, Maalouf J, Khalifé H, Choucair M, et al. Sex diferences in the efect of body-composition variables on bone mass in healthy children and adolescents. Am J Clin Nutr. 2004;80:1428-35.
7. Mora S, Gilsanz V. Establishment of peak bone mass. Endocrinol Metab Clin North Am. 2003;32:39-63.
8. Eveleth PH, Tanner JM. Worldwide variation in human growth. Cambridge: Cambridge University Press; 1976.
9. Associação Brasileira de Empresas de Pesquisa (ABEP). Critério de classiicação econômica Brasil [cited 2009 Feb 20]. Available from: http://www.abep.org.
10. Lohman TG, Roche AF, Martorell R. Anthropometric standardiza-tion reference manual. Champaign: Human Kinetics; 1988. 11. Slaughter MH, Lohman TG, Boileau RA, Horswill CA, Stillman RJ,
Van Loan MD, et al. Skinfold equations for estimation of body fat-ness in children and youth. Hum Biol. 1988;60:709-23.
12. Halaba ZP, Pluskiewicz W. Quantitative ultrasound in the assess-ment of skeletal status in children and adolescents. Ultrasound Med Biol. 2004;30:239-43.
13. Duke PM, Litt IF, Gross RT. Adolescents’ self assessment of sexual maturation. Pediatrics. 1980;66:918-20.
14. Marshall WA, Tanner JM. Variations in the pattern of pubertal changes in girls. Arch Dis Child. 1969;44:291-303.
15. Marshall WA, Tanner JM. Variations in the pattern of pubertal changes in boys. Arch Dis Child. 1970;45:13-23.
16. Taylor RW, Grant AM, Williams SM, Goulding A. Sex diferences in regional body fat distribution from pre- to postpuberty. Obesity. 2010;18:1410-16.
17. Gültekin T, Akin G, Ozer BK. Gender diferences in fat patterning in children living in Ankara. Anthropol Anz. 2005;63:427-37. 18. Ma J, Feng N, Zhang SW, Pan YP, Huang YB. Comparison of changes
in body composition during puberty development of obese and nor-mal-weight children in China. Biomed Environ Sci. 2009;22:413-8. 19. Ribeiro RR, Guerra-Junior G, Barros-Filho. Bone mass in
school-children in Brazil: the efect of racial miscegenation, pubertal stage, and socioeconomic diferences. J Bone Miner Metab. 2009;27:494-501.
20. Kalkwarf HJ, Gilsanz V, Lappe JM, Oberield S, Shepherd JA, Han-gartner TN, et al. Tracking of bone mass and density during child-hood and adolescence. J Clin Endocrinol Metab. 2010;95:1690-8. 21. Lappe JM, Stegman MR, Davies KM, Barber S, Becker RR. A
pro-spective study of quantitative ultrasound in children and adoles-cents, J Clin Densitom. 2000;2:167-75.
22. Vignolo M, Parodi A, Mascagni A, Torrisi C, De Terlizzi F, Aicardi G. Longitudinal assessment of bone quality by quantitative ultra-sonography in children and adolescents. Ultrasound Med Biol. 2006;32:1003-10.
23. Halaba ZP. Quantitative ultrasound measurements at hand phalan-ges in children and adolescents: a longitudinal study. Ultrasound Med Biol. 2008;34:1547-53.
24. Dib L, Arabi A, Maalouf J, Nabulsi M, El-Hajj Fuleihan G. Impact of anthropometric, lifestyle, and body composition variables on ultra-sound measurements in school children. Bone. 2005;36:736-42. 25. Jones G, Dwyer T. Bone mass in prepubertal children: gender
difer-ences and the role of physical activity and sunlight exposure. J Clin Endocrinol Metab. 1998;83:4274-9.
26. Baxter-Jones AD, Mirwald RL, McKay HA, Bailey DA. A longitu-dinal analysis of sex diferences in bone mineral accrual in healthy 8-19-year-old boys and girls. Ann Hum Biol. 2003;30:160-75. 27. Rocher E, Chappard C, Jafre C, Benhamou CL, Courteix D. Bone
mineral density in prepubertal obese and control children: rela-tion to body weight, lean mass, and fat mass. J Bone Miner Metab. 2008;26:73-8.
28. Fricke O, Tutlewski B, Schwahn B, Schoenau E. Speed of sound: Re-lation to geometric characteristics of bone in children, adolescents, and adults. J Pediatr. 2005;146:764-8.
29. Wosje KS, Khoury PR, Claytor RP, Copeland KA, Kalkwarf HJ, Dan-iels SR. Adiposity and TV viewing are related to less bone accrual in young children. J Pediatr. 2009;154:79-85.