ACPD
12, 2303–2353, 2012Sulfur isotope fractionation during
heterogeneous oxidation of SO2
E. Harris et al.
Title Page
Abstract Introduction
Conclusions References
Tables Figures
◭ ◮
◭ ◮
Back Close
Full Screen / Esc
Printer-friendly Version
Interactive Discussion
Discussion
P
a
per
|
Dis
cussion
P
a
per
|
Discussion
P
a
per
|
Discussio
n
P
a
per
|
Atmos. Chem. Phys. Discuss., 12, 2303–2353, 2012 www.atmos-chem-phys-discuss.net/12/2303/2012/ doi:10.5194/acpd-12-2303-2012
© Author(s) 2012. CC Attribution 3.0 License.
Atmospheric Chemistry and Physics Discussions
This discussion paper is/has been under review for the journal Atmospheric Chemistry and Physics (ACP). Please refer to the corresponding final paper in ACP if available.
Sulfur isotope fractionation during
heterogeneous oxidation of SO
2
on
mineral dust
E. Harris1, B. Sinha1,2, S. Foley3, J. N. Crowley4, S. Borrmann1, and P. Hoppe1
1
Abteilung Partikelchemie, Max-Planck-Institut f ¨ur Chemie, Hahn-Meitner-Weg 1, 55128 Mainz, Germany
2
Department of Earth Sciences, Indian Institute for Science Education and Research IISER Mohali, Sector 81, SAS Nagar, Manauli PO 140306, India
3
Earth System Science Research Centre, Institute for Geosciences, University of Mainz, Becherweg 21, 55128 Mainz, Germany
4
Abteilung Luftchemie, Max-Planck-Institut f ¨ur Chemie, Hahn-Meitner-Weg 1, 55128 Mainz, Germany
Received: 9 January 2012 – Accepted: 11 January 2012 – Published: 25 January 2012 Correspondence to: B. Sinha (baerbel.sinha@mpic.de)
ACPD
12, 2303–2353, 2012Sulfur isotope fractionation during
heterogeneous oxidation of SO2
E. Harris et al.
Title Page
Abstract Introduction
Conclusions References
Tables Figures
◭ ◮
◭ ◮
Back Close
Full Screen / Esc
Printer-friendly Version
Interactive Discussion
Discussion
P
a
per
|
Dis
cussion
P
a
per
|
Discussion
P
a
per
|
Discussio
n
P
a
per
|
Abstract
Mineral dust is a major fraction of global atmospheric aerosol, and the oxidation of SO2on mineral dust has implications for cloud formation, climate and the sulfur cycle. Stable sulfur isotopes can be used to understand the different oxidation processes oc-curring on mineral dust. This study presents measurements of the34S/32S fractionation
5
factorα34 for oxidation of SO2 on mineral dust surfaces and in the aqueous phase in mineral dust leachate. Sahara dust, which accounts for∼60 % of global dust emissions and loading, was used for the experiments.
The fractionation factor for aqueous oxidation in dust leachate isαleachate=0.9917± 0.0046, which is in agreement with previous measurements of aqueous SO2oxidation
10
by iron solutions. This fractionation factor is representative of a radical chain reaction oxidation pathway initiated by transition metal ions. Oxidation on the dust surface at subsaturated relative humidity (RH) had an overall fractionation factor ofαhet=1.0096± 0.0036 and was found to be almost an order of magnitude faster when the dust was simultaneously exposed to ozone, light and RH of∼40 %. However, the presence of
15
ozone, light and humidity did not influence isotope fractionation during oxidation on dust surfaces at subsaturated relative humidity.
A positive matrix factorization model was used to investigate surface oxidation on the different components of dust. Ilmenite, rutile and iron oxide were found to be the most reactive components, accounting for 85 % of sulfate production with a fractionation
20
factor ofα34=1.012±0.010. This overlaps within the analytical uncertainty with the fractionation of other major atmospheric oxidation pathways such as the oxidation of SO2 by H2O2 and O3 in the aqueous phase and OH in the gas phase. Clay minerals accounted for roughly 12 % of the sulfate production, and oxidation on clay minerals resulted in a very distinct fractionation factor ofα34=1.085±0.013. The fractionation
25
ACPD
12, 2303–2353, 2012Sulfur isotope fractionation during
heterogeneous oxidation of SO2
E. Harris et al.
Title Page
Abstract Introduction
Conclusions References
Tables Figures
◭ ◮
◭ ◮
Back Close
Full Screen / Esc
Printer-friendly Version
Interactive Discussion
Discussion
P
a
per
|
Dis
cussion
P
a
per
|
Discussion
P
a
per
|
Discussio
n
P
a
per
|
1 Introduction
Mineral dust represents the dominant mass fraction of atmospheric particulate mat-ter, and it is responsible for a large amount of the uncertainty associated with aerosol climate forcing effects. Dust is important for heterogeneous chemistry, human health, visibility, ocean nutrification, and cloud formation. Mineral dust emissions are estimated
5
to be between 1000 and 2150 Tg yr−1, resulting in a global dust load of 8 to 36 Tg (Zen-der et al., 2004; Tanaka and Chiba, 2006). Dust emissions are expected to increase due to erosion, mining and industrial activities, overgrazing and shifting precipitation patterns (Dentener et al., 1996). Mineral dust properties are altered during transport, as finer clays are transported far from source regions relative to coarse particles, and
10
dust particles are chemically aged by uptake of gas-phase species and heterogeneous reactions (Morales, 1986; Kim and Park, 2001; Park et al., 2004; Zhu et al., 2010).
The uptake of sulfate on to mineral dust is important both for dust properties and for the sulfur cycle. Freshly-emitted Sahara dust is very hydrophobic (Kaaden et al., 2009), whereas sulfate-coated mineral dust has increased CCN activity and may even
15
act as “giant CCN” (Levin et al., 1996), while sulfate coatings reduce the ice nuclei activity of mineral dust (Cziczo et al., 2009; Pruppacher and Klett, 1997). Mineral dust is a particularly important source of iron in nutrient-limited open ocean waters, and chemical aging can reduce the pH of dust, increasing the solubility and bioavailability of iron (Jickells et al., 2005; Gasso et al., 2010; Rubasinghege et al., 2010; Kumar et al.,
20
2010). Heterogeneous oxidation of SO2 on dust can lead to reductions of >50 % in SO2 concentration, and may account for 50–70 % of sulfate production in dust source regions (Dentener et al., 1996; Xiao et al., 1997; Zhu et al., 2010). Coagulation on to dust can also remove sulfuric acid aerosol and gas from the atmosphere. This means that dust reduces homogeneous nucleation of H2SO4 and changes the size
25
ACPD
12, 2303–2353, 2012Sulfur isotope fractionation during
heterogeneous oxidation of SO2
E. Harris et al.
Title Page
Abstract Introduction
Conclusions References
Tables Figures
◭ ◮
◭ ◮
Back Close
Full Screen / Esc
Printer-friendly Version
Interactive Discussion
Discussion
P
a
per
|
Dis
cussion
P
a
per
|
Discussion
P
a
per
|
Discussio
n
P
a
per
|
et al., 1996; Liao and Seinfeld, 2005). Understanding the uptake and oxidation of SO2 on mineral dust is a key part of investigating the interactions and feedbacks between dust, sulfur, climate and clouds.
Sulfur isotopes have been used to investigate homogeneous and aqueous oxidation of SO2 by OH, H2O2 and O3 (Harris et al., 2012). Sulfur isotope abundances are
5
described by the delta notation, which is the permil deviation of the ratio of a heavy isotope to the most abundant isotope (32S) in the sample compared to a standard ratio:
δxS (‰)=
n(xS) n(32S)
sample
(nn((32xS)S))V−CDT
−1
×1000 (1)
wherenis the number of atoms,xS is one of the heavy isotopes,33S, 34S or36S, and V-CDT is the international sulfur isotope standard, Vienna Canyon Diablo Troilite, which
10
has isotopic ratios of34S/32S=0.044163 and 33S/32S=0.007877 (Ding et al., 2001). Isotopic fractionation is represented by theα value, which is the ratio of the heavy to the light isotope in the products divided by the ratio in the reactants:
α34=
(nn((3432S)S))products
(nn((3432S)S))reactants
(2)
Values of α34 are characteristic for different reaction pathways and are therefore
15
useful to investigate the different oxidation pathways for SO2 on mineral dust in the laboratory and in the atmosphere.
This study presents measurements of the stable isotope fractionation of 34S/32S at room temperature (19◦C) during heterogeneous oxidation on dust surfaces and aqueous oxidation in dust leachate. The dust used is from the Sahara desert,
20
ACPD
12, 2303–2353, 2012Sulfur isotope fractionation during
heterogeneous oxidation of SO2
E. Harris et al.
Title Page
Abstract Introduction
Conclusions References
Tables Figures
◭ ◮
◭ ◮
Back Close
Full Screen / Esc
Printer-friendly Version
Interactive Discussion
Discussion
P
a
per
|
Dis
cussion
P
a
per
|
Discussion
P
a
per
|
Discussio
n
P
a
per
|
Coude-Gaussen et al. (1994) and Hanisch and Crowley (2001, 2003). We demonstrate that stable sulfur isotopes can be used to understand SO2 oxidation on mineral dust both in the laboratory and in the field, and are particularly useful to investigate the roles of different minerals in surface oxidation and to quantify the importance of aqueous ox-idation by transition metal ions in the atmosphere.
5
2 Background: uptake and oxidation of SO2by mineral dust
Uptake of SO2 to mineral dust can occur via the reversible, physisorption pathway, or the irreversible, chemisorption pathway, which can be followed by oxidation of the sorbed sulfite. This study will only consider irreversible uptake, which can account for>98 % of uptake at low SO2 concentrations (Adams et al., 2005; Goodman et al.,
10
2001). The initial uptake coefficient on Sahara dust, γ=4×10⁻⁵, is not dependent on RH, [SO2] or O3 (Crowley et al., 2010) which suggests SO2adsorption is the rate-limiting step, rather than subsequent reactions and oxidation (Ullerstam et al., 2002).
Oxidation of adsorbed S(IV) can follow a number of pathways: O3is a very efficient oxidant, and oxidation can also be catalysed by iron and manganese in dust (Usher
15
et al., 2002; Ullerstam et al., 2002). NO2(g) and surface nitrate have been observed to oxidise surface sulfite (Ullerstam et al., 2003), and oxidation to CaSO4occurs when calcite is exposed to SO2and O2(Al-Hosney and Grassian, 2005). Sulfate production has even been observed on MgO in the absence of O2 and O3, and was attributed to the highly basic character of four-coordinated O anions on steps and corners
(Pac-20
chioni et al., 1994; Goodman et al., 2001). In this study, SO2 will always be exposed to dust in synthetic air, and the reaction time will be very long, so the oxidation of adsorbed sulfite to sulfate should be close to completion (Ullerstam et al., 2002).
The SO2 removal rate on dry dust decreases significantly with exposure to SO2 as saturation is approached, suggesting uptake will only be important for∼10 h after dust
25
ACPD
12, 2303–2353, 2012Sulfur isotope fractionation during
heterogeneous oxidation of SO2
E. Harris et al.
Title Page
Abstract Introduction
Conclusions References
Tables Figures
◭ ◮
◭ ◮
Back Close
Full Screen / Esc
Printer-friendly Version
Interactive Discussion
Discussion
P
a
per
|
Dis
cussion
P
a
per
|
Discussion
P
a
per
|
Discussio
n
P
a
per
|
and release as CO2(g), increased mobility of surface ions leading to microcrystallite formation, and direct generation of new active sites (Ullerstam et al., 2002, 2003; Al-Hosney and Grassian, 2005; Li et al., 2006). IR absorption bands for adsorbed sulfate do not change upon exposure to humidity (Ullerstam et al., 2002, 2003). Saturation behaviour of SO2under exposure to UV light has not been measured, however
irradia-5
tion prevents surface saturation for ozone uptake on TiO2(Nicolas et al., 2009). These results suggest that experimental conditions such as humidity, ozone and irradiation will change the quantity of SO2 taken up and oxidised, while the initial uptake to form sorbed S(IV) is the rate-limiting step and is therefore expected to be the major factor controlling isotopic fractionation.
10
Aqueous oxidation by ions leached from dust may be a particularly important contrib-utor to oxidation of SO2in the atmosphere, especially as sulfate production increases aerosol hygroscopicity and CCN activity, facilitating further aqueous SO2 oxidation (Usher et al., 2002; Ullerstam et al., 2002, 2003; Li et al., 2006). The oxidative ac-tivity of leachates is due to catalysis by metal ions: Fe(III) is the most important of
15
these ions, however comparison to experiments with pure Fe salts show trace ions such as Mn and Cr also make a significant contribution to catalytic activity (Tilly et al., 1991; Rani et al., 1992). Catalytic activity does not significantly change when the solid phase is filtered out of the leachate. This shows aqueous oxidation dominates over any surface effects of particles in the solution (Cohen et al., 1981; Rani et al., 1992),
20
although, when aqueous iron and titanium oxide suspensions are irradiated, sulfate quantum yields≫1 have been observed due to desorption of ·SO−
3 and initiation of a radical chain reaction (Hong et al., 1987; Faust et al., 1989).
Aqueous oxidation shows complex pH-dependence, as metal ions are more soluble but the more reactive SO23− is less abundant at lower pH (Cohen et al., 1981; Rani
25
ACPD
12, 2303–2353, 2012Sulfur isotope fractionation during
heterogeneous oxidation of SO2
E. Harris et al.
Title Page
Abstract Introduction
Conclusions References
Tables Figures
◭ ◮
◭ ◮
Back Close
Full Screen / Esc
Printer-friendly Version
Interactive Discussion
Discussion
P
a
per
|
Dis
cussion
P
a
per
|
Discussion
P
a
per
|
Discussio
n
P
a
per
|
the same once the ions are leached into solution, thus the fractionation factor measured for dust leachate in this paper will also be applicable to leachate from combustion products such as fly ash (Cohen et al., 1981).
3 Methods
3.1 Apparatus and experiments
5
The dust used in this study was Sahara dust collected from the Cape Verde islands (SDVC). Its mineralogy, composition and properties are described in Coude-Gaussen et al. (1994) and Hanisch and Crowley (2001, 2003) and summarised in Table 1. The non-clay fraction of the dust contains primarily quartz, feldspars and calcite. Sahara sand obtained directly from the Sahara desert has a mean diameter of
10
>150 µm (Morales, 1986), whereas transported dust contains dust particles as small as 200 nm and has a mean diameter of<10 µm that decreases with distance trans-ported (Heinold et al., 2009; Kaaden et al., 2009; Wagner et al., 2009; Morales, 1986). Thus, Sahara dust from the Cape Verde Islands is much more relevant to atmospheric chemistry than a local sand sample which would include very coarse grain sizes.
15
3.1.1 Aqueous oxidation in mineral dust leachate
Leachate representing 0.5 g of dust per 100 ml was prepared by soaking the dust for two days in MilliQ water. The liquid phase was then poured offthe solid dust as aque-ous oxidation has been shown not to be affected when the solid phase is removed (Cohen et al., 1981; Rani et al., 1992). The concentrations of Al, Ca, Fe, Mg, Ba,
20
Mn, Ti, Cr and Sr in the leachate were measured by inductively-coupled plasma opti-cal emission spectrometry with a Perkin-Elmer Optima 3300 XL. SO2 gas (Linde AG, 102 ppm±2 % in synthetic air) was diluted with synthetic air (Westfalen AG, 20.5 % O
ACPD
12, 2303–2353, 2012Sulfur isotope fractionation during
heterogeneous oxidation of SO2
E. Harris et al.
Title Page
Abstract Introduction
Conclusions References
Tables Figures
◭ ◮
◭ ◮
Back Close
Full Screen / Esc
Printer-friendly Version
Interactive Discussion
Discussion
P
a
per
|
Dis
cussion
P
a
per
|
Discussion
P
a
per
|
Discussio
n
P
a
per
|
#2, respectively. This flow was passed through 300 ml of leachate in a bubbler, followed by a bubbler containing 6 % H2O2to collect residual SO2 as described in Harris et al. (2012). PFA fittings and tubings were used for all gas flows. The experiments were run for∼8 h. Following each experiment, both bubblers were rinsed and BaCl2was added to precipitate sulfate as BaSO4. The BaSO4 was collected by filtration through
Nu-5
clepore track-etch polycarbonate membrane filters (Whatman Ltd.) with 0.2 µm pores, which had been coated with a 10 nm-thick gold layer using a sputter coater (Bal-tec GmbH, Model SCD-050) prior to sample collection.
3.1.2 Heterogeneous oxidation on the Sahara dust surface at subsaturated humidity
10
Heterogeneous oxidation on mineral dust was investigated by passing 250 sccm of 4.2 ppm SO2 gas in synthetic air through a dust-coated filter, as shown in Fig. 1. Dust was pipetted on to gold-coated Nuclepore filters (0.2 µm pore) in a 1 : 2 ethanol : water mixture, which helped the dust to adhere to the filter better than mounting in pure wa-ter. A mixed cellulose ester filter (Whatman GmbH) was placed under the Nuclepore
15
filter to prevent tearing when gas flows were switched on and off. The mounted dust had a modal diameter of 2 µm with maximum grain diameters of∼8 µm, showing the dust was not significantly size-fractionated during mounting compared to the results of Coude-Gaussen et al. (1994). The reactor was made of glass with an FEP O-ring (Ralicks Industrie- und Umwelttechnik) connecting the two parts. PFA fittings and
tub-20
ings were used for gas flows. SO2gas (Linde AG, 102 ppm±2 % in synthetic air) was diluted with synthetic air (Westfalen AG, 20.5 % O2in N2) to the desired concentration before entering the reactor. A high concentration of SO2(4.2 ppm) was used to prevent significant isotopic changes to the residual SO2. Less than 1 % of the SO2gas reacted to form sulfate in all experiments. The residual SO2gas was collected in some
experi-25
ACPD
12, 2303–2353, 2012Sulfur isotope fractionation during
heterogeneous oxidation of SO2
E. Harris et al.
Title Page
Abstract Introduction
Conclusions References
Tables Figures
◭ ◮
◭ ◮
Back Close
Full Screen / Esc
Printer-friendly Version
Interactive Discussion
Discussion
P
a
per
|
Dis
cussion
P
a
per
|
Discussion
P
a
per
|
Discussio
n
P
a
per
|
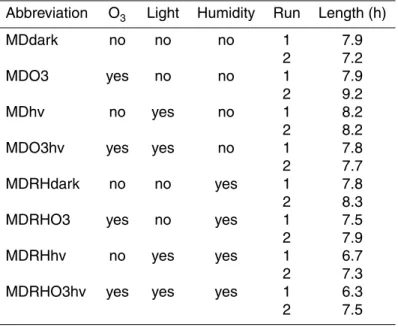
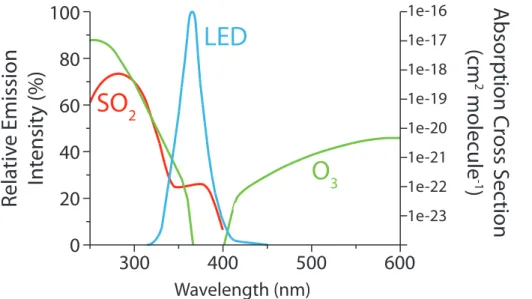
The reaction system was run under a variety of different conditions, which are sum-marised in Table 2 along with abbreviations that will be used throughout this paper. A high power LED (λmax=365 nm, 50 mW at 350 mA, Roithner Lasertechnik GmbH) was used to irradiate the dust in four experiments through a Suprasil quartz window (Heraeus Quarzglas GmbH), which has a transmittance of >90 % between 200 and
5
1000 nm. The emission spectrum of the LED is shown in Fig. 2, along with the absorp-tion spectra of O3 and SO2. Neither O3or SO2 absorb significantly in the wavelength range of the LED, so no gas-phase photolytic reactions will occur. Humidity was added to the reaction chamber in four experiments by passing the synthetic air flow through MilliQ water to achieve a relative humidity of around 40 %, which would correspond
10
to 2 monolayers of water on the dust (Gustafsson et al., 2005). The dust was not heated before use, so even samples with no added humidity will have surface-sorbed water molecules and inter-lamella water in the clay fraction. 20 ppm ozone was added to the gas mixture in four experiments by passing 100 sccm of the synthetic air flow over a low-pressure mercury vapour lamp (Jelight Company Inc., USA). The ozone
15
concentration was measured with a Thermo Electron Corporation UV Photometric O3 Analyzer (Model 49C). Each experiment was done in duplicate with and without the addition of humidity, for a total of 16 experimental runs. The experiments were run for 6–9 h to generate sufficient sulfate for NanoSIMS isotopic analysis. Following each experiment, filters were stored in airtight boxes before being mounted for NanoSIMS
20
and SEM analysis.
3.2 SEM analysis
A scanning electron microscope (SEM) was used to investigate the quantity of sulfate produced during the leachate experiments and the composition of individual dust grains in the different samples for the surface reaction experiments. The BaSO4 and dust
25
ACPD
12, 2303–2353, 2012Sulfur isotope fractionation during
heterogeneous oxidation of SO2
E. Harris et al.
Title Page
Abstract Introduction
Conclusions References
Tables Figures
◭ ◮
◭ ◮
Back Close
Full Screen / Esc
Printer-friendly Version
Interactive Discussion
Discussion
P
a
per
|
Dis
cussion
P
a
per
|
Discussion
P
a
per
|
Discussio
n
P
a
per
|
was operated with an accelerating voltage of 10 keV, a 60 µm aperture and a working distance of 9.6 mm. “High current mode” was used to increase the EDX signal and improve elemental sensitivity.
Before NanoSIMS analysis of the samples, the SEM was run in automatic mode and took 400 evenly-spaced images of each filter at 19 500×magnification. The EDX
5
spectrum was measured with a 1 s integration time at 25 points on a 5×5 grid for each image, leading to 10 000 EDX measurements across each filter. For the leachate oxidation BaSO4 samples, EDX signals were measured for O(Kα), Au(Lα), S(Kα) and Ba(Lα). The quantity of sulfate on each filter was then determined by estimating the background from both the Gaussian distribution of the gold signal and the quartile
10
method, as described in Harris et al. (2012) and Winterholler (2007). This quantifica-tion method is ideal for NanoSIMS studies, as quantificaquantifica-tion is achieved without extra sample treatment and the limit of detection is very low. The precision is fairly low (∼40 %, decreasing with increasing BaSO
4quantity due to Poisson statistics) and the method is not ideal for samples with a large amount of BaSO4due to the possibility of
15
the sample flaking offthe filter during mounting, thus isotope mass balance was also used to find the extent of reaction (see Sect. 4.1), as was used in Lin et al. (2011), Harris et al. (2012) and Derda et al. (2007).
During the analyses of the dust grains from the surface oxidation experiments, seven EDX channels were measured in automatic mode: Fe(Lα), Mg(Kα), Al(Kα), Si(Kα),
20
S(Kα), Ca(Kα) and Ti(Kα). The background was subtracted from the signals using the quartile method (Harris et al., 2012; Winterholler, 2007). The signals were used to investigate the composition of the mineral dust and association of sulfate with the different elements in the dust. The SEM images were also used to measure the size distribution of the dust, as described in Winterholler (2007). The density of the dust
25
was estimated to be 3.1 g cm−3
ACPD
12, 2303–2353, 2012Sulfur isotope fractionation during
heterogeneous oxidation of SO2
E. Harris et al.
Title Page
Abstract Introduction
Conclusions References
Tables Figures
◭ ◮
◭ ◮
Back Close
Full Screen / Esc
Printer-friendly Version
Interactive Discussion
Discussion
P
a
per
|
Dis
cussion
P
a
per
|
Discussion
P
a
per
|
Discussio
n
P
a
per
|
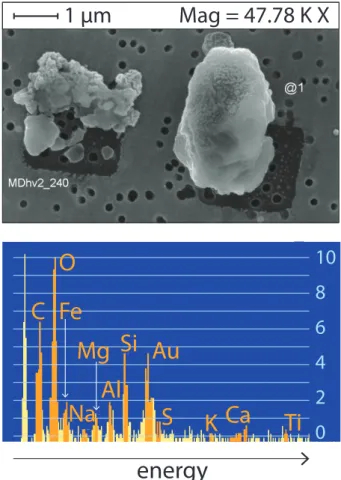
Following NanoSIMS analysis, the dust grains from the surface oxidation experi-ments were again examined in the SEM, to determine the chemical composition of the dust grain for each NanoSIMS analysis point. Coordinate transfer was used to locate the grains in the SEM and an image and an EDX spectrum were then taken at each point. An example is shown in Fig. 3. Peaks were counted if they were more than three
5
times the noise at the peak position (Goldstein et al., 1981), and an approximate height was measured by overlaying a grid as shown in the figure. The known composition of the dust (Hanisch and Crowley, 2003) was used to determine relative sensitivity factors (RSF) for the different elements based on the EDX measurements on unreacted dust grains. RSF values were in the expected range of 0.1 to 2 (Goldstein et al., 1981). An
10
approximate atomic percentage for all detectable elements could then be estimated for each experimental grain. The error in atomic percentage was defined as±1 unit on the overlayed scale, multiplied by the RSF for the element. The resulting composition obtained for each dust grain is not surface-sensitive as the X-rays are released from a depth of<1 µm (Goldstein et al., 1981), so the results will show the elements present
15
at the analysis point but will not be especially sensitive to the newly-produced sulfate from the experimental treatment.
3.3 NanoSIMS analysis
The sulfur isotopic composition was determined with the Cameca NanoSIMS 50 ion probe at the Max Planck Institute for Chemistry in Mainz (Hoppe, 2006; Groener and
20
Hoppe, 2006). The NanoSIMS 50 has high lateral resolution (<100 nm) and high sen-sitivity and can simultaneously measure up to five different masses through a multicol-lection system, allowing high precision analysis of the small sample quantities required for this study. The use of this instrument to analyse sulfur isotope ratios is described in detail elsewhere (Winterholler et al., 2006, 2008) and the analysis conditions are
25
described in Harris et al. (2012), so only a brief description will be given here.
ACPD
12, 2303–2353, 2012Sulfur isotope fractionation during
heterogeneous oxidation of SO2
E. Harris et al.
Title Page
Abstract Introduction
Conclusions References
Tables Figures
◭ ◮
◭ ◮
Back Close
Full Screen / Esc
Printer-friendly Version
Interactive Discussion
Discussion
P
a
per
|
Dis
cussion
P
a
per
|
Discussion
P
a
per
|
Discussio
n
P
a
per
|
charging. A∼1 pA Cs+ beam is focussed onto a∼100 nm sized spot and rastered in a 2 µm×2 µm grid over the grain of interest. The ejected secondary ions are carried into the mass spectrometer and multicollection system. For the BaSO4 from leachate oxidation experiments, each measurement consists of 200–400 cycles of 4.096 s du-ration preceded by varying lengths of presputtering until the gold coating (if present) is
5
removed and the count rate is stable. For the surface oxidation samples, the sulfate produced in the experiments will be on the surface of the particles, so analyses were fairly short and presputtering was kept to a minimum: each measurement consisted of 120 cycles of 4.096 s duration, and presputtering and beam centering were carried out on an area of at least 10 µm×10 µm so that the surface was conserved for analysis.
10
The session instrumental mass fractionation (IMF) was determined with IAEA BaSO4 standards SO5 and SO6, however the IMF for sulfate on mineral dust grains will also be dependent on the matrix. The major cation was determined from SEM-EDX analysis taken on individual grains after the NanoSIMS analysis, as described in the previous section, and the IMF correction relative to BaSO4was then applied according to
Win-15
terholler et al. (2008). The untreated Sahara dust contained a measureable quantity of sulfate, so a background correction of the isotope ratio was needed for the surface oxidation samples. The effect of this was minimised by keeping analyses short so that primarily surface sulfate was analysed, however the background was still significant. 28 untreated grains were analysed to quantify the background sulfur isotope signal. The
20
untreated grains had an average32S signal of 447±385 counts per second and aδ34S of 18.6±5.9 ‰. This falls within the range of values previously reported for sediments in the Sahara desert (Drake et al., 2004) and Sahara dust collected in the North Atlantic (Winterholler et al., 2006). Thus, experimentally-treated grains were only considered in the data analysis if their32S signal was>900 counts s−1
, and values ofδ34S for these
25
ACPD
12, 2303–2353, 2012Sulfur isotope fractionation during
heterogeneous oxidation of SO2
E. Harris et al.
Title Page
Abstract Introduction
Conclusions References
Tables Figures
◭ ◮
◭ ◮
Back Close
Full Screen / Esc
Printer-friendly Version
Interactive Discussion
Discussion
P
a
per
|
Dis
cussion
P
a
per
|
Discussion
P
a
per
|
Discussio
n
P
a
per
|
For each sample of the leachate experiments, at least five spots were measured and the weighted average and error was calculated, as described in Harris et al. (2012). The counting statistical error was typically 1–2 ‰ for each analysis spot and the overall error for each sample 2–5 ‰. For the surface oxidation experiments, the spot-to-spot error was added to the counting statistical error so that the measurements on each
5
grain could be treated individually, rather than calculating an average for all grains on a particular sample filter. The spot-to-spot error of the SO5 and SO6 standards was used as an estimate of the spot-to-spot error for the measurement session, and this was then combined with the counting statistical error to determine the measurement uncertainty for each individual grain. For each individual grain, the counting statistical
10
error was typically 4–5 ‰ and the overall error 5–6 ‰.
3.4 Positive matrix factorization
The composition of each grain from post-NanoSIMS SEM analysis was used as input for a Positive Matrix Factorization (PMF) model which was run with the software EPA PMF v3.0.2.2. This is a multivariate analysis tool which identifies factor profiles and
15
factor contributions for data sets which have a large number of variables measured across many samples (Norris et al., 2008). Although the model is designed to identify source profiles and contributions to environmental data sets, it is ideal for this study as it allows data points to be individually weighted and it constrains results so that no factor can have a negative contribution to a sample.
20
Atomic percentages of O, Fe, Na, Mg, Al, Si, S, K, Ca and Ti were used as input for the model, as well as S isotope measurements from NanoSIMS analysis. When a peak was below the limit of detection, an atomic percentage of one third of the lowest measured concentration for the element was used, and the uncertainty was set to twice the normal uncertainty for the element to reduce the weighting of the point. All
25
ACPD
12, 2303–2353, 2012Sulfur isotope fractionation during
heterogeneous oxidation of SO2
E. Harris et al.
Title Page
Abstract Introduction
Conclusions References
Tables Figures
◭ ◮
◭ ◮
Back Close
Full Screen / Esc
Printer-friendly Version
Interactive Discussion
Discussion
P
a
per
|
Dis
cussion
P
a
per
|
Discussion
P
a
per
|
Discussio
n
P
a
per
|
δ34S was set as the “total variable”, leading to an automatic “weak” classification. The “Extra Modeling Uncertainty” was set to the recommended 5 % (Norris et al., 2008). No two elements showed any significant correlation.
A random seed was used to initiate the model and 20 base runs were performed. The model was run with three, four and five factors and it was found that four factors
5
gave the most consistent results with the lowest Q (object function) value and the best resolution of elements and isotopic compositions. Only the four factor analysis will be discussed further. The model described the data adequately: the residuals were approximately normally distributed and only one scaled residual for one Al value was outside the ±3σ limit. The overall profiles of the four identified factors varied only
10
a small amount between the 20 model runs, and the dominant species in each factor remained the same in all 20 runs.
4 Aqueous oxidation in Sahara dust leachate
4.1 Catalytic activity of the solution and rate of reaction
The concentrations of various elements present in the leachate, measured with
ICP-15
OES, are shown in Table 3. The leachate was extremely efficient at oxidising SO2, thus the fractionation factor must be found by considering the Rayleigh equations, which describe the isotopic composition of products and residual reactants as a function of the fractionation factor and the fraction of reactant remaining unreacted (Mariotti et al., 1981; Krouse and Grinenko, 1991). The fraction of SO2 remaining was measured
20
for each of the two experimental runs both with SEM quantification as described in Sect. 3.2 and by considering mass balance between the measured isotopic composi-tion of the residual SO2and the product sulfate:
ACPD
12, 2303–2353, 2012Sulfur isotope fractionation during
heterogeneous oxidation of SO2
E. Harris et al.
Title Page
Abstract Introduction
Conclusions References
Tables Figures
◭ ◮
◭ ◮
Back Close
Full Screen / Esc
Printer-friendly Version
Interactive Discussion
Discussion
P
a
per
|
Dis
cussion
P
a
per
|
Discussion
P
a
per
|
Discussio
n
P
a
per
|
wheref is the fraction of reactant (SO2) remaining andδ 34
Si,δ 34
SSO2 andδ 34
Ssulfate are the isotopic compositions of the initial SO2gas, residual SO2gas and product sul-fate, respectively. For each experimental run both estimates differed by<1 %, and the two estimates were averaged to find the fraction remaining for each of the experimental runs.
5
The oxidation of SO2by mineral dust leachate was very efficient. >99 % of SO2was oxidised after passing through one bubbler, compared to the 39 % of SO2 that is col-lected in one bubbler containing 6 % H2O2and<1 % that is oxidised in a bubbler with 0.1 M Fe2+/Fe3+(Harris et al., 2012). The fraction oxidised at [SO2]=6.7 ppm (99.8 %) was only slightly higher than the fraction oxidised at [SO2]=13.3 ppm (99 %), showing
10
the leachate was not close to exhausting its oxidation capacity. Thus, it is clear iron is not the most important transition metal for the catalysis of SO2 oxidation in mineral dust leachate solutions; other ions measured in the solution, such as manganese and chromium, are also highly active in oxidation. This is in agreement with the results of Tilly et al. (1991) and Rani et al. (1992), which showed that these ions do not just
15
contribute independently to oxidation, but that mixtures of ions interact synergistically, resulting in greatly-enhanced oxidation rates. Thus, soluble iron alone is not a good indicator of SO2 oxidising ability, which may explain why correlation between soluble Fe and sulfate is often poor (Kumar and Sarin, 2010; Baker et al., 2006).
4.2 Fractionation of34S/32S during aqueous oxidation in Sahara dust leachate
20
The fractionation factor can be found from the Rayleigh equation describing theδ34S of the sulfate product with respect to the fraction of SO2oxidised (Mariotti et al., 1981; Krouse and Grinenko, 1991):
α34=
ln1−
R
p Ri
(1−f)
ACPD
12, 2303–2353, 2012Sulfur isotope fractionation during
heterogeneous oxidation of SO2
E. Harris et al.
Title Page
Abstract Introduction
Conclusions References
Tables Figures
◭ ◮
◭ ◮
Back Close
Full Screen / Esc
Printer-friendly Version
Interactive Discussion
Discussion
P
a
per
|
Dis
cussion
P
a
per
|
Discussion
P
a
per
|
Discussio
n
P
a
per
|
whereRpandRiare the ratios of34S/32S for the product sulfate and the initial SO2gas, respectively andf is the fraction of SO2remaining. Theδ34S of the sulfate formed in the leachate needs to be corrected for the contribution from sulfate that was leached from the dust itself. The effect of this correction onδ34Spwas negligible as the leachate contained<1 µM of sulfate while the reaction added>200 µM of sulfate to the solution.
5
The fractionation factor can also be found from the Rayleigh equation describing the
δ34S of the residual SO2 gas and the fraction of SO2 oxidised (Mariotti et al., 1981; Krouse and Grinenko, 1991):
α34=
lnRr
Ri
lnf −1 (5)
whereRr and Riare the ratios of 34
S/32S for the residual SO2 gas and the initial SO2
10
gas, respectively and f is the fraction of SO2 remaining. The measuredδ 34
S of the residual SO2was corrected for fractionation during collection in H2O2as described in Harris et al. (2012).
Four estimates of α34 were thus obtained: from the residual SO2 and the product sulfate for each of the two experimental runs. The four measurements were averaged
15
and the 1σstandard deviation taken as the error:
αleachate=0.9917±0.0046 (6)
at 19◦
C. The majority of the uncertainty in the fractionation factor is due to the uncer-tainty in the NanoSIMS measurements of theδ34S values. The fractionation factor is not significantly different to the fractionation factor for the oxidation of SO2by a solution
20
of Fe2+ and Fe3+ (αFe=0.9894±0.0043) measured by Harris et al. (2012). However, in agreement with previous studies (Cohen et al., 1981; Tilly et al., 1991; Rani et al., 1992), the quantity of sulfate produced (see Sect. 4.1) shows that iron is not the only transition metal present in leachate that is active in catalysing SO2oxidation. Concen-trations of other transition metals in the leachate that are also available for reaction,
ACPD
12, 2303–2353, 2012Sulfur isotope fractionation during
heterogeneous oxidation of SO2
E. Harris et al.
Title Page
Abstract Introduction
Conclusions References
Tables Figures
◭ ◮
◭ ◮
Back Close
Full Screen / Esc
Printer-friendly Version
Interactive Discussion
Discussion
P
a
per
|
Dis
cussion
P
a
per
|
Discussion
P
a
per
|
Discussio
n
P
a
per
|
such as Cr and Mn, are presented in Table 3. Thus, the identity of the metal catalysing SO2oxidation does not affect the sulfur isotope fractionation, which suggests fraction-ation is not due to the initifraction-ation reaction but the subsequent reactions in the chain (Herrmann et al., 2000). The average fractionation factor for transition metal-catalysed oxidation of SO2from the current and previous measurements is:
5
αTMI=0.9905±0.0031 (7)
5 Fractionation of34S/32S during heterogeneous oxidation on Sahara dust surfaces
5.1 Quantification of sulfate production
Sulfate production on the dust surface and subsaturated humidity was quantified as
10
described in Sect. 3.2, and the results are shown in Fig. 4. Experiment lengths ranged from 6.3 to 9.2 h, so the results shown were corrected and represent the estimated con-centration after exactly 8 h of experimental time, to factilitate comparison between ex-periments. The surface sulfate increase will be significantly more than the reported total atomic percentage increase, as EDX measurements are not surface-sensitive
(Gold-15
stein et al., 1981). As an estimate, for a grain 2 µm in diameter with experimentally-produced sulfate added only to the top 20 nm of the grain surface, the sulfate con-centration in the surface layer would increase by more than 1000 % for MDRHO3hv, rather than the 30 % increase when the whole grain volume is considered. The to-tal amount of sulfate was seen to increase in all experiments except for MDRHhv,
20
although all changes are within the statistical error of the SEM measurement except for MDRHO3hv. The count rates observed during NanoSIMS analysis show an in-crease for all treated samples compared to the control, and are also much higher for MDRHO3hv, in agreement with the SEM samples. Thus, sulfate production is fairly slow and similar for all experiments except MDRHO3hv: this combination of
condi-25
ACPD
12, 2303–2353, 2012Sulfur isotope fractionation during
heterogeneous oxidation of SO2
E. Harris et al.
Title Page
Abstract Introduction
Conclusions References
Tables Figures
◭ ◮
◭ ◮
Back Close
Full Screen / Esc
Printer-friendly Version
Interactive Discussion
Discussion
P
a
per
|
Dis
cussion
P
a
per
|
Discussion
P
a
per
|
Discussio
n
P
a
per
|
ozone, light and water vapour interacted synergistically to oxidise SO2much more effi -ciently than any of these parameters alone.
5.2 Bulk elemental analysis of reactive particles
Correlations between the sulfur EDX signal and the EDX signal of other elements may provide information on which elements are most important for sulfate production.
Au-5
tomatic EDX points with sulfur and at least one other element above the background were therefore examined for correlations, in both the untreated and treated dust sam-ples. Each sample had>100 EDX points with significant signals for sulfate and at least one other element, so correlations could be examined individually within each sample type. In untreated dust, correlations can indicate whether the sulfate present is primary
10
and present in the Sahara source region, or whether it is secondary and results from uptake and reactions during transport to the Cape Verde Islands. S and Ti signals show a slight positive correlation (R2=0.35) in the untreated samples, which suggests the sulfate is secondary: primary sulfate would be more likely to be associated with Ca and Mg due to clays and minerals such as gypsum (Caquineau et al., 2002).
15
Correlations on experimental samples were only seen for those runs with no ozone or irradiation: S on MDdark dust was weakly correlated with Ti and Fe (R2=0.19 and 0.13, respectively), while S on MDRHdark dust was strongly correlated with Ti and Ca (R2=0.66 and 0.53, respectively). No mineralogical information is provided in automatic EDX analysis, and it is likely that the lack of correlation in other samples is
20
because element concentrations are a poor representation of element availability for reaction, rather than an indicator that sulfate is produced evenly across dust grains. The SEM-EDX analysis also has a resolution of only∼1 µm, and grain heterogeneity with regards to mineralogy on this scale (Falkovich et al., 2001) will obscure correlations in the SEM-EDX signal.
25
ACPD
12, 2303–2353, 2012Sulfur isotope fractionation during
heterogeneous oxidation of SO2
E. Harris et al.
Title Page
Abstract Introduction
Conclusions References
Tables Figures
◭ ◮
◭ ◮
Back Close
Full Screen / Esc
Printer-friendly Version
Interactive Discussion
Discussion
P
a
per
|
Dis
cussion
P
a
per
|
Discussion
P
a
per
|
Discussio
n
P
a
per
|
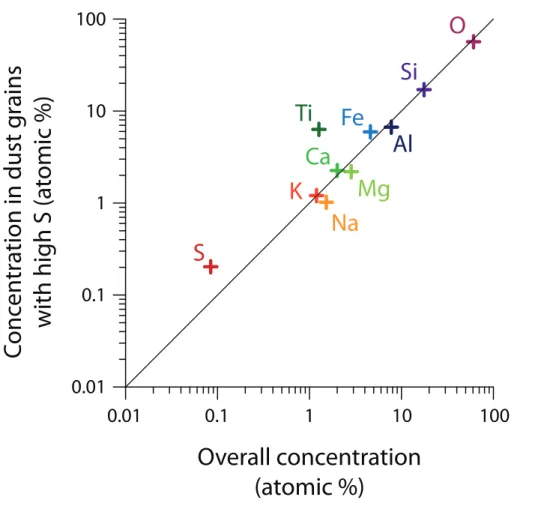
compared to the overall dust profile. This comparison is shown in Fig. 5. It can be seen that Ti is strongly enriched in oxidising dust, and K, Fe and Ca are slightly en-riched, while Na, Mg, Al, Si and O show no relationship to oxidising ability of dust and only fall slightly below the 1 : 1 line because of mass balance. This is consistent with the correlations from automatic SEM analysis: Ti, Fe and Ca are the most important
5
elements for oxidising ability, particularly in dark experiments where ozone and light are not available to facilitate further reaction pathways, while mineralogy is clearly the dominant factor controlling uptake.
5.3 34S/32S fractionation on different dust components
The isotopic composition of sulfate on experimentally-treated samples was much more
10
variable than on control grains, even within one set of experimental conditions. Vari-ability within one set of experimental conditions was as large as overall variVari-ability of the data set. As atmospheric dust is strongly internally mixed with regards to mineralogy (Falkovich et al., 2001) most analysed grains will represent a mix of minerals, so a mul-tivariate analysis model (described in Sect. 3.4) was used to examine the relationship
15
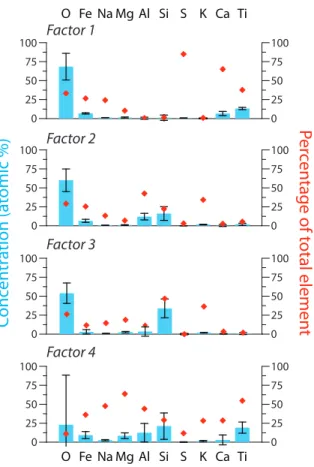
between grain composition and isotopic fractionation. Four factors were identified from the PMF analysis. Each factor is not representative of a single mineral, but rather of a group of minerals that, acting together or separately, cause the same isotopic frac-tionation during sulfate formation. The elemental profiles of these factors are shown in Fig. 6. To determine the isotopic fractionation factor of the factor, factor contributions
20
for each grain were plotted againstδ34S. The intercept where the factor contribution was one gave the fractionation factorα34 of the factor.
The factor α34 values were used to predict the δ34S of the measured dust grains based on their composition, to test the fit between modelled and actual fractionation. The discrepancy between predicted and measured δ34S was no greater than what
25
ACPD
12, 2303–2353, 2012Sulfur isotope fractionation during
heterogeneous oxidation of SO2
E. Harris et al.
Title Page
Abstract Introduction
Conclusions References
Tables Figures
◭ ◮
◭ ◮
Back Close
Full Screen / Esc
Printer-friendly Version
Interactive Discussion
Discussion
P
a
per
|
Dis
cussion
P
a
per
|
Discussion
P
a
per
|
Discussio
n
P
a
per
|
δ34Sobserved=(0.90±0.11)δ34S
predicted−(5.81±2.54) (8)
which shows that the model fits the data well. However, this is not a rigorous test of the model as the same 102 measurements were used to generate the factorα34 values and to test them, but it indicates the factors are well-resolved with respect to isotopic fractionation.
5
Plots to determine fractionation factors were made for all samples together, as well as for sub-groups of samples to determine the role of experimental conditions in iso-topic fractionation. The results are shown in Fig. 8. The error in the estimates ofα34
for the sub-groups are much higher due to the much smaller number of measurements (47 and 55 grains for “all humid” and “all dry”, respectively; 20–31 grains for the effects
10
of O3 and light). The α34 could not be determined for individual experimental condi-tions (eg. MDO3 or MDRHhv) as the number of grains (8–14) was too small, thus the uncertainty in the result too large to be useful. It can be seen that presence or absence of humidity, light and ozone has much less effect on the isotopic fractionation than the dust composition: fractionation factors for different subsets generally agree with overall
15
fractionation within the error for each factor. This shows that isotopic fractionation is primarily due to uptake of SO2(g) and not subsequent oxidation.
Based on the elemental profile of each factor, its interaction with experimental con-ditions, and its reactivity, the mineralogical identity and reaction mechanism asso-ciated with each factor was inferred. They are discussed in the following sections
20
and summarised in Table 4. Several estimates of the oxidation rate for each factor were obtained: the sulfate production percentage refers to the percentage of the to-tal sulfate that was generated by that factor during the experiment. The reactivity (µg sulfate g−1mineral h−1) is the amount of sulfate produced per gram of the miner-als represented by the factor, divided by length of the experiment; the calculation does
25
ACPD
12, 2303–2353, 2012Sulfur isotope fractionation during
heterogeneous oxidation of SO2
E. Harris et al.
Title Page
Abstract Introduction
Conclusions References
Tables Figures
◭ ◮
◭ ◮
Back Close
Full Screen / Esc
Printer-friendly Version
Interactive Discussion
Discussion
P
a
per
|
Dis
cussion
P
a
per
|
Discussion
P
a
per
|
Discussio
n
P
a
per
|
and sulfate production on different dust types based on their mineral assemblages, however further investigation would be necessary given the strong role of mineral mix-ing in oxidation rate. The rate represented by the reactivity refers to the MDRHO3hv experiments, where the largest amount of sulfate was produced; oxidation under all other conditions is on average 16×slower and the uncertainty is much greater.
5
The reactivity and the BET surface area were used to estimate the reactive uptake coefficientγ for the dust according to Jayne et al. (1990):
γobs=4Fg
¯
cA ∆n
n (9)
whereFg is the carrier gas flow rate (cm3s−1), ¯cis the mean thermal velocity (cm s−1;
q
3kBT
m ),Ais the total droplet surface area (cm 2
) and ∆nn is the reduction in gas
concen-10
tration. Theγobs value found from this expression represents a combination of mass transfer, accommodation and reaction limitations, and provides only an estimate of the reactive uptake rate as it does not account for diffusion rate within the solid. The overall
γobsfor the dust, considering both reactive and non-reactive components, is 2.7×10⁻⁶, which is∼1 order of magnitude lower than previously reported values (Crowley et al.,
15
2010). This is well within the expected range considering the surface area of the dust is likely to be overestimated in this study as the dust is lying on a filter, rather than suspended in a flow reactor, and the previously reported values are for initial uptake coefficients before uptake slows due to aging and saturation. The dust in this study is a good representation of atmospheric dust that has already been aged, as it was
20
transported from the Sahara desert to the Cape Verde Islands before being collected for use in experiments.
5.3.1 Factor 1
Factor 1 has a fractionation factor of α34=1.012±0.010 which shows no significant variation depending on experimental conditions. It has high concentrations of Fe and
25
ACPD
12, 2303–2353, 2012Sulfur isotope fractionation during
heterogeneous oxidation of SO2
E. Harris et al.
Title Page
Abstract Introduction
Conclusions References
Tables Figures
◭ ◮
◭ ◮
Back Close
Full Screen / Esc
Printer-friendly Version
Interactive Discussion
Discussion
P
a
per
|
Dis
cussion
P
a
per
|
Discussion
P
a
per
|
Discussio
n
P
a
per
|
in agreement with observations of relatively high uptake coefficients for SO2 on TiO2 and on iron oxides and oxyhydroxides (Zhang et al., 2006; Crowley et al., 2010). The co-occurence of Fe and Ti suggests that the factor is representative of ilmenite, with some degree of weathering towards pseudorutile and rutile accounting for the excess Ti (Janssen et al., 2007; Putnis, 2002). Ilmenite is a chemically stable mineral that
5
would be likely to have survived transport from the Sahara to the Cape Verde Islands and aging while on the Cape Verde Islands prior to collection (Janssen et al., 2007). The importance of Ti in the most reactive factor agrees with the EDX sulfur correlation results from Sect. 5.2 which found Ti to be enriched in areas where sulfate production was highest.
10
As the uptake of SO2, rather than the oxidation, controls isotopic fractionation, the coordination mechanism for SO2should relate to the isotopic fractionation. Given that theα is robust to experimental conditions and well-resolved for Factor 1, the fraction-ation factor on the rutile (TiO2) and on the parent ilmenite are the same. Hematite, goethite, magnetite and TiO2 have all been shown to chemisorb SO2 to a bidentate
15
complex, with similar IR spectral bands observed for the adsorbed compounds where available. This suggests these three iron oxides will also have the same value forα
as TiO2 and by extension the sameα as ilmenite (Fu et al., 2007; Zhang et al., 2006; Usher et al., 2002). Factor 1 also has a significant amount of Ca. This may be due to formation of CaSO4 from colocated Ca2+, possibly as the sample dries when it is
20
put under vacuum for analysis. It is unlikely that CaO or CaCO3are directly taking up sulfate as the mechanisms of uptake (monodentate and direct reaction, respectively) are very different to iron and titanium oxides, and would not be expected to show the same fractionation factor (Usher et al., 2002).
In summary, ilmenite and its weathering product rutile are the most active
compo-25
ACPD
12, 2303–2353, 2012Sulfur isotope fractionation during
heterogeneous oxidation of SO2
E. Harris et al.
Title Page
Abstract Introduction
Conclusions References
Tables Figures
◭ ◮
◭ ◮
Back Close
Full Screen / Esc
Printer-friendly Version
Interactive Discussion
Discussion
P
a
per
|
Dis
cussion
P
a
per
|
Discussion
P
a
per
|
Discussio
n
P
a
per
|
5.3.2 Factor 2
Factor 2 contributes 3.2 % of total sulfate production, and produces sulfate that is strongly enriched in 32S. The elemental composition suggests the factor represents feldspar, which is known to be a common constituent of Sahara dust (Coude-Gaussen et al., 1994; Glaccum and Prospero, 1980). Al2O3 alone can have a relatively high
5
uptake coefficient if it is basic in character (Judeikis et al., 1978; Crowley et al., 2010), while SiO2 and acidic Al2O3 have very low uptake coefficients (Zhang et al., 2006). Adsorption at acidic sites is reversible physisorption, while irreversible chemisorption occurs at basic sites and can be followed by oxidation (Karge and Dalla Lana, 1984). Thus, uptake in this factor will be dominated by basic sites associated with Al. Fe ions
10
associated with the feldspar, and seen in the factor elemental composition, would in-crease the acidic character, consistent with the relatively low reactivity. Although Fe3+ can catalyse S(IV) oxidation (Herrmann et al., 2000), this reaction pathway will be in-significant without an aqueous phase.
The adsorption of SO2on Lewis base sites in Al2O3results in sulfite with significantly
15
different IR absorption bands to, for example, MgO (Goodman et al., 2001), which explains the strongly negative isotope fractionation that is very distinct from the other factors. The mechanism of uptake on to Al2O3 is coordination to exposed oxygen atoms (Lewis base sites) followed by rearrangement resulting in sulfite chemisorbed to aluminium through the sulfur atom.
20
In summary, basic aluminium oxide sites associated with feldspars, a common con-stituent of Sahara dust, chemisorb SO2 with a fractionation factor of α34=0.948± 0.012, which is also expected to be the fractionation factor for adsorption on to pure basic aluminium oxides. The sulfate production due to this factor is 0.40 µg of sulfate per mg of feldspar and aluminium oxide per hour.
ACPD
12, 2303–2353, 2012Sulfur isotope fractionation during
heterogeneous oxidation of SO2
E. Harris et al.
Title Page
Abstract Introduction
Conclusions References
Tables Figures
◭ ◮
◭ ◮
Back Close
Full Screen / Esc
Printer-friendly Version
Interactive Discussion
Discussion
P
a
per
|
Dis
cussion
P
a
per
|
Discussion
P
a
per
|
Discussio
n
P
a
per
|
5.3.3 Factor 3
The isotope fractionation produced by Factor 3 was slightly positive and very similar to Factor 1. The contribution of Factor 3 to total sulfate formation was minor (0.1 %). The elemental composition of Factor 3 shows that it is primarily composed of quartz, as well as olivine and pyroxene, which are expected to be major components in Sahara dust
5
(Coude-Gaussen et al., 1994; Glaccum and Prospero, 1980). However, pure SiO2 has been measured to have very low or no reactivity with SO2(g) in the laboratory (Zhang et al., 2006; Usher et al., 2002, respectively). Li et al. (2007) found that the addition of MgO to NaCl resulted in an increase in reactivity towards SO2larger than that expected from the individual uptake coefficients, and Zhang et al. (2006) also found
10
excess reactivity in a mixture of continental crust components such as SiO2and MgO. Factor 3 contains a significant amount of Mg as well as other cations so it is likely mixing of SiO2 and components with basic character, such as magnesium oxides or olivine, has increased the reactivity of the quartz fraction of the dust to a significant level. Spectra and adsorption mechanisms for SO2 on silicates are not available, but
15
the similarity of the fractionation factor for Factor 3 to that of Factor 1 suggests a similar, but much slower, adsorption mechanism.
In summary, adsorption of SO2 to mixtures of quartz and components with basic character results in a fractionation factor ofα34=1.007±0.011. The total sulfate pro-duction is 0.05 µg of sulfate per mg of quartz per hour.
20
5.3.4 Factor 4
Factor 4 contributes 11.7 % to the total sulfate production and produces sulfate strongly enriched in34S. The elemental profile shows that the factor represents clays, particu-larly smectite, illite and chlorite, which have been shown to be major components of the clay fraction of Sahara dust from the Cape Verde Islands (Coude-Gaussen et al., 1994).
25
ACPD
12, 2303–2353, 2012Sulfur isotope fractionation during
heterogeneous oxidation of SO2
E. Harris et al.
Title Page
Abstract Introduction
Conclusions References
Tables Figures
◭ ◮
◭ ◮
Back Close
Full Screen / Esc
Printer-friendly Version
Interactive Discussion
Discussion
P
a
per
|
Dis
cussion
P
a
per
|
Discussion
P
a
per
|
Discussio
n
P
a
per
|
sulfate presented in Sect. 5.2. Uptake of SO2 by MgO and CaO has a relatively high rate (Crowley et al., 2010; Usher et al., 2002; Zhang et al., 2006), however DRIFTS IR absorption bands for sorbed S(IV) suggest sulfite is adsorbed quite differently on CaO and MgO (Low et al., 1971; Goodsel et al., 1972) so it is unlikely the adsorption to interlayer cations in clays can be represented by adsorption to oxides. SO2 will react
5
directly with CaCO3to produce CaSO3which is readily oxidised to CaSO4(Al-Hosney and Grassian, 2005; Li et al., 2006), and an analogous reaction with interlayer Ca and Mg is most likely the cause of SO2uptake in Factor 4. Factor 4 also has a large amount of Ti, however the fractionation factor is not in agreement with Ti uptake from Factor 1. The calculated α34 for Factor 4 is lower, i.e. closer to the α34 of Factor 1, when the
10
dust is exposed to O3 or light, thus it appears that Ti associated with clay can only significantly contribute to SO2oxidation when the reaction is facilitated by light or O3.
In summary, adsorption of SO2 to interlayer cations, particularly Ca2+ and Mg2+, in clays such as smectite results in a strongly positive fractionation ofα34=1.085±0.013. Sulfate production is 2.91 µg per mg of clay minerals per hour of reaction time.
15
5.4 Overall34S/32S fractionation on Sahara dust
The total average fractionation factor for heterogeneous SO2 oxidation on the surface of Sahara dust can be estimated by two methods. The weighted average of all 102 indi-vidual NanoSIMS measurements results in aδ34S of 9.5±3.9 ‰. The average compo-sition from the PMF, found by weighting theα34values from the different factors by their
20
uptake efficiency and contribution to the total dust mass, is δ34S=10.1±9.9 ‰. The two values agree very well and can be combined to estimate the average fractionation for the heterogeneous oxidation of SO2on the surface of Sahara dust:
αhet=1.0096±0.0036 (10)
This average fractionation factor is only relevant for the particular dust sample
mea-25
ACPD
12, 2303–2353, 2012Sulfur isotope fractionation during
heterogeneous oxidation of SO2
E. Harris et al.
Title Page
Abstract Introduction
Conclusions References
Tables Figures
◭ ◮
◭ ◮
Back Close
Full Screen / Esc
Printer-friendly Version
Interactive Discussion
Discussion
P
a
per
|
Dis
cussion
P
a
per
|
Discussion
P
a
per
|
Discussio
n
P
a
per
|
should be calculated based on the factor-specific fractionation factors and the mineral-ogy and ageing of the dust of interest.
5.5 Sensitivity of sulfate production and isotopic fractionation to O3, light and humidity
As discussed in the preceeding sections, isotopic fractionation shows little sensitivity
5
to the parameters that were varied between experiments. The relative contributions of the four factors to sulfate production were also not significantly affected by the exper-imental conditions. This shows chemical composition and mineralogy of a dust grain are the most important parameters causing differences in isotopic fractionation, with the experimental conditions playing a secondary role. Isotopic fractionation will be
10
controlled by the rate-limiting step, as the fraction reacted for other reaction steps will be ∼1, meaning that isotopic selectivity in these steps will not have an effect on the final product. The various experimental parameters would be likely to affect oxidation of adsorbed S(IV) but have less effect on initial uptake (Judeikis et al., 1978; Adams et al., 2005), thus the results of this study are consistent with previous laboratory
stud-15
ies, which have determined that SO2adsorption is the rate-limiting step for SO2uptake and oxidation on mineral dust (Ullerstam et al., 2002; Li et al., 2006).
The experimental parameters will affect the saturation behaviour of the dust, how-ever in most experiments the oxidation rate was low and the dust was not exposed to SO2 long enough to reach saturation (Mamane and Gottlieb, 1989). However, when
20
the dust is exposed to humidity, light and ozone simultaneously (MDRHO3hv), the quantity of sulfate produced is >7 times higher than in any other experiment. Hu-midity regenerates the reactive capacity of dust for SO2 uptake (Judeikis et al., 1978; Ullerstam et al., 2002), possibly due to the increased mobility of surface ions which leads to the re-exposure of active sites (Al-Hosney and Grassian, 2005). Uptake and
25