Functional Fuzzy Based Autism Assessment
Support System
Anju Pratap 1, C.S. Kanimozhiselvi 2, K.V Pramod 3, R. Vijayakumar4
1
Research Scholar, Anna University, Chennai, India
2
Department of Computer Science and Engineering, Kongu Engineering College, Erode, India
3
Department of Computer Applications,
Cochin University of Science and Technology, Kerala, India
4
School of Computer Sciences, Mahatma Gandhi University, Kerala, India
Abstract—Childhood autism is one of the most common developmental disorders in children, whose disabilities generally tend to follow through adulthood. The therapy given to an autistic child depends on its accurate assessment, which is a challenging clinical decision making problem. This paper describes the application of functional fuzzy model in autism assessment support systems. The fuzzy model uses Takagi-Sugeno Kang (TSK) type of inference mechanism for supporting the assessment. A rule based single input-single output first order functional fuzzy model has been applied to a set of real world data and the experimental results were compared with the conventional autism assessment method. The results demonstrate that the proposed method works better in putting the borderline between autistic grades in terms of accuracy. Thus the functional fuzzy model can support in assessing the grade of childhood autism with certainty.
Keyword- autism; Functional fuzzy model; Assessment Handler; Takagi Sugeno Kang type model;
I. INTRODUCTION
Autism is a neuropsychiatric disorder of early childhood, defined exclusively on the basis of impairments in social interaction and communication, and repetitive or stereotypical behaviours, delineated in the DSM IV[1][5]. Childhood autism is considered as a Pervasive Developmental Disorder (PDD) that impairs the communication and social functioning in a child. It is characterised by abnormal language usage, poor social interaction, stereotypic vocal-motor movements and restricted interests .These abnormalities differ qualitatively from non-verbal activities like eye contact and facial expressions to verbal repetitions and motor stereotypes[25]. The therapy for autism depends on its severity assessed by a clinician. Very early diagnosis is difficult and even expert clinician experiences uncertainty in some cases [8]. The key factors behind an accurate diagnosis are the knowledge and expertise of a clinician to grade the strength of qualitative symptoms present in a child. Thus accurate autism assessment has become a challenging decision making problem and gained much research interest in psychology. This challenge motivated us to apply a classification method in grading autistic disorder. Application of fuzzy models in decision making has been used for the past several years. Functional or Local fuzzy model is one such approach which is highly adaptable to a classification problem.
A. Conventional Assessment Method
• 1 point: Perfectly normal and never showed such problem • 2 points: Feature present minimal and rare
• 3 points: Feature present frequently thereby impairing a skill • 4 points: Feature present almost all the time making a skill absent
Upon dilemma about the above four degrees, points like: 1.5, 2.5, 3.5 can also be given [25]. Likewise, clinician manually quantifies all concerned features using points (i.e. input score) and calculates a final Cumulative Score Point (CSP). Depending on the tool that uses for as assessment, autistic grades are usually labelled as: ‘Mild’, ‘Moderate’, ‘Severe’. Each tool has its own predefined threshold values for the above autistic grades. The calculated CSP is then compared with the predefined threshold of each autistic grade and hence the conventional method is named as ‘calculation based grading’ for a differentiation. Based on a comparison with thresholds, the child may be graded with one of the above four labels.
1) Relevance of research in assessment model: Many clinicians are not well confident in certain autistic cases because their observed prediction (based on knowledge and expertise) may not be similar to the calculation based grading. During uncertainty, they grade the disorder as either ‘Mild-to-Moderate’ or ‘Moderate-to-Severe’ rather than confidently putting a border line between ‘Mild’, ‘Moderate’ and ‘Severe’. Another drawback is that, all symptoms are given equal priority and none of them is analysed for its contribution to the final grading. Classification is simply based on a CSP obtained during the assessment. For example, when a child shows 10 normal features and 5 severe features out of 15 symptoms, according to the input score points 1 to Normal and 4 to Severe are to be given. Then the calculated CSP becomes 30, which is obtained by: (10×1+5×4). But as per the CARS diagnostic criteria, a CSP of 30 comes in the class ’Mild’. In this situation a clinician raises serious concern regarding those severe 5 symptoms; still he could grade the child as ‘Mild’ according to the convention. Hence, the diagnostician him-self finds a second opinion for an accurate diagnosis[8]. Many parents continue to experience lengthy and often frustrating delays before they finally receive a correct diagnosis [13]. This research work tries to resolve some of these issues using a function-al fuzzy system. A fuzzy system can bring a solution from uncertainty to certainty. Thus the objective of this research work is to study the application of functional fuzzy model in autism assessment especially for a unique grading without compromising accuracy and certainty.
2) Related works: Researchers have used different artificial intelligence models in various domains of diagnostic reasoning like a medical diagnosis, fault diagnosis etc. This section discusses about two artificial intelligence techniques in the domain of autism prediction. The first work is about Fuzzy Cognitive Map (FCM) with non linear-Hebbian learning model, was proposed previously for autism prediction which has attained a classification accuracy of 79.9 % [16]. Another study investigated about FCM ensembles and its application in autism prediction. This ensemble was able to perform better than a single FCM with non linear Hebbian learning model, and has shown a classification accuracy of 89.41 % [21]. The above two studies used 40 cases for performance analysis on both FCM based approaches.
The second technique is about artificial neural network, which is a computer simulation of highly interconnected processing elements called neurons, having the capability to learn from a set of data. Many research works were done on the application of neural networks for autism diagnosis. A Feed Forward Back Propagation neural network has attained a classification accuracy of 95% on 138 samples [5]. Another was a comparative study on Multi Layer Perceptron (MLP) and Logistic regression in which MLP has given a better performance of up to 92%. The next research work was a hybrid SOM_ RBF model for the diagnosis of Attention Deficit Hyperactive Disorder (ADHD) that used 40 samples for training and testing [4]. The overall performance of that model was 85-90%. In addition to soft computing models, there are expert systems for autism diagnosis [28]. A Naive Bayesian probabilistic classifier that classifies the symptoms to normal or abnormal has also been existing, that attained an accuracy of 98% [23].
4) Functional Fuzzy Model: A fuzzy inference system effectively models human expertise for a specific problem in the form of structured if-then rules. It has found successful applications in a wide variety of fields like expert system, data classification, pattern recognition etc. Fuzzy set theory provides a systematic way to represent information linguistically and, uses these linguistic labels for an inference mechanism by performing numerical computations. Such systems are referred to as Fuzzy Rule Based (FRB) systems, composed of fuzzy if-then rules. A linguistic variable is considered as an ordered pair (x, T (x)), in which ‘x’ is the name of the variable and T (x) is called the term set of ‘x’ [14]. As an example, if age is interpreted as a linguistic variable then its term set T (age) could be:
T (age) = {young, middle aged, old} where each term in T (age) is characterised by a fuzzy set of a universe of discourse x= [0, 100]. A single rule with single antecedent is the simplest form of fuzzy reasoning where the truth of consequent can be inferred from the truth of the antecedent. Such rule can be of form:
R: if the condition is P then decision is Q
Here P and Q are the antecedent and consequent respectively which are defined in the input-output space of the problem. The principle of locality and distributed nature of a rule based model shows that each single input antecedent part can be interpreted as a different local descriptor of the problem. These FRB systems are highly adaptable, expandable and modular. The modular quality of FRB computing evolves into different adaptive fuzzy systems where defuzzification becomes optional. One such variant of fuzzy rule based system architecture is a Functional fuzzy model [22]. In this model, the antecedent part of the rule may have fuzzy set or crisp value but the consequent is a function of antecedent base variable (s). It uses a Takagi Sugeno Kang (TSK) type inference mechanism and the rules are of form:
R: if X is W then Y=f (x)
Here X is a linguistic variable with value W and x is a base variable of X [17]. Here the function f (x) correctly describes the model output of the antecedent fuzzy sets. Thus the scope of the function is focussed to the condition part which supports the information granule represented by W. A functional fuzzy model is said to be in first order if its consequent function is a linear one. Hence these models are considered as instances of scaled inference rather than the compositional rule of inference. It is to be noted that the antecedents of TSK model are of the fuzzy nature only where as the consequents are functional dependencies [22][27] .
II. SAMPLECOLLECTIONANDMODELLING
The conventional and manual assessment methods usually classify a child as either ‘Normal’ or ‘Abnormal’ without compromising accuracy. The goal of this research was to implement an automated classification method that classifies the grade of childhood autistic disorder that includes: ‘Normal’, ’Mild’, ‘Moderate’ and ‘Severe’. It is to be noted that the child will be graded as ‘Normal’ when the symptoms are normal for the age. In order to model this assessment method, the research has been performed in following stages:
A. Knowledge Acquisition and Design
Related medical information was gathered through a knowledge elicitation phase that includes domain experts as well as parents. A review of conventional assessment methods also helped to acquire knowledge about the behavior of autistic children at home and public places. Usually the onset of autistic symptom is around the age of 2 years; hence the selected age group for this study was 2-3 years. Hence a judgment sampling method has been used for primary data collection. Then most predominantly seeing symptoms are arranged based on the case histories of 100 autistic children. This phase was completed after selecting 15 mostly seen features that have been used for designing a questionnaire which is given in Appendix 1 [23]. It is observed that autism affects commonly in boys than girls in a ratio greater than 3:1. Persistence of abnormalities for more than 6 months contributes to a high suspicion index, which is the prerequisite and will lead to an autism assessment. B. Functional Fuzzy based model of clinical assessment
Fig.1. Block diagram of the Model based on Function Fuzzy Mechanism
The different modules are: Input Module, Fuzzify Module, Inference Module, Strengthening Module and
Decision Module. As discussed in section 2.1, the selected 15 features are represented using 15 attributes. The expansion of 15 attributes is shown after Table 1. These attributes are used as antecedents of rules as shown in Appendix 2. Here, each feature (symptom) ‘S’ is characterized as a linguistic variable ’Si’ and its term set T (Si)
contains: T (S) = {Normal, Low, Medium, High}, where each term T (S) is characterized by a fuzzy set of a universe of discourse S: [0, 4]. Each term {Low, Medium, and High} represent the abnormal level of a feature present in the child. For example, if a child maintains no eye contact during conversations then the clinician quantifies its degree of presence as 4 and the system assigns linguistic variable ‘High’ to the attribute ’eye_ contact’. A brief introduction of different modules is as given below:
The Input Module arranges 15 attribute values to form a symptom vector ’S’ and submit it to Fuzzify Module. .
A triangular fuzzifier has been used which fuzzifies the each input attribute ‘Si’ to a ‘Xi’. The membership
function µ (Xi), maps each element ‘Xi’ to an output function that returns a value between 0 and 1. To carry out
an approximate reasoning, these fuzzified attributes are then applied to an inference procedure which is performed by the Inference Module. In this module, all the rules are of TSK type where the consequent function returns an output which is represented as ‘Yi’. The values returned by the consequent functions are submitted to
Strengthening Module that strengthens or updates Output Module based the contribution of each ‘Yi’. This
contribution is named as strength factor, F. The OutputModule consists of 4 output classes’: Znorm, Zmild, Zmod
and Zsev to represent the different disorder grades: ‘Normal’, ‘Mild’, ‘Moderate’ and ‘Severe’ respectively.
Initially these output classes are empty and gets updated by a process in the Strengthening Module. Then the Normalization Module normalizes the outputs by multiplying with its predefined weight vector ‘W’. Finally the Decision Module decides an output class having a maximum score as the winner and hence the child is graded with the winner class label. An algorithm named ‘Assessment Handler’ shows the general steps in the system to assess the grade of disorder. In this algorithm, cumulative score means the total contribution obtained in each class. The details of each step are discussed in section 3.
Algorithm: Assessment Handler
Inputs: Symptom Vector ‘S’ and Weight vector ‘W’ Output: Grade of Disorder ‘Z’
Initialize cumulative scores of each output class to 0
1. For all symptoms ‘Si’ such that 1≤i≤15 do
2. Read ‘Si’ from ‘Input Module’
3. Xi=Fuzzify (Si)
4. Yi=Inference (Xi)
5. If ‘Yi’ belongs to a single output class
5.1 Then update its cumulative score by contributing a strength factor, F.
6. Otherwise update cumulative scores of multiple output classes by contributing different strength factors.
7. End for
8. Normalize all classes in the ‘Output Module’ using ‘W’ 9. Return an output class ‘Z’ having a maximum cumulative score.
Input Module
Fuzzify Module
Inference Module
Strengthening Module
Normalization Module
III.IMPLEMENTATIONDETAILS
This section describes about the function of each module and various calculations that are performed to attain that function.
A. Input Module
The function of this module is to form an input vector for the fuzzifier. Initially a clinician fills the ques-tionnaire based on the observations found on a suspected child. Each symptom is represented as an attribute in the model. Four options are given for each attribute, which can take a fuzzy number as an input score point: 1, 1.5, 2, 2.5, 3, 3.5, and 4. Then the points obtained from 15 attributes are arranged to form an input symptom vector S= [S1, S2, S3... S15] which is the input to the Fuzzify Module
B. Fuzzify Module-The Fuzzifier
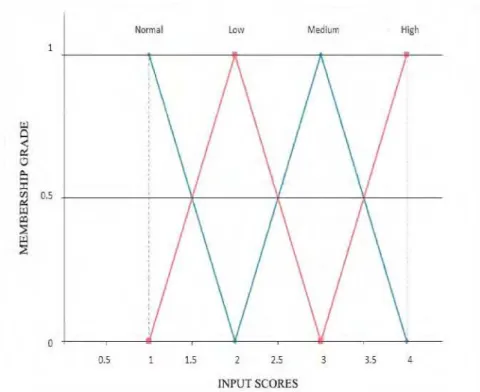
The linguistic range and term set of variables are as shown in Table 1. All the 15 attributes are fuzzified using a triangular fuzzifier that finds membership grade for each of the fuzzy sets.
TABLE 1 Fuzzy Set
Range Term Set
[1-2] Normal [1-3] Low
[2-4] Medium
[3-4] High
The input member functions are µNormal (x), µLow (x), µMedium (x), µHigh (x) as shown in the equations Eqs. (1) - (4) respectively
= − , ≤ ≤, ℎ (1)
=
, < ≤ , < < ℎ
(2)
=
, < ≤ , < < , ℎ
(3)
ℎ = , < ≤
, ℎ (4)
Fig. 2 shows a triangular fuzzifier in which the term sets are : Normal, Low, Medium and High. A cross point between two membership functions µx1 and µx2, is a value ‘xcross’ such that µx1 (xcross) = µx2 (xcross), which is >0.
Fig. 2.Triangular Fuzzifier
C. Inference Module- The Fuzzy Rule Base
Fuzzy inference is the process of formulation of a mapping between input and output using fuzzy logic [2]. Finding the individual contribution of each symptom and modeling it to the overall severity of the disorder is the main logic behind this proposed method. Hence all 60 rules in the FRB are made of TSK type and have a Single Input-Single Output (SISO) structure. A SISO structured rule is able to find the contribution of each individual symptom to the final decision. Hence combinations of symptoms are avoided. Appendix 2 contains 15 sample rules for this model. Usually TSK model is ideal for problems where the output is either linear or constant. Each of the input fuzzy values is directly or linearly related to the output class. Hence the straight line equation which is of first order is used to model the consequent function i.e. y= mx+c. As the line cuts the origin, c becomes 0. The functions are formulated as equations as given Eqs. (5)- (8), where the variables: gnorm, gmild, gmod, gsev and normal, low, med, sev are used to calculate the slope of the straight line.
The values returned by these functions are stored in an output vector ‘Y’ which is of the form Y= [Y1, Y2,
Y3...Y15], where each Yi ranges from 0 to 1.
= (5)
= (6)
= (7)
= µ ) (8)
D. Strengthening Module- Updating the Output Classes
The function of this module is to find the contribution of each symptom to the final disorder grade. As discussed before, the output grades are: ‘Normal’,’ Mild’, ‘Moderate’, ‘Severe’ andits cumulative scores are represented using Z-values: Znorm, Zmild, Zmod and Zsev respectively. This model takes a real world concept of a baby’s
development that “A 1 year 6 months old baby has attained all the developmental milestones of age 1 and is still attaining of age 2. Otherwise we can say that the child has achieved the milestone of age 1 fully and of age 2 partially”. In order to model this, a concept called strength factor ‘F’ has been introduced as given in the Assessment Handler. The ‘F’ values of four output grades are: 0.25, 0.5, 0.75, and 1.0. All ‘Yi’s’ obtained from
15 attributes show the individual contribution of those symptoms to the severity level of the disorder. Consider the following example:
this module splits the ‘F’ value into two and contributes to both classes. Now the cumulative score of ‘Moderate’ gets updated by 0.75 and of ‘Severe’ by 0.125, analogous to the baby’s development.
Similarly all Yi strengthens its respective classes by giving its contribution to increase the cumulative
score point.
E. Normalization Module.
The order of severity level of inputs are Normal<Low<Medium<High and outputs are
Normal<Mild<Moderate<Severe respectively. As the order of severity level increases from Normal to Severe, a weight vector ‘W’ is used to normalise the cumulative score of each output grade. The vector ‘W’ is represented as [Wnorm, Wmild, Wmod, Wsev] and is initialised with the values [0.25, 0.5, 0.75, 1] respectively. This
is obtained using the equation Eq (9):
= (9)
Here Mk is Input Peak Value (IPV) of the kth term set , N is the total number of output classes or grades and k = {1,2,3,4}. Here IPV of the triangular fuzzifier are 1, 2, 3, and 4 for Normal, Low, Medium and High respectively. The purpose of normalization is to overcome one of the disadvantages as discussed in section 1.2. On a 15 attribute scale,if 10 are ‘Normal’ and 5 are ‘High’, then a child cannot be diagnosed as either ‘Normal’ or ‘Normal to Mild’ because 5 symptoms are severe even though less in number. This weighted normalization is to decrease the effect of the major number of lower classes and to increase the effect of minor number of higher classes. So cumulative scores of output classes: Znorm, Zmild, Zmod and Zsev are multiplied by its respective weight
vectors.
F. Decision Module
The Decision Module takes a decision about the grade of autistic disorder from the cumulative scores of the output grades. As the cumulative score represents a cumulative contribution of all the input attributes to a grade, the decision logic finds a class having the maximum cumulative score. The higher the cumulative score, the greater contribution is
. A max () function has been designed to retrieve the maximum Z-value among the output classes. Fig. 3 shows a graphical representation, about the total contribution obtained by each class from the total symptoms. This figure is based on the data of an autistic child from the dataset.
Fig. 3. Pie chart of Z values: Class numbers 1, 2, 3, 4 represent the grades: Normal, Mild, Moderate and Severe respectively. The Z values of four classes are 0.125, 2.0625, 2.25 and 1. Class 3 i.e. ‘Moderate’ has got the maximum contribution to the overall disorder.
IV.MODEL VALIDATION AND DISCUSSION.
A total of 100 real world cases were collected during the data collection phase, in which all the cases had already been diagnosed and graded by a clinician. These 100 cases are divided into two sets/samples; first set contains 70 cases which were graded by a clinician as: ‘Normal to Mild’, ‘Mild to Moderate’ or ‘Moderate to Severe’ due to uncertainty and second set contains 30 cases which were certainly graded as Normal, Mild, Moderate or Severe. This model is validated by measuring its performance based on 4 criteria. For validation, the test sample ‘S’ which is of size 100 has been used. Following subsection discusses each of the performance criteria and the values obtained for each criterion is as given in Table 2
1 2%
2 38%
3 41%
4 19%
TABLE. 2
Performance of the proposed model
A. Classification Accuracy (CCR)
Classification Accuracy is represented using a Cases Correctly Classified (CCR) percentage, which is calculated using Eq (10):
= (10)
Here ‘C’ represents the number of correctly classified cases and ‘S’ is the sample Size. A total of 98 cases are correctly and certainly classified from ‘S’ and this result demonstrates that the model is able to give a CCR percentage of not less than 98. A noticeable advantage of the proposed model is that, it is able to provide a solution for an input vector having missing symptoms, without compromising much to accuracy. This is attained because the model looks for the contribution of other related symptoms to the disorder and, then a decision is given based on the class strength.
Fig. 4 is a graph showing a comparison between CCR percentages of Functional fuzzy model with the
other two trained competitive neural nets that have been discussed in section 1.4. The x-axis corresponds to different models and the y-axis represents its CCR percentage. All models have used the same real world sample i.e. S. The CCR percentage of the proposed functional fuzzy model is highlighted.
Fig. 4. Graph showing Model vs. Classification Accuracy of proposed model and competitive neural network models.
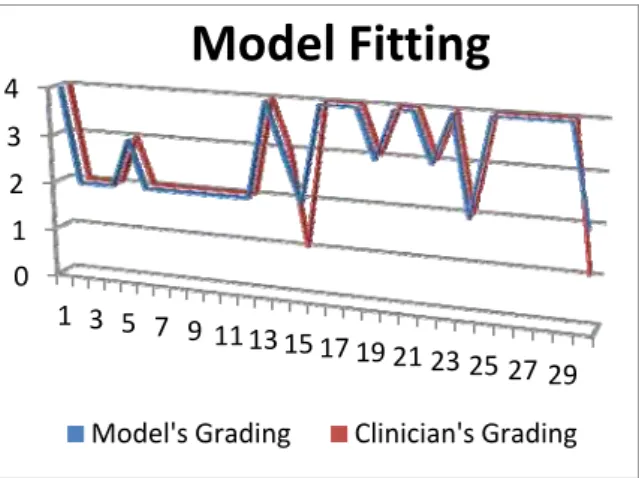
The first 70 cases were also diagnosed certainly with a unique grade instead of vaguely classifying or grading as ‘Mild to Moderate’ or ‘Moderate to Severe’. This shows that the clinician was not able to confidently classify the disorder to a unique grade. But the proposed model was able to predict or classify the child to a unique grade of disorder, thereby avoiding a vague representation. Rather than merely depending on a final threshold, the proposed functional fuzzy model looks into all symptoms and finds the cumulative contribution of these symptoms to the overall disorder. Fig. 5 is a line chart which shows the fitting of the proposed functional fuzzy model over the conventional autism assessment method.
Performance Criterion
Value
CCR (%) 98
MSE 0.02 RMSE 0.1414
Fig. 5.This Line chart compares the autistic grading of functional fuzzy model vs. conventional method on sample ‘S’. The X axis and Y axis represent case numbers (case#) and grades respectively.
B. Mean Square Error (MSE)
MSE is an important criterion to analyse the performance of a classifier or a predictor. It measures the average of the squares of the error that implicitly represent the loss happened between the actual and the predicted. For ith case, let ‘Xi’ and ‘Yi’ denote the grade assessed by the proposed method and conventional method respectively .The MSE of the model is 0.02 which is obtained using Eq (11):
= ∑ − (11)
C. Error rate (errors)
Another performance measurement criterion is the error rate, represented using ‘errors’, which is related to
the CCR. The error rate is an easy interpretable measurement about a model’s performance which shows the proportion of instances in ‘S’ misclassified. It is otherwise called as misclassification rate which is calculated using the Eq (12):
errors= (12)
Here ‘M’ represents the number of misclassified cases obtained from ‘S. The functional fuzzy model has shown a misclassification percentage of 2.
D. Assessment Time (AT)
The time taken by the system to support a decision is calculated as Assessment Time, ‘AT’. It is the time taken by system to give a decision after the input vector is given. This is actually the running time taken by the system to show an output, which measured in seconds. The minimum time taken by the implemented model to diagnose a new case is 0.036236sec.
V. CONCLUSION
One of the emerging applications of fuzzy solution is in decision making problems, especially in medical diagnostic reasoning. This research article presents an application of functional fuzzy model in assessing the grade of childhood autistic disorder. A new approach to autistic grading has been proposed, which is based on the contribution of individual symptoms on the overall severity. Real sample collection and group elicitation based knowledge acquisition has also been conducted in the initial phase of the research. A TSK type first order fuzzy inference mechanism has used for implementing a decision system. Based on literatures, a comparative study has also been performed on related soft computing and conventional assessment techniques. The performance measurements demonstrate that this inference mechanism is able to classify the child to a unique grade (i.e. Normal, Mild, Moderate, Severe) with better accuracy even if the clinician is uncertain about the grade. This would definitely provide a decision support to those clinicians who are in their initial career stages and lacking expertise.
REFERENCES
[1] American Psychiatric Association. "Diagnostic And Statistical Manual Of Mental Disorders DSM-IV-TR Fourth Edition (Text
Revision) Author: American Psychiatr." (2000): 943.
[2] Arora, Manisha, and Dinesh Tagra. "Neuro-fuzzy expert system for breast cancer diagnosis." In Proceedings of the International
Conference on Advances in Computing, Communications and Informatics, pp. 979-985. ACM, 2012.
[3] Arthi, K., and A. Tamilarasi. "Prediction of autistic disorder using neuro fuzzy system by applying ANN technique." International
Journal of developmental neuroscience 26, no. 7 (2008): 699-704.
[4] Arthi, K., and A. Tamilarasi. "Hybrid model in prediction of adhd using artificial neural networks." International Journal of
Information Technology and knowledge management (2009): 209-215.
[5] Cohen, Ira L., Vicki Sudhalter, Donna Landon-Jimenez, and Maryellen Keogh. "A neural network approach to the classification of
autism." Journal of autism and developmental disorders 23, no. 3 (1993): 443-466.
0 1 2 3 4
1 3 5 7 9 1113 15 17 19 21
23 25 27 29
Model Fitting
[6] Sivanandam, S. N., and S. N. Deepa. Introduction to neural networks using Matlab 6.0. Tata McGraw-Hill Education, 2006. [7] Driankov, A., and R. Unberhauen. "An introduction to fuzzy control." (1993).
[8] Florio, Tony, Steward Einfeld, Bruce Tonge, and Avril Brereton. "Providing an Independent Second Opinion for the Diagnosis of
Autism Using Artificial Intelligence over the Internet." Counseling, Psychotherapy, and Health: The Use of Technology in Mental Health 5, no. 1 (2009): 232-248.
[9] DSM-III-R casebook: a learning companion to the Diagnostic and statistical manual of mental disorders (revised). American
Psychiatric Press, 1989.
[10] Ghaffari, Abdollahi, H. Abdollahi, M. R. Khoshayand, I. Soltani Bozchalooi, A. Dadgar, and M. Rafiee-Tehrani. "Performance
comparison of neural network training algorithms in modeling of bimodal drug delivery." International journal of pharmaceutics 327, no. 1 (2006): 126-138.
[11] Gustafsson, Lennart, and Andrew P. Papliński. "Self-organization of an artificial neural network subjected to attention shift
impairments and familiarity preference, characteristics studied in autism." Journal of autism and developmental disorders 34, no. 2 (2004): 189-198.
[12] Ganesh, M. Introduction to fuzzy sets and fuzzy logic. PHI Learning Pvt. Ltd., 2006.
[13] Howlin, Patricia, and Anna Moore. "Diagnosis in Autism A Survey of Over 1200 Patients in the UK." Autism 1, no. 2 (1997): 135-162.
[14] Jang, Jyh-Shing Roger, and Chuen-Tsai Sun. Neuro-fuzzy and soft computing: a computational approach to learning and machine
intelligence. Prentice-Hall, Inc., 1996.
[15] Kale, S. N., and S. V. Dudul. "Determination of the type of Erythemato-Squamous Disease using Intelligent classifier." International
Journal of Global Technology Initiatives 1, no. 1 (2012): F6-F13.
[16] Kannappan, Arthi, A. Tamilarasi, and Elpiniki I. Papageorgiou. "Analyzing the performance of fuzzy cognitive maps with non-linear
hebbian learning algorithm in predicting autistic disorder." Expert Systems with Applications 38, no. 3 (2011): 1282-1292. [17] Klir, George J., and Tina A. Folger. "Fuzzy sets, uncertainty, and information." Hall1988 (2003).
[18] Konar, A.(1999) Artificial intelligence and soft computing:behavioural and cognitive modeling of the human brain,Vol.1,CRC Press.
[19] Kosko, Bart. "Fuzzy cognitive maps." International journal of man-machine studies 24, no. 1 (1986): 65-75.
[20] Miles, J. H., T. N. Takahashi, S. Bagby, P. K. Sahota, D. F. Vaslow, C. H. Wang, R. E. Hillman, and J. E. Farmer. "Essential versus
complex autism: definition of fundamental prognostic subtypes." American Journal of Medical Genetics Part A 135, no. 2 (2005): 171-180.
[21] Papageorgiou, Elpiniki I., and Arthi Kannappan. "Fuzzy cognitive map ensemble learning paradigm to solve classification problems:
Application to autism identification." Applied Soft Computing 12, no. 12 (2012): 3798-3809.
[22] Pedrycz, Witold, and Fernando Gomide. Fuzzy systems engineering: toward human-centric computing. John Wiley & Sons, 2007.
[23] Pratap, A., and C. S. Kanimozhiselvi. "Application of Naive Bayes dichotomizer supported with expected risk and discriminant
functions in clinical decisions—Case study." Advanced Computing (ICoAC) (2012): 1-4.
[24] Rutkowski, Leszek. Computational intelligence: methods and techniques. Springer, 2008.
[25] Schopler, Eric, Robert J. Reichler, Robert F. DeVellis, and Kenneth Daly. "Toward objective classification of childhood autism:
Childhood Autism Rating Scale (CARS)." Journal of autism and developmental disorders 10, no. 1 (1980): 91-103. [26] Rutter, Michael. "Diagnosis and definition." In Autism, pp. 1-25. Springer US, 1978.
[27] Ross, Timothy J. Fuzzy logic with engineering applications. John Wiley & Sons, 2009.
[28] Veeraraghavan, Sampathkumar, and Karthik Srinivasan. "Exploration of Autism Expert Systems." In Proceedings of the International