Polymorphism in the internal transcribed spacer (ITS) of the ribosomal DNA
of 26 isolates of ectomycorrhizal fungi
Eliane A. Gomes
1, Maria Catarina M. Kasuya
2, Everaldo G. de Barros
3, Arnaldo C. Borges
2and Elza F. Araújo
21
Núcleo de Biologia Aplicada - Embrapa Milho e Sorgo, Sete Lagoas, MG, Brazil.
2
Departamento de Microbiologia / BIOAGRO, Universidade Federal de Viçosa, Viçosa, MG, Brazil.
3
Departamento de Biologia Geral / BIOAGRO, Universidade Federal de Viçosa, Viçosa, MG, Brazil.
Abstract
Inter- and intraspecific variation among 26 isolates of ectomycorrhizal fungi belonging to 8 genera and 19 species were evaluated by analysis of the internal transcribed sequence (ITS) of the rDNA region using restriction fragment length polymorphism (RFLP). The ITS region was first amplified by polymerase chain reaction (PCR) with specific primers and then cleaved with different restriction enzymes. Amplification products, which ranged between 560 and 750 base pairs (bp), were obtained for all the isolates analyzed. The degree of polymorphism observed did not allow proper identification of most of the isolates. Cleavage of amplified fragments with the restriction enzymesAlu I, Hae III,Hinf I, and Hpa II revealed extensive polymorphism. All eight genera and most species presented specific restriction patterns. Species not identifiable by a specific pattern belonged to two genera: Rhizopogon (R. nigrescens, R. reaii, R. roseolus, R. rubescens and Rhizopogon sp.), and Laccaria (L. bicolor and L. amethystea). Our data confirm the potential of ITS region PCR-RFLP for the molecular characterization of ectomycorrhizal fungi and their identification and monitoring in artificial inoculation programs.
Key words:DNA fingerprinting, ectomycorrhizal fungi, internal transcribed spacer (ITS), PCR-RFLP, ribosomal DNA (rDNA).
Received: April 6, 1999; accepted: September 3, 2002.
Introduction
Ectomycorrhizal fungi have an important role in for-est ecosystems because they mutualistically associate with different plant species, thereby increasing nutrient absorption while protecting the host plant against patho-gens and abiotic stresses (Smith and Read, 1997; Allen, 1991). Taxonomically diverse, these fungi include be-tween 5,000 and 6,000 species, mainly basidiomycetes (Molinaet al., 1992).
Phenotypic differences between two isolates of the same species of an ectomycorrhizal fungus may be as pro-nounced as the differences between two distinct species, and for this reason identification of these fungi is not clear-cut (De la Bastideet al., 1995). Identification of ectomycorrhizal fungi is mainly based on the analysis of sporocarps whose presence is triggered by specific environmental conditions (Egger, 1995; Gardes and Bruns, 1996). Usually the identifi-cation of the mycosymbiont by morphological analyses of the mycorrhiza is more feasible than sporocarp analyses,
al-though special skills are required to directly analyze a root-attached symbiont (Karénet al., 1997).
DNA-based molecular techniques combining the polymerase chain reaction (PCR) with analysis of restric-tion fragment length polymorphisms (RFLP) represent new tools to aid in properly identifying ectomycorrhizal fungi. The PCR-RFLP technique, coupling two known proce-dures to detect polymorphisms in DNA regions which have been amplified by specific oligonucleotide primers and re-stricted with different endonucleases, has been successfully used to analyze regions of ribosomal DNA of ectomycorrhizal fungi (Gardeset al., 1991; Erlandet al., 1994; Henrion et al., 1994; Farmer and Sylvia, 1998; Gomeset al., 1999; Glenet al., 2001a). The internal tran-scribed spacer (ITS) region separating genes 17S and 25S, can be amplified by specific primers anchored in these two units. Since the ITS region is highly conserved intras-pecifically but variable between different species it is often used in taxonomy (Brunset al., 1991; Hillis and Dixon, 1991), but ITS region polymorphism for identifying ectomycorrhizal fungi species has been determined for only a restricted number of species, leaving its full potential as a taxonomic tool as yet unexplored (Karénet al., 1997).
www.sbg.org.br
Send correspondence to Elza Fernandes de Araújo. Departamento de Microbiologia / BIOAGRO, Universidade Federal de Viçosa, 36571-000 Viçosa, MG, Brazil. E-mail: [email protected].
In the work published in this paper, 26 isolates of ectomycorrhizal fungi belonging to 8 genera and 19 differ-ent species were analyzed using the PCR-RFLP technique as applied to the ITS regions of these fungi. These analyses aimed to confirm the classification of these fungi and also to find markers able to facilitate the identification of spe-cific isolates for breeding purposes.
Materials and Methods
Fungal isolates and culture conditions
Ectomycorrhizal fungi isolates (Table I) were obtained from the fungal collection maintained at the Labo-ratory of Mycorrhizal Associations, Department of Micro-biology, Federal University of Viçosa, Minas Gerais, Brazil. Cultures were maintained in Petri dishes containing modified Melin-Norkrans agar medium (MMN) (Marx, 1969) for 25 days at 28 °C. Mycelia for DNA extraction
were obtained by inoculating MMN broth with agar plugs containing mycelia collected from actively growing colony margins, followed by 25 days static incubation at 28 °C. Ectomycorrhizae were obtained as described by Junghans
et al.(1998).
DNA extraction
DNA was extracted from 0.5 to 1.0 g of fresh myce-lium or ectomycorrhizae, according to the method of Schäfer and Wöstemeyer (1992) as modified by Junghans
et al.(1998). DNA concentration was estimated by com-parison with known standards in 1% (w/v) agarose gels stained with ethidium bromide.
PCR amplification and RFLP analysis
The primer pairs used to amplify the rDNA ITS re-gion (ITS1 and ITS4) have been described by Whiteet al.
(1990). The cycling parameters were: 40 cycles, each cycle
Table I- The ectomycorrhizal fungi studied and their origin and hosts.
N.º Species Isolate Origin Host
1 Rhizopogon nigrescens CK 4 Viçosa - MGa- Brazil Pinussp.
2 R. reaii CK 7 Viçosa - MG - Brazil P. caribaea
3 R. roseolus CK 29 Viçosa - MG - Brazil P. patula 4 R. roseolus CK 30 Viçosa - MG - Brazil P. patula
5 R. roseolus CK 31 Viçosa - MG - Brazil P. patula 6 R. roseolus CK 32 Viçosa - MG - Brazil P. patula 7 R. roseolus CK 33 Viçosa - MG - Brazil P. patula
8 R. vinicolor A 153 USA Tsuga heterophylla
9 R. rubescens DR 181 Unknown P. resinosa
10 Rhizopogonsp. RN ITA Itabira - MG - Brazil P. elliottii
11 R. subcaerulescens RS1USA Oregon - USA Unknown
12 Suillus granulatus CK 13 Viçosa - MG - Brazil P. caribaea
13 S. luteus 9012 Unknown P. nigricans
14 S. granulatus SGEB Viçosa - MG - Brazil Pinussp.
15 S. granulatus SG 91 Viçosa - MG - Brazil Pinussp.
16 S. brevipes 7598 Unknown P. contorta
17 Laccaria laccata S 444 Oregon – USA Pseudotsugasp.
18 L. amethystea DR 227 USA Unknown
19 L. bicolor DR 72 USA Unknown
20 Sclerodermasp. SCL ITA Itabira - MG - Brazil P. elliottii
21 S. areolatum DR 165 USA Quercussp.
22 Cenococcum geophilum CGL France Eucalyptussp.
23 C. geophilum CGP USA Pinussp.
24 Hebeloma cylindrosporum HC France Unknown
25 Paxillus involutus PI France E. dalrympleana
26 Pisolithus tinctorius PT 145* Florianópolis – SCb- Brazil Eucalyptussp. 27 P. tinctorius PT 90A* Viçosa – MG - Brazil Eucalyptussp.
a
The state of Minas Gerais.
bThe state of Santa Catarina.
consisting of a denaturation step at 94 °C for 1 min, an an-nealing step at 50 °C for 1 min and an extension step at 72 °C for 1 min 30 s. After the 40th cycle, a final extension step was performed at 72 °C for 7 min. Components for 25µL PCR reactions were: 10 ng of DNA template,
40 pmoles of each primer, 10 mM Tris-HCl (pH 8.3), 50 mM KCl, 2 mM MgCl2, 0.1 mM of each dNTP (dGTP,
dCTP, dATP and dTTP) and 1 unit ofTaqDNA polymer-ase (Invitrogen, Carlsbad, CA, USA). Negative controls (no DNA template) were included in every experiment. The amplification reaction was performed in a thermocycler PTC - 100 (MJ Research, Inc., Waltham, MA, USA). After amplification, DNA products were separated by electro-phoresis in a 1.5% (w/v) agarose gel immersed in TBE buffer (90 mM Tris-borate, 2 mM EDTA, pH 8.0) or pre-cipitated for RFLP analysis. Precipitation was done by add-ing 100 mM NaCl and 2.5 volumes of absolute ethanol. Samples were kept at -20 °C for 2 h and centrifuged at 12,000 x g for 30 min. The pellet was washed with 70% (v/v) ethanol, re-suspended in 10µL of water and digested
with different restriction enzymes. The DNA fragments were size-fractionated in 2% (w/v) agarose gel, stained with ethidium bromide (0.5µg/mL) and photographed
un-der UV light, either with a Polaroid camera or the images were captured and stored using the Eagle Eye II photo-documentation system (Stratagene, La Jolla, CA, USA).
Data analysis
After restriction with endonucleases the amplifica-tion products were scored as 1 (presence) or 0 (absence) of a restriction site and used for determining genetic distances between the isolates (Nei and Li, 1979). These distances were used to cluster the isolates by the unweighted pair group method with averages (UPGMA) method using the Statistica program (version 4.5 for Windows, StatSoft, Inc. 1993, Tulsa, OK, USA).
Results
The internal transcribed spacer (ITS) of the rDNA re-gion of 26 isolates belonging to 8 genera of ectomy-corrhizal fungi showed extensive length polymorphism (Figure 1), PCR amplification with specific primers for the ITS region generated bands ranging from 560 to 750 bp. Figure 1 shows that all but two species (Suillus brevipes
andHebeloma cylindrosporum) presented only one ampli-fication product. No difference was detected between the 11Rhizopogonisolates analyzed, while the amplification patterns for all threeSuillusspecies were quite distinct. No polymorphism was observed within the threeLaccaria spe-cies nor between the twoCenococcum geophilumisolates, although polymorphism was observed between the two
Sclerodermaisolates.
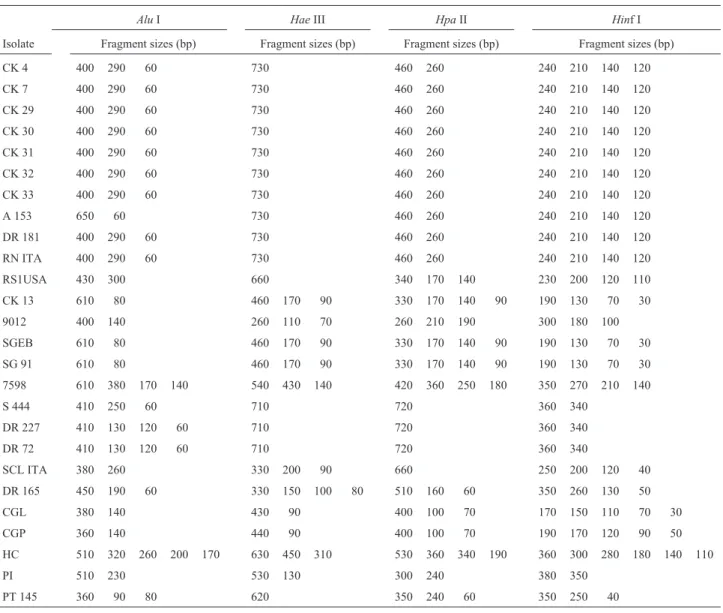
To detect a wider range of polymorphisms, the PCR products were cleaved with the restriction enzymesAluI,
HaeIII,Hinf I, andHpaII (Table II). Figure 2 shows the re-striction patterns obtained withAluI. However, restriction patterns with all these enzymes could not distinguish be-tween the nineRhizopogonisolates and for this reason the PCR products from these isolates were further cleaved with three other enzymes (AvaII,MboI, andTaqI) but still no polymorphism was detected. Only two of these isolates, be-longing to the speciesR. subcaerulescens(RS1USA) and
R. vinicolor(A 153), showed different patterns compared to the others.R. subcaerulescensshowed a distinct pattern with all three enzymes andR. vinicolor, with enzymesAluI and Ava II. All other species, except L. bicolor and L. amethystea, could be identified by at least one restriction enzyme pattern.
Restriction fragments obtained with all the endo-nucleases tested were used to determine genetic distances between the genotypes and cluster them into specific groups (Figure 3). In general, isolates grouped according to their genus,e.g. Rhizopogon,Laccaria, and Cenococcum
isolates were clustered into three distinct groups. However,
Figure 2- Gel electrophoresis of the amplified rDNA internal transcribed sequence (ITS) region of 26 ectomycorrhizal fungal isolates digested with the AluI restriction enzyme. Lanes are numbered according to the isolate identification scheme given in Table I. Size markers (pUC 19 digested withHinf I andRsaI) are indicated by M.
Table II- Restriction fragments (pair bases) of the internal transcribed spacer (ITS) rDNA amplified regions of ectomycorrhizal fungi isolates produced by different restriction enzymes.
AluI HaeIII HpaII Hinf I
Isolate Fragment sizes (bp) Fragment sizes (bp) Fragment sizes (bp) Fragment sizes (bp)
CK 4 400 290 60 730 460 260 240 210 140 120
CK 7 400 290 60 730 460 260 240 210 140 120
CK 29 400 290 60 730 460 260 240 210 140 120
CK 30 400 290 60 730 460 260 240 210 140 120
CK 31 400 290 60 730 460 260 240 210 140 120
CK 32 400 290 60 730 460 260 240 210 140 120
CK 33 400 290 60 730 460 260 240 210 140 120
A 153 650 60 730 460 260 240 210 140 120
DR 181 400 290 60 730 460 260 240 210 140 120
RN ITA 400 290 60 730 460 260 240 210 140 120
RS1USA 430 300 660 340 170 140 230 200 120 110
CK 13 610 80 460 170 90 330 170 140 90 190 130 70 30
9012 400 140 260 110 70 260 210 190 300 180 100
SGEB 610 80 460 170 90 330 170 140 90 190 130 70 30
SG 91 610 80 460 170 90 330 170 140 90 190 130 70 30
7598 610 380 170 140 540 430 140 420 360 250 180 350 270 210 140
S 444 410 250 60 710 720 360 340
DR 227 410 130 120 60 710 720 360 340
DR 72 410 130 120 60 710 720 360 340
SCL ITA 380 260 330 200 90 660 250 200 120 40
DR 165 450 190 60 330 150 100 80 510 160 60 350 260 130 50
CGL 380 140 430 90 400 100 70 170 150 110 70 30
CGP 360 140 440 90 400 100 70 190 170 120 90 50
HC 510 320 260 200 170 630 450 310 530 360 340 190 360 300 280 180 140 110
PI 510 230 530 130 300 240 380 350
as shown in Figure 3, oneRhizopogon(RS1USA) and two
Suillus(7598 and 9012) isolates were clustered in groups distinct from those specific for their genera and each of the twoSclerodermaisolates formed a separate group.
The rDNA ITS region of ectomycorrhizae amplified successfully with the ITS1/ITS4 primer pair, the electro-phoretic pattern of the amplification products showing two bands (Figure 4).
Discussion
Detection of polymorphism using PCR-RFLP analy-ses of the rDNA ITS region has been successfully used for identifying several species of fungi (Amicucciet al., 1996). This simple technique requires only minute amounts of DNA and two specific primers flanking the ITS region. We found that the amplification products for the ITS region of 26 isolates of ectomycorrhizal fungi collected in Brazil, the United States and France ranged from 560 to 750 bp, coin-ciding with the sizes obtained for other ectomycorrhizal fungi (Gardeset al., 1991; Kárenet al., 1997). Despite the length polymorphism observed for many of the isolates, ITS analysis alone was not able to separate all the geno-types, the exceptions being S. brevipes and H. cylindrosporumwhich presented two amplification prod-ucts allowing their identification in relation to the other iso-lates (Figure 1). These two bands may be due to either
polymorphism within the rDNA repetitive unit or the pres-ence in the same isolate of more than one nucleus bearing different rDNA sequences (Sanderset al., 1996).
A low degree of ITS region intraspecific polymor-phism in ectomycorrhizal fungi has been reported by other authors (Gardeset al., 1991; Erlandet al., 1994). Accord-ing to Karénet al.(1997) ITS region intraspecific polymor-phism varies among different genera and species, although no general conclusion can be drawn due to the small num-ber of genera and species analyzed.
On the other hand, length polymorphism analysis of the ITS region followed by endonuclease restriction was sufficient to categorize most of the 26 isolates studied by us and place them in their correct species (Figure 2). RFLP analysis of the ITS region has been suggested by several au-thors as a means for discriminating between ectomy-corrhizal fungi at species level (Gardeset al., 1991; Bruns
et al., 1991). At genus level, ITS region fragment length polymorphism separated the 26 isolates into their 8 genera with any of the enzymes used.
Cleavage of the ITS region withAluI (Figure 2) al-lowed differentiation of 12 out of the 19 species studied. However, none of the restriction enzymes produced a dis-tinct pattern for fiveRhizopogonspecies (R. nigrescens,R. reaii,R. roseolus,R. rubescens, andRhizopogonsp.) and twoLaccariaspecies (L. bicolorandL. amethystea).
Martinet al.(1998) analyzed the nuclear rDNA ITS region ofRhizopogon, in order to reexamine its present tax-onomic classification in terms of the presence of specific DNA polymorphisms, and found that, based on both gel electrophoresis of digested PCR products and previous morphological observations, the five different species rep-resent only one species,R. villosulus.
Cleavage of the ITS region ofPisolithus tinctorius
isolate PT 145 resulted in the same DNA fragment pattern presented by otherPisolithus isolates collected in Brazil (Gomes et al., 1999). Indeed, cluster analysis based on RAPD-PCR analysis grouped the Brazilian isolates, while
Figure 3- Unweighted pair group method with averages (UPGMA) clus-ter diagram of the relationships between 26 ectomycorrhizal fungi iso-lates. The dendrogram was based on genetic similarity coefficients determined by the presence and absence of rDNA internal transcribed se-quence (ITS) region restriction enzyme patterns.
isolates collected in the USA and France have been shown to be quite distinct (Junghanset al., 1998).
The two bands observed by us on the PCR amplified ITS region of ectomycorrhizae correspond to plant and fungi patterns, this result confirming that ITS1/ITS4 prim-ers are not fungi specific (Paolocci et al., 1995 and Amicucci et al., 1996). However, in some cases, heterologous DNA from the plant material did not interfere with PCR amplification (Gardeset al., 1991; Henrionet al., 1992; Erland, 1995). Glenet al. (2001b) tested six primers pairs (targeting three nuclear and three mitochondrial re-gions) for specificity, sensitivity and species discrimination on identified collections of fungi. Two sets of these prim-ers, one newly designed and targeting the ITS region and the other amplifying a ribosomal DNA fragment of the large mitochondrial subunit met the requirements of high specificity and sensitivity, amplifying DNA from a broad range of the larger basidiomycetes, with no amplification of plant, bacterial or ascomycete DNA. These specific primers discriminated fungi to species level for 91 fungal species from 28 families and are a potential practical PCR-RFLP tool for identifying basidiomycetes in plants from field samples.
The results outlined in this paper show that while interspecific variation of the ectomycorrhizal fungi ITS re-gion is relatively high, intraspecific variability is very lim-ited and that ITS restriction fragment analysis has potential for developing species-level markers for many, but not nec-essarily all, ectomycorrhizal fungi species. It appears that ITS-RFLP is a potent tool for the taxonomic study of ectomycorrhizal fungi, with the minute amounts of DNA required and the high reproducibility of this procedure making it an ideal method both for studying population het-erogeneity in the field and the identification and monitoring of specific strains introduced into the soil in controlled mycorrhization programs.
Acknowledgments
This project was supported by grants from the Brazil-ian agencies FNDCT/FINEP, CNPq and FAPEMIG.
References
Allen MF (1991) The ecology of mycorrhizae. Cambridge Uni-versity Press, Cambridge.
Amicucci A, Rossi I, Potenza L, Zambonelli A, Agostini D, Palma F and Stocchi V (1996) Identification of ectomycorrhizae from Tuber species by RFLP analysis of the ITS region. Biotechnol Lett 18:821-826.
Bruns TD, White TJ and Taylor JW (1991) Fungal molecular sys-tematics. Annu Rev Ecol Syst 22:525-564.
De la Bastide, PY, Kropp BD and Piché Y (1995) Mechanisms for the development of genetically variable mycorrhizal in the ectomycorrhizal fungus Laccaria bicolor. Appl Environ Microbiol 61:3609-3616.
Egger KN (1995) Molecular analysis of ectomycorrhizal fungal communities. Can J Bot 73:1415-1422.
Erland S (1995) Abundance of Tylospora fibrilosa ectomycorhizas in a South Swedish spruce forest measured by RFLP analysis of the PCR-amplified rDNA ITS region. Mycol Res 99:1425-1428.
Erland S, Henrion B, Martin F, Glover LA and Alexander IJ (1994) Identification of the ectomycorrhizal basidiomycete Tylospora fibrillosa Donk by RFLP analysis of the PCR-amplified ITS and IGS regions of ribosomal DNA. New Phytol 126:525-532.
Farmer DJ and Sylvia DM (1998) Variation in the ribosomal DNA internal transcribed spacer of a diverse collection of ectomy-corrhizal fungi. Mycol Res 102:859-865.
Gardes M and Bruns TD (1996) Community structure of ectomy-corrhizal fungi in aPinus muricataforest: above- and be-low-ground views. Can J Bot 74:1572-1583.
Gardes M, White TJ, Fortin JA, Bruns TD and Taylor JW (1991) Identification of indigenous and introduced symbiotic fungi in ectomycorrhizae by amplification of nuclear and mito-chondrial ribosomal DNA. Can J Bot 69:180-190.
Glen M, Tommerup IC, Bougher NL and O’Brien PA (2001a) Interspecific and intraspecific variation of ectomycorrhizal fungi associated withEucalyptusecosystems as revealed by ribosomal DNA PCR-RFLP. Mycol Res 105:843-858. Glen M, Tommerup IC, Bougher NL and O’Brien PA (2001b)
Specificity, sensitivity and discrimination of primers for PCR-RFLP of larger basidiomycetes and their applicability to identification of ectomycorrhizal fungi inEucalyptus for-ests and plantations. Mycol Res 105:138-149.
Gomes EA, Barros EG, Kasuya MCM and Araújo EF (1999) Mo-lecular characterization ofPisolithusspp. isolates by rDNA PCR-RFLP. Mycorrhiza 8:197-202.
Henrion B, Chevalier G and Martin F (1994) Typing truffle by PCR amplification of the ribosomal DNA spacers. Mycol Res 98:37-43.
Henrion B, Le Tacon F and Martin F (1992) Rapid identification of genetic variation of ectomycorrhizal fungi by amplifica-tion of ribosomal RNA genes. New Phytol 122:289-298. Hillis DM and Dixon Mt (1991) Ribosomal DNA: molecular
evo-lution and phylogenetic inference. The Quat Rev of Biol 66:411-453.
Junghans DT, Gomes EA, Guimarães WV, Barros EG and Araújo EF (1998) Genetic diversity of the ectomycorrizal fungus Pisolithus tinctoriusbased on RAPD-PCR analysis. Mycor-rhiza 7:243-248.
Karén O, Hogberg N, Dahlberg A, Jonsson L and Nylund J-E (1997) Inter- and intraspecific variation in the ITS region of rDNA of ectomycorrhizal fungi in Fennoscandia as detected by endonuclease analysis. New Phytol 136:313-325. Martin MP, Högberg N and Nylund J-E (1998) Molecular
analy-sis confirms morphological reclassification ofRhizopogon. Mycol Res 102:855-858.
Marx DH (1969) The influence of ectotrophic mycorrhizal fungi on the resistance of pine roots to pathogenic infections. I. Antagonism of mycorrhizal fungi to root pathogenic fungi and soil bacteria. Phytopathology 59:153-163.
Nei M and Li WH (1979) Mathematical model for studying ge-netic variation in terms of restriction endonucleases. Proc Nat Acad Sci USA 76:5269-5273.
Paolocci F, Angelini P, Cristofari E, Granetti B and Arcioni S (1995) Identification of Tuber spp. and corresponding ectomycorrhizae through molecular markers. J Sci Food Agric 69:511-517.
Sanders IR, Justin PC and Wiemken AW (1996) The genetic di-versity of arbuscular mycorrhizal fungi in natural ecosys-tems - a key to understanding the ecology and functioning of the mycorrhizal symbiosis. New Phytol 133:123-134
Schäfer C and Wöstemeyer J (1992) Random primer dependent PCR differentiates aggressive from non-aggressive isolates of the oilseed rape pathogenPhoma lingam(Leptosphaeria maculans). J Phytopathology 136:124-136.
Smith SE and Read DJ (1997) Mycorrhizal symbiosis. 2 ed. Aca-demic Press, London.