Fast Monitoring of Indoor Bioaerosol
Concentrations with ATP Bioluminescence
Assay Using an Electrostatic Rod-Type
Sampler
Ji-Woon Park1, Chul Woo Park2, Sung Hwa Lee2, Jungho Hwang1*
1School of Mechanical Engineering, Yonsei University, Seoul, Republic of Korea,2HAE Research and Development Center, LG Electronics, Seoul, Republic of Korea
*hwangjh@yonsei.ac.kr
Abstract
A culture-based colony counting method is the most widely used analytical technique for monitoring bioaerosols in both indoor and outdoor environments. However, this method requires several days for colony formation. In this study, our goal was fast monitoring (Sam-pling: 3 min, Detection:<1 min) of indoor bioaerosol concentrations with ATP biolumines-cence assay using a bioaerosol sampler. For this purpose, a novel hand-held electrostatic rod-type sampler (110 mm wide, 115 mm long, and 200 mm tall) was developed and used with a commercial luminometer, which employs the Adenosine triphosphate (ATP) biolumi-nescence method. The sampler consisted of a wire-rod type charger and a cylindrical col-lector, and was operated with an applied voltage of 4.5 kV and a sampling flow rate of 150.7 lpm. Its performance was tested usingStaphylococcus epidermidiswhich was aerosolized with an atomizer. Bioaerosol concentrations were measured using ATP bioluminescence method with our sampler and compared with the culture-based method using Andersen cascade impactor under controlled laboratory conditions. Indoor bioaerosol concentrations were also measured using both methods in various indoor environments. A linear correla-tion was obtained between both methods in lab-tests and field-tests. Our proposed sampler with ATP bioluminescence method may be effective for fast monitoring of indoor bioaerosol concentrations.
Introduction
Bioaerosol monitoring is useful for controlling air quality, assessing exposure in health risk evaluation studies, identifying emission sources, and estimating the performance of air clean-ing devices. Exposure to bioaerosols can affect human health by causclean-ing infectious diseases, acute toxic reactions, and allergies [1–4]. A culture-based colony counting method is the most widely used analytical technique for monitoring bioaerosols in both indoor and outdoor envi-ronments [5–7]. However, this method requires several days for colony formation, which is
OPEN ACCESS
Citation:Park J-W, Park CW, Lee SH, Hwang J (2015) Fast Monitoring of Indoor Bioaerosol Concentrations with ATP Bioluminescence Assay Using an Electrostatic Rod-Type Sampler. PLoS ONE 10(5): e0125251. doi:10.1371/journal.pone.0125251
Academic Editor:Miguel Lopez-Ferber, Ecole des Mines d'Alès, FRANCE
Received:December 23, 2014
Accepted:March 22, 2015
Published:May 7, 2015
Copyright:© 2015 Park et al. This is an open access article distributed under the terms of the
Creative Commons Attribution License, which permits unrestricted use, distribution, and reproduction in any medium, provided the original author and source are credited.
Data Availability Statement:All relevant data are within the paper and its Supporting Information files.
Funding:This work was supported by BioNano Health-Guard Research Center funded by the Ministry of Science, ICT & Future Planning (MSIP) of Korea as Global Frontier Project (Grant Number H-GUARD_2013M3A6B2078959) The funders had no role in study design, data collection and analysis, decision to publish, or preparation of the manuscript.
one of its most serious limitations [8,9]. In addition, the culture-based method is only applica-ble to culturaapplica-ble microbes that can divide at a sufficient rate to form colonies. Therefore, this method could underestimate the number of cells due to the presence of viable but non-cultur-able (VBNC) cells which can proliferate under certain conditions.
Previous studies have reported the feasibility of rapidly quantifying (or identifying) bioaero-sols using airborne particle fluorescence spectrometry, pyrolysis-gas chromatography-ion mobility spectrometry (Py-GC-IMS), or bioaerosol mass spectrometry (BAMS) [10–14]. In-struments in which these techniques are used typically are either difficult to operate or expen-sive. With increasing concerns about biological contamination of indoor environments, a bioaerosol device that monitors indoor air quality needs to be developed for use in situ.
Adenosine triphosphate (ATP) bioluminescence is an available and affordable solution for rapidly monitoring bioaerosols in various environments. This assay uses ATP, which plays a central role as an intermediate carrier of chemical energy and links catabolism to biosynthesis within microbial cells. In the ATP assay, firefly luciferase catalyzes a reaction between luciferin and ATP, which causes luciferin to become excited and emit photons with a peak intensity in the 500 nm range as it returns to its ground energy level state [15]. Since the intensity of the light produced is directly proportional to the ATP content (which is proportional to biomass), it is possible to quantify the microbial biomass (the total amount of biological material derived from living, or recently living organisms) by measuring the ATP content using biolumines-cence [16].
ATP assay-based methods have been employed to a limited extent for bioaerosol exposure monitoring in workplaces and confined environments [16]. Stewart et al. [17] used ATP-based assays for rapid enumeration of bioaerosols under controlled temperature and humidity condi-tions. Bioaerosols were sampled and dispersed into a sterile phosphate-magnesium buffer, and then measured using the ATP bioluminescence method. They were able to estimate bioaerosol numbers using this method within 2.5 h. Lee et al. [18] developed a biosensor to detect ATP from hydrosolized test bacteria using an aerosol condensation system, a microfluidic channel, and an ATP bioluminescence transducer. This sensor could determine the existence of bioaero-sols within 10 min. Seshadri et al. [16] applied the ATP bioluminescence method to character-ize the performance of bioaerosol sampling devices. The analytical time for this method was under 1 h. Yoon et al. [19] estimated the efficacies of air controlling devices in situ using ATP bioluminescence in combination with an inertial impactor. The bioaerosol concentration was estimated within 25 min using this method. Park et al. [20] used corona-generated air ions for cell-lysis to detect the ATP content of indoor bioaerosols. The total time required for sampling, cell-lysis, and bioluminescence detection was 40 min.
Swab-based commercial luminometer has been used to detect microbial contamination of solid and liquid specimens using ATP bioluminescence. InS1 Information, details of the swab-based luminometer are stated. In order to use this commercial luminometer to measure air-borne microbial contamination, aerosol sampling is needed. Among various aerosol sampling technologies, the use of electrostatic sampling is increasing [21]. In an electrostatic sampler, airborne particles are electrically charged and then removed from the air stream by an electrical field. Sampling of airborne particles by electrostatic samplers has been widely studied from both theoretical and practical points of view, owing to its widespread practical applications. Mainelis et al. [22] suggested an electrostatic precipitator for bioaerosol collection. In their de-vice, incoming biological particles are charged by two ionizers and then deposited onto a growth medium (agar) by an electrical field. Han et al. [23,24] designed their electrostatic sam-pler with a super hydrophobic collection channel and half cylinder-shaped ground electrodes to collect bioaerosols into small amounts of liquids. They adapted the ATP bioluminescence method in order to analyze collection efficiency and the concentration rates of the sampler additional role in the study design, data collection and
[25]. Miller et al. [26] developed a hand-held electrostatic precipitator for bioaerosol sampling. They designed a point-to-plane electrostatic precipitator particle sampler that used a TEM grid or metallic foil substrate as the collecting plate. Tan et al. [21] designed an automated electro-static sampler with the capability to integrate with other real-time biosensor devices. The sam-pler was designed using a half-ball shaped steel electrode. Roux et al. [27] suggested a single stage electrostatic sampler for the efficient collection of microorganisms at a flow rate of 100 lpm.
In this study, our goal was fast monitoring of indoor bioaerosol concentrations with ATP bioluminescence assay using a bioaerosol sampler. A novel electrostatic sampler was designed to be easily combined with the commercial swab-based type luminometer. The sampler was field portable (pump-less, small, and light) and had fast sampling capabilities. Laboratory and field tests in various indoor environments were carried out using our sampler.
Materials and Method
Preparation of test bacterial suspension
In this study,Staphylococcus epidermidiswas used for the performance test. ISO 14698–1 sug-gests thatS.epidermidisis a suitable strain for testing the biological efficiency of air samplers used for counting airborne microbes. A bacterial suspension ofS.epidermidis(ATCC 14990) was prepared by culturing 0.1 mL of an overnight culture inoculated in 15 mL of a nutrient broth for 24 h at 37°C. The nutrient broth was prepared by dissolving 5 g of peptone and 3 g of meat extract in 1000 mL of sterile deionized water. The solution was sterilized in an autoclave. For bioaerosol generation, the prepared bacterial suspension was washed three times with ster-ile deionized water using a centrifuge (VS-1500N, Vision Scientific, Korea) at 6000 rpm (2697g) for 15 min to remove the residual particles, including the components of the nutrient broth.
Design of the sampler
The schematic of our electrostatic bioaerosol sampler is shown inFig 1. The sampler consists of a wire-rod corona charger and a cylindrical collector. During sampling, air enters the collec-tor through the wire-rod charger causing particles in the air to become positively charged. Next, the charged particles are collected on the collecting rod by an externally applied electric field. After sampling, the collecting rod is detached from the sampler and placed into a com-mercial swab holder (Lucipac W, Kikkoman, Japan). Therefore, the rod is used as a substitute of the swab stick used in a commercial swab-based type luminometer. Finally, the swab holder is placed into the measuring chamber of the ATP measuring device, where the relative light unit (RLU) value is displayed. InS2 Information, our design process of the sampler is stated in detail.
The charger consisted of four discharge wires (tungsten) and five ground rods (stainless steel) in parallel. In this study, the radii of the discharge wire (rw), the radii of the ground rod (rr), and the distance between the wire and the rod (d) were 20μm, 2 mm, and 3.98 mm,
re-spectively. The collector consisted of a collecting rod (stainless steel) and a cylindrical electrode (stainless steel). The collecting rod was designed to fit into a commercial swab holder. The radi-us and the length of the collecting rod were 2 mm and 100 mm, respectively. The distance be-tween the collecting rod and the cylinder electrode was 17 mm.
bioaerosols (ρs, #/m2) deposited on the collecting rod is expressed by the following equation
rs ¼NQZct
Ac
ð1Þ
whereNis the concentration of bioaerosols in the air,Qis theflow rate of the sampler,ηcis the collection efficiency,tis the sampling time, andAcis the surface area of the collecting rod. In order to increase the sampled cell density under constant sampling time and bioaerosol con-centration, the deposition velocity (Vc) defined below,
Vc¼
Nc
Nt ð2Þ
should be increased. Therefore, a higher samplingflow rate and/or a higher collection effi cien-cy results in a higher deposition velocity.
Performance test of the sampler
AerosolizedS.epidermidiswas used for performance test of the sampler. Performance tests of the sampler were carried out in a clean booth (Clean booth, Kumkang, Korea). Experimental setup of the performance tests are shown inFig 2. The bacterial suspension ofS.epidermidis was aerosolized using a Collison-type atomizer (9302, TSI Inc., USA). Compressed air from a dry-cleaned air supply system consisting of an oil trap, diffusion dryer, and high efficiency par-ticulate air (HEPA) filter was delivered to the atomizer. Dry-cleaned air at a flow rate of 3 lpm
Fig 1. Schematic of the sampler.
formed a high-velocity jet through an orifice in the atomizer. The flow rate was controlled by a valve and was measured by a mass flowmeter (MFM; model 4143, TSI Inc., USA). The pressure drop from the jet drew the bacteria solution up through a tube. The solution was then broken up into droplets by a high velocity air jet. The resultant larger droplets impinged on an impac-tor while the smaller droplets made no contact and formed an aerosol that exited through an outlet. The bioaerosols from the atomizer were passed through a diffusion dryer to remove hu-midity. The flow rate of air containing the bioaerosols was measured by a laminar flowmeter. After charge neutralization by a neutralizer (Soft X-ray charger 4530, HTC Co. Ltd., Korea), aerosolizedS.epidermidiswas diluted by clean air in the mixing zone of a test duct. The flow rate of the clean air was controlled by a fan attached at the end of the test duct and was mea-sured using an anemometer (Veloci Check, TSI Inc., USA) in front of the charger. The diluted bioaerosols were then charged by the charger (dilution ratio = 12.5–50). For total flow rates be-tween 56.5 and 150.7 lpm, the number concentrations after mixing with clean air were bebe-tween 35 and 2910 #/cm3.
Fig 2. Schematic diagram of the experimental setup for the performance tests of the sampler.
Fig 2Ashows the schematic diagram of the experimental set up for measuring the number of charges of a bioaerosol particle. At the exit of the charger, the bioaerosols were sampled by both an aerodynamic particle sizer (APS; model 3321, TSI Inc., USA) and an aerosol electrome-ter (model 3068B, TSI Inc., USA). The APS measures concentrations of particles with an aero-dynamic diameter between 0.5 and 20μm using a double-crest optical system. The sampling
flow rate was 5 lpm. The aerosol electrometer measures the total electrical charge carried by the bioaerosols and gaseous ions. The sampling flow rate of the electrometer was also 5 lpm. The average charge of a bioaerosol particle is defined as
navg¼
IIi
NceQ
ð3Þ
whereIis the electrical current of the charged particles and gaseous ions,Iiis the electrical cur-rent of the ions,Ncis the number concentration of the charged particles exiting the charger, andeis the charge of an electron.
The wall loss (L) of the charged bioaerosols in the charger was tested with the schematic shown inFig 2B. The penetration ratio is defined as
P¼1L¼Ncharger;on
Ncharger;off
ð4Þ
whereNcharger,offis the number concentration of bioaerosols when the power supplied to the charger is turned off, andNcharger,onis the number concentration of bioaerosols escaping from the charger when the power is being supplied to the charger (=Nc). These number concentra-tions were measured at the exit of the charger.
To determine the collection efficiency, bioaerosols were generated and charged with the same procedure as used in the charging test. At the exit of the collector, the bioaerosols were sampled by the APS (seeFig 2B). The collection efficiency can be defined experimentally as fol-lows:
Zc¼1
Nsampler;on
Nsampler;off
1
P ð5Þ
whereNsampler,offis the number concentration of bioaerosols when the power supplied to the charger and the collector are turned off (=N), andNsampler,onis the number concentration of charged bioaerosols escaping from the sampler when power is being supplied to the charger and the collector.
Laboratory test of bioaerosol detection
Laboratory tests of ATP bioluminescence assay with the sampler were carried out withS. epi-dermidisbioaerosols. Bioaerosols were sampled on the collecting rod for 10 s. After sampling, the collecting rod was put into the commercial swab holder, and then the sampled bioaerosols were mixed with the ATP-releasing reagent and the luminescent reagent. ATPs were extracted from the bioaerosols and light was emitted. The swab holder with the collecting rod was placed directly into the luminometer (Lumitestor, Kikkoman, Japan), and the light intensity was mea-sured to provide an RLU value.
The culture-based method was also performed to compare with the bioluminescence detec-tion method. A schematic of the experimental setup for the culture-based method is shown in
Fig 2C. A sixth stage of Andersen cascade impactor (TE-10-800, Tisch Environmental, USA)
sampler. The remaining 27.3 lpm of required flow was provided by clean air through a HEPA filter. The bioaerosols were sampled on a nutrient agar plate in the impactor for 10 s and then cultured in the incubator during 7 days at 30°C. After incubation, the colony forming units (CFU) were counted. Since colony superposition occurs when microbial particles impact the same spot through the same sieve hole, it is necessary to revise the enumerated colony data with the positive hole correction formula [28].
Field test of indoor bioaerosol detection
After laboratory tests, a prototype hand-held electrostatic sampler was fabricated for field tests.
Fig 3shows photos of our electrostatic sampler, which consists of a charger, a collector, a fan
(VD5010B12M, Trohito, China), a power supply (G50, EMCO, USA) and two lab-made con-trollers. The dimensions of the prototype are 110 × 115 × 200 mm in width, length, and height, respectively.
The prototype sampler was applied to detect indoor bioaerosols at various locations includ-ing an occupational office, a cafeteria in a university, a dininclud-ing room in a kindergarten, a class-room in a kindergarten, and an auditorium located in Seoul, Korea. The field test at each location was carried out on five different days. Each measurement was repeated three times. Temperature and relative humidity were 19.5–26.8°C and 22–43%, respectively. The sampler was located at a height of about 1 m in the middle of the test space. At the same time and loca-tion, the culture-based counting method using Andersen cascade impactor was carried out for comparison. A nutrient agar was used for a culture medium in the field test. The sampling time for both methods was 3 min.
Ethics Statement
The bioaerosol sampling was carried out at public places of our university. Therefore, specific permission was not required. The field studies did not involve endangered or protected species.
Fig 3. The prototype of our electrostatic sampler for bioaerosol detection; (a) Front view, (b) Top view, and (c) Side view.
Results and Discussion
Evaluation of the sampler
The corona discharge of the charger was generated from each discharge wire, resulting in the formation of positive ions, which moved along the electric field to a grounded rod. As the ap-plied voltage of the charger increased beyond the corona starting voltage of 3kV, the corona current gradually increased. The spark was triggered for applied voltages above 5 kV. The coro-na currents for various applied voltages were measured and the results are shown in Fig Ba in
S3 Information. In consideration of a stable operation, 4.5 kV was selected for the applied
volt-age of the charger. The avervolt-age charges ofS.epidermidisbioaerosols for different flow rates at an applied voltage of 4.5 kV are shown in Fig Bb inS3 Information. The average number of charges per particle decreased from 530 to 465 as the flow rate increased from 56.6 to 150.7 lpm. The penetration ratios (P) of the charger for different flow velocities and flow rates at an applied voltage of 4.5 kV are in Fig Bc inS3 Information. When the total flow rate was changed from 56.5 to 150.7 lpm, the penetration ratio was changed from 70% to 90%. Details of the re-sults are stated inS3 Information.
In this work, the applied voltage of the collector was chosen to be the same as that of the charger (4.5 kV), in order to simplify the design of a power pack.Fig 4shows experimental re-sults of collection efficiency and deposition velocity ofS.epidermidisbioaerosols at different
Fig 4. Collection efficiencies and deposition velocities for various flow rates (S. epidermidis, Applied voltage at the charger and the collector is 4.5 kV)
flow rates. The experimental results of the collection efficiency were in good agreement with the modified Deutsch-Anderson equation (See Eq. A inS2 Information) which was used for design of the collector.Fig 4also shows the relationship between flow rate and deposition ve-locity. Considering the penetration ratio (P) of the charger, the equation for deposition velocity Eq (2) was modified as follows:
Vc ¼
Q Ac
ZcP ð6Þ
As the flow rate increased, the collection efficiency decreased and the deposition velocity in-creased. Since the deposition velocity represents the number of bacteria captured in the collect-ing rod per unit time for a given test bacteria concentration, its maximum value of 0.336 m/s (corresponding to the maximum flow rate of 150.7 lpm) was chosen for this study. At this con-dition, the penetration ratio of the charger was 0.904 ± 0.050.
Laboratory test of bioaerosol detection
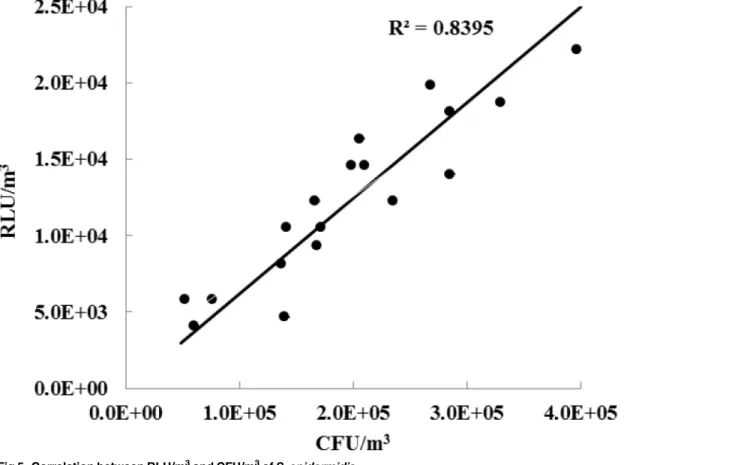
Fig 5shows the correlation between the RLU/m3ofS.epidermidisbioaerosols measured using
the ATP-based method with our sampler and the CFU/m3obtained by the culture-based meth-od using Andersen cascade impactor. The sampling flow rate, sampling time, and applied volt-age to the sampler were chosen to be 150.7 lpm, 30 s, and 4.5 kV respectively. The unit
Fig 5. Correlation between RLU/m3and CFU/m3ofS.epidermidis.
conversion from CFU to CFU/m3was made as follows:
½CFU=m3
¼½CFU
QitiZi
ð7Þ
whereQiis the samplingflow rate of the impactor,tiis the sampling time of the impactor, and
ηithe collecting efficiency of the impactor. The collecting efficiency of the impactor was 90.2% for 800 nm-sized particles. The experimental setup was stated inS4 Information.
Similarly, the unit conversion from RLU to RLU/m3was made as follows,
½RLU=m3
¼ ½RLU
PQtZcRr ð8Þ
wheretis the sampling time of our sampler,Rris the ratio between the length of the reaction part and the length of collecting rod (seeFig 1). For our setup,Rrwas 0.4. In our study, all bioaerosols collected on the reaction part of the collecting rod were assumed to react with re-agents in the swab holder. The concentrations measured using the culture-based method were (1.63 ~ 3.70) × 106CFU/m3, while the concentrations using the ATP-based method with the sampler were (1.02 ~ 2.12) × 105RLU/m3. Therefore, 1 RLU corresponded to 16.0 ± 4.4 CFU of aerosolizedS.epidermidiscells. In our previous study [19], 1 RLU corresponded to
27.5 ± 8.7 CFU of aerosolizedS.epidermidiscells. This discrepancy might be due to difference in the post-treatment methods used after sampling between the two experiments. Yoon et al. [19] sampled bioaerosols using an impactor and then manually swabbed the sampled area in the impactor using a swab stick. This is the suggested method when using a commercial swab-based type luminometer (seeS1 Information). However, in this study, sampled bioaerosols on the rod were directly exposed to bioluminescence reagents. Therefore, we believe that more ATPs were extracted and reacted in this study compared to the study by Yoon et al. [19].
Field test of indoor bioaerosol detection
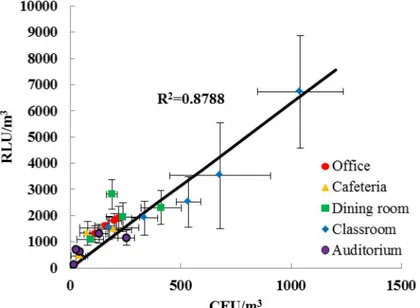
Fig 6shows the correlation between the RLU/m3of indoor bioaerosols measured using the
ATP-based method with our sampler and the CFU/m3measured by the culture-based method with the sixth stage of Andersen cascade impactor. Each data point represents an average value of RLU/m3as well as CFU/m3in a specific place and on a specific day. When the occupants in an indoor environment were more active, the bioaerosol concentrations and measurement er-rors (standard deviation values of RLU/m3and CFU/m3) were higher in both in the culture-based method and the ATP method.
In the results of our field tests, 1 RLU corresponded to 0.16 ± 0.05 CFU of indoor bioaero-sols; this value was very different compared to the correlation obtained in the laboratory test. We believe this difference is due to the presence of fungal spores and VBNC bioaerosols [19,
high in VBNC cells [33]. Therefore, they could significantly contribute to the RLU value but not to the CFU value.
Different indoor environments may contain various microorganisms with different ATP contents. However, it was interesting to note that the correlation (= RLU/CFU) did not differ significantly in the different indoor environments that we tested (seeFig 6). The reason for this might be related to typical strains of indoor bioaerosols. Mandal and Brandl [34] reviewed and summarized forty previous published studies carried out in field tests for indoor environments. They reported that the generaBacillus,Micrococcus,KocuriaandStaphylococcusare represen-tatives of typical bacterial strains found in indoor atmosphere. They also reported that fungal strains which are proportionally of importance in indoor air samples are comprised of the gen-eraAlternaria,Aspergillus,Cladosporium, andPenicillium.
Conclusions
A field portable bioaerosol sampler (110 mm wide, 115 mm long, and 200 mm tall) was devel-oped for use in fast monitoring (Sampling: 3 min, Detection<1 min) of indoor bioaerosols concentration. For this purpose, a novel hand-held electrostatic rod-type sampler was devel-oped and used with a commercial luminometer, which uses the ATP bioluminescence method. The sampler consisted of a wire-rod type charger and a cylindrical collector, and was operated with an applied voltage of 4.5 kV and a sampling flow rate of 150.7 lpm. A linear correlation of RLU/CFUffi6.3 was obtained between our method and the culture-based method in the field tests, even though the measurements were carried out in various indoor environments. Our proposed sampler with ATP bioluminescence method may be effective for fast monitoring of indoor bioaerosol concentrations.
Supporting Information
S1 Information. Test procedure using a commercial swab-based type luminometer.
(DOCX)
Fig 6. Correlation between the concentrations of indoor bioaerosol measured using ATP (RLU/m3) and culture-based (CFU/m3) methods in an occupational office, a cafeteria in a university, a dining room in a kindergarten, a classroom in a kindergarten, and an auditorium.
S2 Information. Design of the sampler.
(DOCX)
S3 Information. Evaluation of the sampler.
(DOCX)
S4 Information. Laboratory test of bioaerosol detection.
(DOCX)
Author Contributions
Conceived and designed the experiments: JWP CWP SHL JH. Performed the experiments: JWP CWP. Analyzed the data: JWP JH. Contributed reagents/materials/analysis tools: SHL JH. Wrote the paper: JWP JH.
References
1. Blatny JM, Reif BAP, Skogan G, Andreassen O, Høiby EA, Ask E, et al. (2008) Tracking airborne Legio-nellaandLegionella pneumophilaat a biological treatment plant. Environ. Sci. Technol. 42: 7360–
7367. PMID:18939571
2. Lee AKY, Chan CK, Fang M, Lau APS (2004) The 3-hydroxy fatty acids as biomarkers for quantification and characterization of endotoxins and Gram-negative bacteria in atmospheric aerosols in Hong Kong. Atmos. Environ. 38: 6307–6317.
3. Rule AM, Kesavan J, Sshwab KJ, Buckley TJ (2007) Application of flow cytometry for the assessment of preservation and recovery efficiency of bioaerosol samplers spiked with Pantoea agglomerans. Envi-ron. Sci. Technol. 41: 2467–2472. PMID:17438801
4. Terzieva S, Donnelly J, Ulevicius V, Grinshpun SA, Willeke K, Stelma GN, et al. (1996) Comparison of methods for detection and enumeration of airborne microorganisms collected by liquid impingement. Appl. Environ. Microb. 62: 2264–2272. PMID:8779564
5. Byeon JH, Park CW, Yoon KY, Park JH, Hwang J (2008) Size distributions of total airborne particles and bioaerosols in a municipal composting facility. Bioresource Technol. 99: 5150–5154. PMID: 17945486
6. Dong S, Yao M (2010) Exposure assessment in Beijing, China: biological agents, ultrafine particles, and lead. Environ. Monit. Assess. 170: 331–343. doi:10.1007/s10661-009-1236-7PMID:19904623 7. Lee T, Grinshpun SA, Martuzevicius D, Adhikari A, Crawford CM, Luo J, et al. (2006) Relationship
be-tween indoor and outdoor bioaerosols collected with a button inhalable aerosol sampler in urban homes. Indoor Air. 16: 37–47. PMID:16420496
8. Boulos L, Prévost M, Barbeau B, Coallier J, Desjardins R (1999) LIVE/DEADBacLight: application of a new rapid staining method for direct enumeration of viable and total bacteria in drinking water. J. Micro-biol. Meth. 37: 77–86.
9. Auty MAE, Gardiner GE, Mcbrearty SJ, O’sullivan EO, Mulvihill DM, Collins JK, et al. (2001) Direct in situ viability assessment of bacteria in probiotic dairy products using viability staining in conjunction with confocal scanning laser microscopy. Appl. Environ. Microb. 67: 420–425. PMID:11133474 10. Snyder AP, Tripathi A, Maswadeh WM, Ho J, Spence M (2001) Field detection and identification of a
bioaerosol suite by pyrolysis-gas chromatography-ion mobility spectrometry. Field Anal. Chem. Tech. 5: 190–204.
11. Agranovski V, Ristovski Z, Hargreaves M, Blackall PJ, Morawska L (2003) Performance evaluation of the UVAPS: influence of physiological age of airborne bacteria and bacterial stress. J. Aerosol Sci. 34:1711–1727.
12. Russell SC, Czerwieniec G, Lebrilla G (2005) Achieving high detection sensitivity (14 zmol) of biomo-lecular ions in bioaerosol mass spectrometry. Anal. Chem. 77: 4734–4741. PMID:16053283
13. Srivastava A, Pitesky ME, Steele PT, Tobias HJ, Fergenson DP, Horn JM, et al. (2005) Comprehensive assignment of mass spectral signatures from individual bacillus atrophaeus spores in matrix-free laser desorption/ionization bioaerosol mass spectrometry. Anal. Chem. 77: 3315–3323. PMID:15889924 14. Hentz NG (2013) Pharmaceutical Bioburden Testing. In: Michanel CF. editor. Encyclopedia of Industrial
15. Karl DM (1980) Cellular nucleotide measurements and applications in microbial ecology. Microbiol. Rev. 44: 739–796. PMID:7010116
16. Seshadri S, Han T, Krumins V, Fennell DE, Mainelis G (2009) Application of ATP bioluminescence method to characterize performance of bioaerosol sampling devices. J. Aerosol Sci. 40: 113–121. 17. Stewart IW, Leaver G, Futter SJ (1997) The enumeration of aerosolisedSaccharomyces cerevisiae
using bioluminescent assay of total adenylates. J. Aerosol Sci. 28: 511–523.
18. Lee SJ, Park JS, Im HT, Jung HI (2008) A microfluidic ATP-bioluminescence sensor for the detection of airborne microbes. Sensor. Actuat. B-Chem. 132: 443–448.
19. Yoon KY, Park CW, Byeon JH, Hwang J (2010) Design and application of an inertial impactor in combi-nation with an ATP bioluminescence detector for in situ rapid estimation of the efficacies of air control-ling devices on removal of bioaerosols. Environ. Sci. Technol. 44: 1742–1746. doi:10.1021/ es903437zPMID:20143821
20. Park CW, Park JW, Lee SH, Hwang J (2014) Real-time monitoring of bioaerosols via cell-lysis by air ion and ATP bioluminescence detection. Biosens. Bioelectron. 52: 370–383.
21. Tan M, Shen F, Yao M, Zhu T (2011) Development of an automated electrostatic sampler(AES) for bioaerosol detection. Aerosol Sci. Tech. 45: 1154–1160.
22. Mainelis G, Adhikari A, Willeke K, Lee S, Reponen T, Grinshpun SA (2002) Collection of airborne micro-organisms by a new electrostatic precipitator. J. Aerosol Sci. 33: 1417–1432.
23. Han T, Mainelis G (2008) Design and development of an electrostatic sampler for bioaerosols with high concentration rate. Aerosol Sci. Tech. 39: 1066–1078.
24. Han T, An HR, Mainelis G (2010) Performance of an electrostatic precipitator with superhydrophobic surface when collecting airborne bacteria. Aerosol Sci. Tech. 44: 339–348.
25. Han T, Nazarenko Y, Lioy PJ, Mainelis G (2011) Collection efficiencies of an electrostatic sampler with superhydrophobic surface for fungal bioaerosols. Indoor Air. 21: 110–120. doi:10.1111/j.1600-0668. 2010.00685.xPMID:21204982
26. Miller A, Frey G, King G, Sunderman C (2010) A handheld electrostatic precipitator for sampling air-borne particles and nanoparticles. Aerosol Sci. Tech. 44: 417–427.
27. Roux J, Kaspari O, Heinrich R, Hanschmann N, Grunow R (2013) Investigation of a new electrostatic sampler for concentrating biological and non-biological aerosol particles. Aerosol Sci. Tech. 47: 463–
471.
28. Andersen A. (1958) New sampler for the collection, sizing, and enumeration of viable airborne particles. J. Bacteriol. 17(5): 471–484
29. Thore A, Ansehn S, Lundin A, Bergman S (1975) Detection of bacteriuria by luciferase assay of adeno-sine triphosphate. J. Clin. Microbiol. 1(1): 1–8. PMID:1100645
30. Rakotonirainy MS, Heraud C, Lavédrine B (2003) Detection of viable fungal spores contaminant on documents and rapid control of the effectiveness of an ethylene oxide disinfection using ATP assay. Lu-minescence, 18(2): 113–121. PMID:12687632
31. Pasanen AL, Kujanpaa L, Pasanen P, Kalliokoski P, Blomquist G (1997) Culturable and total fungi in dust accumulated in air ducts in single-family houses. Indoor Air, 7: 121–127.
32. Tong Y (1999) iurnal distribution of total and culturable atmospheric bacteria at a rural site. Aerosol Sci. Tech. 30: 246–254.
33. Beumer RR, De Vries J, Rombouts FM (1992)Campylobacter jejuninon-culturable coccoid cells. Int. J. Food Microbiol. 15(1): 153–163.