Heterotic group formation in Psidium guajava L.
by artificiaL neuraL network
and discriminant anaLysis
Bianca Machado caMPoS2, alexandRe Pio Viana3, SilVana SilVa Red Quintal4, ciBelle degel BaRBoSa5, RogéRio FigueiRedo daheR6
abstract- the present study aimed at evaluating the heterotic group formation in guava based on quantitative descriptors and using artificial neural network (ANN). For such, we evaluated eight quantitative descriptors. Large genetic variability was found for the eight quantitative traits in the 138 genotypes of guava. The artificial neural network technique determined that the optimal number of groups was three. The grouping consistency was determined by linear discriminant analysis, which obtained classification percentage of the groups, with a value of 86 %. It was concluded that the artificial neural network method is effective to detect genetic divergence and heterotic group formation.
index terms: guava, genetic variability, multivariate analysis, heterotic group.
formação de grupos Hetróticos em Psidium guajava L.
peLas redes neurais artificiais
resumo- o presente estudo teve como objetivo avaliar a formação de grupos heteróticos na cultura da goiabeira com base em descritores quantitativos e utilizando uma técnica de bioinformática conhecida como redes neurais artificiais (RNA). Para tanto, foram avaliados oito descritores quantitativos. Foi encontrada ampla variabilidade genética para os oito caracteres quantitativos em 138 genótipos de goiabeira. a técnica de redes neurais artificiais determinou que o número ideal de grupos foi três. A consistência do agrupamento foi determinada via Análise Discriminante linear, obtendo-se assim percentagem de classificação dos grupos, com um valor de 86%. Foi concluído que a metodologia de redes neurais artificiais é eficiente para detectar a divergência genética e na formação de grupos heteróticos.
termos para indexação: goiaba, variabilidade genética, análise multivariada, grupos heteróticos.
1(Trabalho 258-14). Recebido em: 23-09-2014. Aceito para publicação em: 10-02-2015.
2eng. Ftal., M.Sc., uenF/ccta/lMgV, ceP 28015620, campos dos goytacazes, RJ- Brazil. e-mail: [email protected] 3eng. agro, d.Sc., Professor uenF/ccta/lMgV, ceP 28015620, campos dos goytacazes, RJ- Brazil. e-mail: [email protected] 4eng. agro, M. Sc., campos, RJ, uenF/ccta/lMgV, ceP 28015620, campos dos goytacazes, RJ- Brazil. e-mail: silvanared@ hotmail.com
5Ciência da Computação, Instituto Federal Fluminense - Campos dos Goytacazes, RJ- Brazil. E-mail: [email protected] 6eng. agro, d.Sc., Professor uenF/ccta/leag, ceP 28015620, campos dos goytacazes, RJ- Brazil. e-mail: [email protected]
introduction
Guava (Psidium guajava L.) belongs to the
Myrtacea family and is native to tropical america, with wide distribution in the region, from Mexico to Brazil. its fruit is considered quite nutritious and tasty and is characterized by high content of pectin, dietary fiber, minerals, essential amino acids and vitamin C (GONZÁLEZ et al. 2011).
Most commercial orchards are formed from seedlings grown from seeds, mainly due to the low cost of the seedlings. This type of propagation makes orchards very heterogeneous. In other words, orchards present high variability in the cultivated materials due to the seminal propagation (SANTOS et al. 2011). Differences can be found in various traits, including yield, color, size of fruits and pulp yield, etc.
hence, the evaluation of these segregating populations obtained from open pollination becomes an important strategy to obtain cultivars and to indicate parental combinations that produce progenies with maximum genetic variability, thus increasing the chances to obtain superior individuals.
Studies on genetic diversity are very important in plant breeding because they allow the differentiation of accessions and help in the identification of contrasting genotypes for the performance of promising crosses. they are important tools to identify possible groups with a higher degree of heterosis in future crosses, and to find sources of resistance to diseases. MELCHINGER and GUMBER (1998) defined a heterotic group “as a group of related or unrelated genotypes from the same or different populations, which display similar combining ability and heterotic response when crossed with genotypes from other genetically distinct germplasm groups. By comparison, the term heterotic pattern refers to a specific pair of two heterotic groups, which express high heterosis and consequently high hybrid performance in their cross.”
Due to its nonlinear structure, artificial neural networks can capture more complex characteristics, controlled for several genes, of the data, which is not always possible with traditional statistical techniques, like traditional analysis of variance. SUDHEER et al. (2003), considers that the greatest advantage of the artificial neural networks technology, compared to conventional methods, is that it does not require information about the physical processes of the system to be modeled. The use of artificial neural networks associated with classification methods is a promising alternative (SILVA et al. 2014;
SANT’ANNA et al. 2015), to plant breeding application and provide to heterotic group formation for the different species. These classifiers have the advantage of being non-parametric, requiring small samples for training (KAVZOGLU; MATHER 2003) and tolerating unbalanced data (BISPO 1995).
therefore, this study aimed to evaluate the feasibility of artificial neural networks to analyze the genetic divergence of Psidium guajava l, by proposing a classification and formation of divergent and heterotic groups from a database.
materiaL and metHods
experimental design and evaluated population
It was evaluated 138 genotypes of guava, that were developed from a cross between different female and male guava parents in different populations selected by PESSANHA et al (2011). Those parental were of highly production for the agronomical traits and quality fruit characteristics, like fruit weight between 250-342 g and content of soluble solids 0Brix among 9.10 - 11.00. The study was conducted in the experimental area of the Colégio Agrícola Antônio Sarlo, in Campos dos Goytacazes, with spacing of 1.5 m between plants and 3.0 m between rows, using random blocks.
The genotypes were planted in June 2009. The first formation pruning was held in December 2009 and fructification pruning, in September 2010. The harvest period occurred from February to april 2011. all plants received the treatments recommended for the culture, such as plant cultivation, fertilization, irrigation and the control of weeds, pests and diseases.
During the fruiting period, fruits with size of about 10 cm were bagged within polyethylene bags. Later, when the fruits reached maturity stage 1 and presented dark green skin, they were collected for further evaluation in the universidade estadual do Norte Fluminense Darcy Ribeiro (UENF) at the laboratory of genetic and Plant Breeding. ten fruits per plant were sampled for study on the characterization and evaluation of genotypes.
phenotype traits
acidity of the fruit), VIT C (content of vitamin C in the fruit).
The average fruit mass was obtained with the use of an electronic scale; the fruit length and the diameter were measured using a caliper. The pulp yield was calculated from the ratio between the fruit mass and the pulp mass. the content of soluble solids was determined with the aid of an Atago number 1 refractometer and the results were expressed in °Brix; fruit acidity was determined according to the method adopted by SANTOS et al. (2011) and the results were provided in percentage of citric acid per 100 g pulp. The ratio between the content of soluble solids and acidity was determined by the absolute value, and the content of vitamin C was obtained according to SANTOS et al. (2011), with results expressed in mg of ascorbic acid per 100 g of pulp.
Artificial Neural Network for the heterotic
groups
the study on genetic divergence among the genotypes of guava was carried out using the technique of artificial neural networks, according to a study conducted by BARBOSA et al. (2011). In that study, a computer program was implemented to assess genetic diversity among accessions of papaya
(Carica papaya L.), based on the Kohonen model
(KOHONEN 1982, YANG et al. 2000). Its greatest advantage is the fact that the Kohonen model does not require any initial theory for the organization of data, which makes it suitable for this study.
The Kohonen model is composed of an n
x m input matrix, where n refers to genotypes and
m, to input elements or characters which, together,
represent the input vector X, and of k output neuron, referring to the classes to which the genotypes can be grouped, determined as : n=138 genotypes, m=8 characters, k=3.
The number of groups was randomly defined and it is an adjustable parameter in the program developed. For a given input representing the traits of a genotype, only one output neuron should be active, thus recording the class to which the genotype belongs. The classes should group genotypes with similar traits. Thus, a classification per similarity of values is conducted.
The process consisted of finding the best neuron correspondence for similarity (winner) i (X) at time t, using the criterion of minimum distance between accessions. An input pattern to the artificial neural network, considering the average of genotypes, was expressed as:
xn = [ Xn1, Xn2,...,Xn8], = n = 1,2...,138
It was assumed that the weight of the synaptic vector representing the characteristic of the plant and of the group formed was randomly defined based on the input data, as follows:
Wk = [Wk1, Wk2, ...Wk8], K = 1,2,3.
The synaptic weight vector is the criterion for acceptance or rejection of a group of genotypes or plants.
The similarity between the input and the neuron was measured by the mean Euclidean distance between vectors Xn and Wk, calculated by
the formula (e01):
The output layer unit with the smallest average euclidean distance is considered the best. By using the index i (X) to identify the neuron most similar to the vector xn, known by the network at the moment, i (X) is expressed as:
i(X) = arg mink Xn - Wk
Then, the vectors of the synaptic weight of neurons were adjusted, according to the updating formula shown below.
Given the synaptic weight vector Wk (t) of the neuron k at time t, the update of the weight vector Wk (t +1) at time t +1 was defined by KOHONEN (1982) as:
Wk(t+1)=Wk(t)+h(t)(Xn- Wk(t))
which was applied to the winning neuron i, where η (t) is the learning rate parameter and must be variable in time, started with a value close to 0.1, which gradually decreased, but remained above.
the discriminant analysis proposed by (FISHER, 1936) aims to promote the best discrimination between individuals, placing them in their proper populations. This analysis allows classifying new genetic materials of unknown behavior in populations already known (CRUZ 2013).
resuLts and discussion
Heterotic group formation
The classification by artificial neural network based on eight quantitative traits in 138 genotypes is given in Table 01. Based on tests with different numbers of groups and the results of anderson’s discriminant analysis (Table 02), according to the percentage of correct classification of the proposed groups (table 03) , three groups were determined for the grouping, thereby ensuring the best classification and providing the distinction of their main traits.
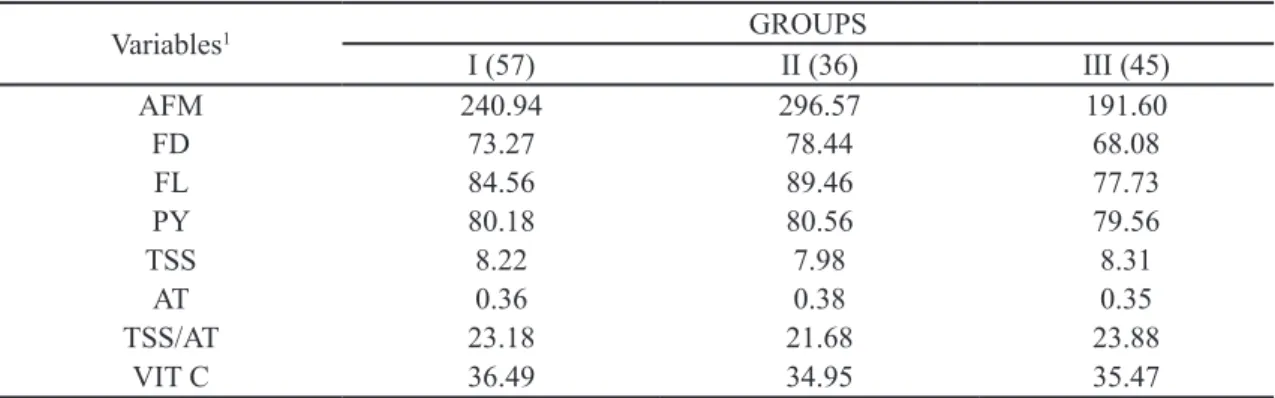
Group 1 consisted of 57 genotypes with the following averages: fruit mass average of 240.94 g; fruit diameter, 73.27 mm; fruit length, 84.56 mm; pulp yield of 80%; soluble solids, 8.22° Brix; acidity, 0.36 % of citric acid; ratio between the content of soluble solids and acidity equal to 23.18; and vitamin C with average of 36.49 mg of ascorbic acid/100 g. (Table 04).
Group 2 allocated 36 genotypes with the following averages: fruit mass average of 296.57 g; fruit diameter, 78.44 mm; fruit length, 89.46 mm; pulp yield, 80 %; content of soluble solids 7.98° Brix; acidity, 0.38 % of citric acid, ratio between the content of soluble solids and acidity equal to 21.68; and vitamin C with average of 34.95 mg of ascorbic acid/100 g.
Group 3 allocated 45 genotypes with the following averages: fruit mass average of 191.60 g; fruit diameter, 68.08 mm; fruit length, 77.73 mm; pulp yield, 79%; content of soluble solids, 31.8° Brix; acidity 0.35 % citric acid; ratio of soluble solids and acidity of 23.88; and vitamin C with an average of 35.47 mg of ascorbic acid/100 g.
For those groups we have genotypes obtained in different location, they were different selection made by local farms and the plants have been of high production, high quality traits for fruits and good local adaptation.
The use was only possible because it was known a priori in which group the genotypes would be allocated. Thus, the consistency of the cluster was determined by anderson’s discriminant analysis, as described by CRUZ (2013). Through artificial neural network, it was proposed the formation of three, seven and nine groups for allocating the genotypes; 86 % of the genotypes were classified correctly in the group defined, this classification was consistent with the measured variables and plant phenotypes observed in field experiments (Table 03 and 04).
the percentage of correct and incorrect classification of each group, detected by Anderson’s discriminant analysis, based on the classification
proposed by artificial neural network for three groups, as shown in Table 03, should be analyzed as follows: in the main diagonal line is the correct classification percentage for each group. All other fields refer to misclassification. To determine the percentage of misclassification of a particular group, it is necessary to analyze the respective lines. For example, according to the discriminant analysis, the artificial neural network classified 85 % of the genotypes correctly in group 1, while 8 % and 5 % of the genotypes were incorrectly allocated in groups 2 and 3, respectively.
BARBOSA et al. (2011) investigated an accession of Carica papaya l. and found an apparent error rate of 8 % when the accessions were grouped by the artificial neural network technique for the first harvest season; 8 % for the second harvest season; and 6 % for the average harvest seasons. These values were observed by using four groups for the classification accessions of papaya. According to the same authors, the discriminant function has demonstrated great potential to verify the consistency of the grouping proposed by the artificial neural network technique.
SUDRÉ et al. (2006) also found that Anderson’s discriminant function was adequate for the characterization and management of germplasm banks. It proved to be an additional tool to assess the correct classification provided by the multivariate analysis methods used.
MARIOT et al. (2008) studied accessions
of M. ilicifolia and M. aquifolium and found an
apparent error rate of 10 % when the accessions were grouped according to the Tocher method, which was considered adequate by the authors.
The best percentage for the classification of groups was found when three groups were formed, according to the artificial neural network, with a value of 86 %. BARBOSA et al. (2011) also achieved a better percentage for the formation of three groups, as proposed by the neural network with a value of 93 %, showing that the smaller the number of groups, the higher the reliability of the grouping.
The groups generated by the artificial neural network detected genetic divergence with the formation of heterotic groups, which facilitates the selection of divergent genotypes for breeding through the generation of hybrids, since they allow the selection of genotypes suitable for crosses between different heterotic groups. this procedure increases the chances of obtaining superior genotypes; we are already conducting field experiments that prove this situation.
of heterotic pools evaluated, apart from the chosen initial plant for made crosses (PESSANHA et al 2011), are important issues to be considered to any genetic diversity study using this technique.
Correlations for intra and intergroups were in agreement with MELCHINGER’S (1999) results involving many different studies. crosses among related genotypes, such as intragroup crosses, have a tight association between genetic distance and mid-parent heterosis for yield characters.
the possibility of selecting superior parents for the breeding programs in Psidium guajava l. was corroborated by DINESH and VASUGI, (2010), who found considerable genetic diversity within the species. SANTOS et al. (2011), detected genetic divergence among the 69 accessions analyzed.
the groups formed by the estimate of genetic divergence between the genotypes of the study population allow the use of sexual propagation, through the achievement of self-pollinating strains and/or new hybrids. It allows the selection of new crosses between divergent parents with better agronomic traits, which favors the occurrence of heterotic effect as well as the completion of the alleles in hybrid generation (MOHAMMADI; PRASANNA, 2003).
the concept of heterotic patterns includes the subdivision of the germplasm available in a hybrid breeding program in at least divergent groups for the different populations, which are improved with interpopulation selection. heterotic patterns have a strong impact in crop improvement because they predetermine to a large extent the type of germoplasm used in development breeding population, those
approach determine a breeding program over a long period of time (MELCHINGER; GUMBER, 1998).
However, according to BARBOSA et al. (2011) another alternative is to recommend promising genotypes for assessment in sets with other genotypes, so as to investigate the possibility of recommending them with new varieties. In other words, it is advisable not to consider individual genotypes alone, but involve a large number of genotypes, mainly those with agronomic traits of interest.
For the breeding guava program we have possibilities for the selection of new crosses, in order to exploit heterosis and allele diversity, the agronomic performance of genotypes should also be taken into account (number and weight of fruits and high quality traits). This should lead to a better allele complementation, resulting in improved genotype performance in future generations.
another possibility is to directly recommend promising genotypes (by cloning) for further evaluation together with other guava cultivars, to assess the possibility of their recommendation as new varieties.
nevertheless, management of germoplasm in genetically diverse heterotic groups still offers more advantages for breeding new populations than using divergent parental. Also, we have been using an alternative prediction technique, best linear unbiased prediction (BLUP) for segregant population performance (FERREIRA et al 2012), that could be more efficient than use in association than genetic distance measures, when referring to intergroup crosses.
tabLe 1- Genotypes of guava (Psidium guajava L.) grouped by the artificial neural network technique,
based on 8 quantitative traits and the formation of three heterotic groups. groups genotypes
1
4, 5, 9, 10, 12, 17, 18, 22, 24, 27, 32, 33, 35, 37, 38, 41, 45, 46, 47, 48, 49, 51, 53, 54, 56, 57, 60, 63, 66, 72, 73, 74, 75, 76, 77, 80, 82, 85, 87, 89, 91, 99, 101, 102, 103, 106, 109, 110, 111, 112, 113, 114, 124, 126, 128, 136, 138.
2 7, 16, 21, 26, 28, 29, 30, 39, 52, 55, 65, 68, 78, 79, 90, 92, 93, 94, 95, 96, 97, 98, 100, 104, 105, 107, 108, 119, 120, 121, 122, 123, 125, 127, 130, 132.
tabLe 2- Result of discriminant analysis, according to the percentage of correct classification of the heterotic groups proposed by the artificial neural network technique for Psidium guajava l. Number of groups of artificial neural network Percentage of correct classification of the groups
3 86 %
7 74 %
9 65 %
tabLe 3- Percentage of correct and incorrect classification of each heterotic group, obtained with the use of Anderson’s discriminant analysis (1958), based on the classification proposed by the artificial neural network technique in three groups, considering 8 quantitative traits evaluated in 138 genotypes of guava (Psidium guajava L.).
groups 1 2 3
1 85 % 8 % 5 %
2 8 % 91 % 0 %
3 15 % 0 % 84 %
Apparent error rate – 13 %
tabLe 4-Averages of the quantitative variables for the three heterotic groups formed with the use of the artificial neural network technique.
Variables1 gRouPS
I (57) II (36) III (45)
aFM 240.94 296.57 191.60
Fd 73.27 78.44 68.08
Fl 84.56 89.46 77.73
PY 80.18 80.56 79.56
tSS 8.22 7.98 8.31
at 0.36 0.38 0.35
tSS/at 23.18 21.68 23.88
Vit c 36.49 34.95 35.47
¹ AFM = average fruit mass; FD = transverse fruit diameter; FL =fruit length; PY= pulp yield; TSS = content of soluble solids; AT = fruit acidity; TSS/AT = ratio between the content of soluble solids and acidity; VIT C = content of ascorbic acid.
concLusion
The methodology of artificial neural networks proved to be both efficient in detecting genetic divergence between individuals evaluated for the eight quantitative traits.
Artificial neural networks in association with discriminant analysis were effective in promoting the formation of heterotic groups in guava.
acknowLedgements
To FAPERJ and CNPq, for their financial support to this experiment, and for the master scholarship granted to the first author.
references
BARBOSA, C.D.; VIANA, A.P.; QUINTAL, S.S.R.; PEREIRA, M.G. Artificial Neural Network Analysis of genetic diversity in Carica papaya l. crop
Breeding and Apllied Biotechnology, Viçosa, Mg,
v. 11, p. 224-231, 2011.
BiSPo, c.M. Neural networks for pattern
recognition. New York: Oxford University Press,
1995. 482p.
DINESH, M.R.; VASUGI, C. Guava improvement in india and future needs. Journal of Horticultural
Science, Ashford, v.5, p.94-108, 2010.
FERREIRA, R.T.; VIANA, A.P.; BARROSO, D.G.; AMARAL JÚNIOR, A.T. Genetic diversity in australian cedar genotypes selected by mixed models. Ciência e Agrotecnologia, lavras, v. 36, n.2, p.171-179, 2012.
FiSheR, R.a. the use of multiple measurements in taxonomic problems. Annals of Eugenics, london, v.7, p.179-188, 1936.
GONZÁLEZ, I.A.; OSORIO, C.; MELÉNDEZ-MARTÍNEZ, A.J.; GONZÁLEZ-MIRET, M.L.; heRedia, F.J. aplication of tristimulus colorimetry to evaluate color changes during the ripening of Colombian guava (Psidium guajava L.) varieties with
different carotenoid pattern. international Journal
of Food Science and Technology, oxford, v.46,
p.840-848, 2011.
KAVZOGLU, T.; MATHER, P.M. The use of backpropagation artificial neural networks in land cover classification. International Journal of remote sensing, London, v.24, p.4907-4938, 2003.
KOHONEN, T. Self-organized formation of topologically correct feature maps. Biological
Cybernetics, Berlin, v.43, p.59-69, 1982.
MARIOT, M.P.; BARBIERI, R.L.; SINIGAGLIA, C.; RIBEIRO, M.V. Variability in matrices of espinheira-santa accessions. Ciência Rural, Santa Maria, v.38, p.351-357, 2008.
MELCHINGER, A.E.; GUMBER, R.K. Overview of heterosis and heterotic group in agronomic crops. In LAMKEY, K.R.; STAUB, J.E. (Ed.). Concepts and breeding of heterosis in crop plants. Madison: ACSESS, 1998. p. 29-44.
MelchingeR, a.e. genetic diversity an heterosis. In: Coors JG and Pandey S (Ed.). Genetic and
exploitation of heterosis in crops. Madison:
ACSESS, 1999. p. 99-118.
MOHAMMADI, S.A.; PRASANNA, B.M. Analysis of genetic diversity in crop plants: salient statistical tools and considerations. Crop Science, Madison, v.432, p.1235-1248, 2003.
PESSANHA, P.G. de O.; VIANA, A.P.; AMARAL JÚNIOR, A.T.; SOUZA, R.M.; TEXEIRA, M.C.; PeReiRa, M.g. avaliação da diversidade genética em acessos de Psidum ssp.Via marcadores RaPd.
Revista Brasileira de Fruticultura, Jaboticabal, v. 33, n. 1, p. 129-136, 2011.
SANT’ANNA, I.C.; TOMAZ, R.S.; SILVA, G.N.; NASCIMENTO, M.; BHERING, L.L., CRUZ, C.D. Superiority of artificial neural networks for a genetic classification procedure. Genetics and Molecular Research, Ribeirão Preto, v.14, n.3, p. 9898-9906, 2015.
SANTOS, C.A.F.; CÔRREA, L.C.; COSTA, S.R. genetic divergence among Psidium accessions based on biochemical and agronomic variables. crop
Breeding and Applied Biotechnology, londrina,
v.11, p.149-156, 2011.
SILVA, N.S.; TOMAZ, R.S.; SANT’ANNA, I.C.; NASCIMENTO, M.; BHERING, L.L., CRUZ, C.D. Neural networks for predicting breeding values and genetics gains. Scientia Agricola, Piracicaba, v.71, n.6, p. 494-498, 2014.
SUDHEER, K.P.; GOSAIN, A.K.; RAMASASTRI, K.S. Estimating actual evapotranspiration from limited climatic data using neural computing technique. Journal of Irrigation and Drainage engineering, New York, v.129, p.214-218, 2003.
SUDRÉ, C.P.; CRUZ, C.D.; RODRIGUES, R.; RIVA, E.M.; AMARAL JUNIOR, A.T.; SILVA, D.J.H.; PEREIRA, T.N.S. Multicategoric variables for determining the genetic divergence among sweet and chilli peppers. Horticultura Brasileira, Brasília, v.24, 88-93, 2006.
YANG, C.C.; PRASHER, S.O.; LANDRY, J.A.; RAMASWAMY, H.S.; DITOMMASO, A. Application of artificial neural networks in image recognition and classification of crop and weeds.
Canadian Agricultural Engineering, Ottawa, v.42,