HESSD
9, 9295–9336, 2012Relating trends in streamflow to anthropogenic
influences
R. Nune et al.
Title Page
Abstract Introduction
Conclusions References
Tables Figures
◭ ◮
◭ ◮
Back Close
Full Screen / Esc
Printer-friendly Version Interactive Discussion
Discussion
P
a
per
|
Dis
cussion
P
a
per
|
Discussion
P
a
per
|
Discussio
n
P
a
per
|
Hydrol. Earth Syst. Sci. Discuss., 9, 9295–9336, 2012 www.hydrol-earth-syst-sci-discuss.net/9/9295/2012/ doi:10.5194/hessd-9-9295-2012
© Author(s) 2012. CC Attribution 3.0 License.
Hydrology and Earth System Sciences Discussions
This discussion paper is/has been under review for the journal Hydrology and Earth System Sciences (HESS). Please refer to the corresponding final paper in HESS if available.
Relating trends in streamflow to
anthropogenic influences: a case study
of Himayat Sagar catchment, India
R. Nune, B. A. George, P. Teluguntla, and A. W. Western
Department of Infrastructure Engineering, The University of Melbourne, Melbourne, Australia
Received: 25 June 2012 – Accepted: 2 August 2012 – Published: 9 August 2012
Correspondence to: R. Nune ([email protected])
HESSD
9, 9295–9336, 2012Relating trends in streamflow to anthropogenic
influences
R. Nune et al.
Title Page
Abstract Introduction
Conclusions References
Tables Figures
◭ ◮
◭ ◮
Back Close
Full Screen / Esc
Printer-friendly Version Interactive Discussion
Discussion
P
a
per
|
Dis
cussion
P
a
per
|
Discussion
P
a
per
|
Discussio
n
P
a
per
|
Abstract
Catchment development has been identified as potentially causing major changes in streamflow in India. This paper tests for trends in rainfall and streamflow in Himayat Sagar catchment and shows major declines in streamflow without significant changes in precipitation. It then relates the streamflow trends to anthropogenic influences in
5
Himayat Sagar catchment. A simple rainfall-runoffregression model was used to quan-tify the change in magnitude of rainfall-runoffrelationship over the study period. Then, the anthropogenic changes in the catchment including land use, watershed develop-ment, groundwater abstractions and storages, and evapotranspiration were quantified. The changes in the components of the water balance were then compared.
Stream-10
flows were found to decline at a rate of 3.6 mm yr−1. The main land use change was found to be a conversion from rainfed to irrigated agriculture, fed by groundwater ex-tractions. Irrigated area increased from 8 % to 23 % of the cropping area during the monsoon (Kharif) season (June–November) and from 8 % to 16 % of cropping area during the dry (Rabi) season (December–March). Various estimates of changes in
15
evapotranspiration/irrigation water use were made. Well inventories suggest ground-water extractions increase of 7.2 mm yr−1, typical irrigation practices suggests applied water increased by 10.8 mm yr−1, while estimates of evapotranspirations using AVHRR images showed an increasing rate of 4.1 mm yr−1. Surface water storage capacity for various small watershed development structures increased 2 mm over 7 yr. Taken
to-20
gether, the streamflow trends and groundwater information suggest the most plausible estimates of evapotranspiration changes comes from the AVHRR imagery.
1 Introduction
Many regions of the world face water shortages that are increasing and may become severe in the future (Rockstrom et al., 2009). A range of studies have discussed water
25
HESSD
9, 9295–9336, 2012Relating trends in streamflow to anthropogenic
influences
R. Nune et al.
Title Page
Abstract Introduction
Conclusions References
Tables Figures
◭ ◮
◭ ◮
Back Close
Full Screen / Esc
Printer-friendly Version Interactive Discussion
Discussion
P
a
per
|
Dis
cussion
P
a
per
|
Discussion
P
a
per
|
Discussio
n
P
a
per
|
in south Asia (Bouwer et al., 2006; Sharma et al., 2010) , southern and eastern Eu-ropean countries (Stahl et al., 2010) , many regions in England (Charlton and Arnell, 2011) and in Australia (Chiew and McMahon, 2002) , among others. These studies em-phasised the necessity of understanding different drivers that impact water resources for addressing future water shortages.
5
The drivers that could affect water availability, in particular streamflow and groundwa-ter include climate change, wagroundwa-ter resource development and wagroundwa-ter use at a variety of scales, and a wide range of anthropogenic changes in catchment characteristics. Spe-cific examples include construction of water retention structures (Beavis et al., 1997; Ramireddygari et al., 2000; Schreider et al., 2002) , increased and/or changing
agricul-10
tural land use (Masih et al., 2011) and increased groundwater extraction and artificial water storages for groundwater recharge (Ramireddygari et al., 2000; Alemayehu et al., 2007). In some cases, these variations may change evapotranspiration and the surface energy balance, thereby also affecting the local climate (Cassardo and Jones, 2011). While development activities may provide benefits in agricultural production, they can
15
also have adverse effects on streamflow and groundwater availability that may lead to both human and ecological impacts downstream (Schreider et al., 2002). In rapidly developing catchments, there are often a number of changes occurring simultaneously with significant potential to impact on the hydrology.
The most visible sign of hydrologic change in a catchment is from the trend of
stream-20
flow, which indicates that changes have occurred within the catchment but, in itself, does not provide information on the relative contributions of multiple drivers of change. Such information is critical for developing evidence based policies to manage such changes into the future. A number of studies have tried to explain observed trends in streamflow with respect to changes in climate, catchment characteristics and
an-25
HESSD
9, 9295–9336, 2012Relating trends in streamflow to anthropogenic
influences
R. Nune et al.
Title Page
Abstract Introduction
Conclusions References
Tables Figures
◭ ◮
◭ ◮
Back Close
Full Screen / Esc
Printer-friendly Version Interactive Discussion
Discussion
P
a
per
|
Dis
cussion
P
a
per
|
Discussion
P
a
per
|
Discussio
n
P
a
per
|
distribution and land use changes. In Tunisia, Chulli et al. (2011) , found that the de-crease in surface runoffin the upper Merguellil catchment is due to consequences of human activities. Similarly Van Kirk and Naman (2008), analysed climatic and non-climatic (irrigation withdrawals) drivers and their affects on base flow trends. Most of the studies have discussed streamflow trends with respect to changes in land use or
5
climate variability or both within a catchment; whereas only a few studies have related streamflows to all the changes within the catchment.
This study aims to understand a variety of changes in the Himayat Sagar catchment (HSC), India where there has been a number of changes at small scales including increased hydrological structures and groundwater extractions that are challenging to
10
scale up. Since 1987, in drought prone areas of India, small scale water resource de-velopments under various watershed development programmes were introduced by the Government of India, including the Drought Prone Area Programme (DPAP) and Integrated Wasteland Development Programme (IWDP). From 1994–1995, these pro-grammes have intensified after the launch of detailed new guidelines on organizational
15
aspects, finance, training and stakeholder participation (Kalpataru Research Founda-tion, 2001; Hanumantha Rao, 2006). In many arid and semi-arid regions of India, these programmes aimed to improve socio economic conditions through increased agricul-tural production in rain fed areas, and to control land degradation by conserving rain-water for use during dry periods. The study area (HSC) is located in a semi-arid
re-20
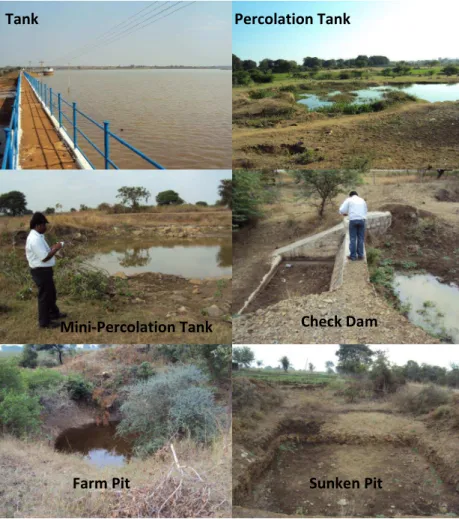
gion. This region is historically among the poorest areas in India and it has previously been severely affected by droughts (World Bank, 2005). Therefore, Water Develop-ment Structures (WDS, Fig. 1) such as percolation tanks, mini-percolation tanks, check dams, sunken pits, and farm pits, have been developed in the study area (HSC).
While these structures are beneficial to upstream users, they affect the downstream
25
HESSD
9, 9295–9336, 2012Relating trends in streamflow to anthropogenic
influences
R. Nune et al.
Title Page
Abstract Introduction
Conclusions References
Tables Figures
◭ ◮
◭ ◮
Back Close
Full Screen / Esc
Printer-friendly Version Interactive Discussion
Discussion
P
a
per
|
Dis
cussion
P
a
per
|
Discussion
P
a
per
|
Discussio
n
P
a
per
|
(Sakthivadivel et al., 1997). Due to rapid development of these structures, groundwater utilisation has expanded and it has become a conjunctive resource for agriculture in semi-arid areas. Overall, the use of water resources for irrigation has accelerated and currently in India 78 % of irrigated land is supplied through groundwater resources (Benoit et al., 2007). Coinciding with all these changes, there have been significant
5
reductions in downstream flows (Schreider et al., 2002).
This paper examines these issues in the HSC, which has undergone a suite of changes due to watershed development over the past two decades and has exhib-ited declining streamflows. The paper first addresses the question of whether stream-flow trends are exogenous (climate forced) or endogenous (due to changes in the
10
catchment) by characterising the trends in climate and streamflows. It then examines changes in catchment characteristics due to anthropogenic activities in detail. Finally it compares the changes with the aim of investigating which drivers could best explain the trend in streamflow.
2 Study catchment
15
The HSC has an area of 1340 km2and is an upper part of the Musi River catchment, within the Krishna River Basin in Southern India. The catchment partly covers two dis-tricts of the state of Andhra Pradesh, namely Rangareddy (87 %) and Mahabubnagar (13 %) as shown in Fig. 2. There are 12 Mandals (a combination of a few villages) and 217 villages either partially or fully covered by the catchment. The elevation varies
20
from 527 m to 726 m above sea level with flat topography ranging between 1 % and 3 % slope. The soils are predominantly clayey (>70 % of catchment area), along with loamy and rock formations making up the remainder (Gurunadha Rao et al., 2007). The extreme temperature reaches a maximum of 44◦C during summer and a minimum of 12◦C during winter (George et al., 2007).
25
HESSD
9, 9295–9336, 2012Relating trends in streamflow to anthropogenic
influences
R. Nune et al.
Title Page
Abstract Introduction
Conclusions References
Tables Figures
◭ ◮
◭ ◮
Back Close
Full Screen / Esc
Printer-friendly Version Interactive Discussion
Discussion
P
a
per
|
Dis
cussion
P
a
per
|
Discussion
P
a
per
|
Discussio
n
P
a
per
|
typically starts by early June, gradually recedes from early September and finishes by mid October. There are two main crop seasons in this catchment, the Kharif or monsoon season (June–November) and the Rabi or dry season (December–March). Agricultural lands are kept fallow during the summer season (April–May) in preparation for the next Kharif season.
5
The main stream in the HSC is the Esa River, which has a dendritic stream net-work of density 0.4 km km−2. In 1927, the Himayat Sagar reservoir was constructed on Esa River near the catchment outlet and 9.6 km upstream of Hyderabad city to control floods and supply drinking water to the city. The Esa River flows into the Himayat Sagar (HS) reservoir and then joins the Musi River downstream of the reservoir.
10
In this study, the term watershed development structures implies particular struc-tures which play an important role in improving local access to water resources, includ-ing percolation tanks, mini-percolation tanks, check dams, sunken pits, gully control structures, feeder channels and farm pits/ponds. The main purpose of gully control structures is erosion control, though they store some runofftemporarily, which passes
15
downstream slowly. The sunken pits and feeder channels are also silt controlling struc-tures, but they hold runoff permanently in the stream bed. Therefore, the main runoff capturing structures are percolation tanks, mini-percolation tanks, check dams and farm pits, which hold runoffpermanently in the catchment.
3 Data
20
The data used in this study was collected from three sources: the relevant Govern-ment departGovern-ments in Andhra Pradesh, India; field survey; and interpretation of remote sensing images on Google Earth. The following sources of Government data were used and are described in more detail in this section, with the other data described in the methods section. Data collected included: daily rainfall data of 12 rainfall
sta-25
HESSD
9, 9295–9336, 2012Relating trends in streamflow to anthropogenic
influences
R. Nune et al.
Title Page
Abstract Introduction
Conclusions References
Tables Figures
◭ ◮
◭ ◮
Back Close
Full Screen / Esc
Printer-friendly Version Interactive Discussion
Discussion
P
a
per
|
Dis
cussion
P
a
per
|
Discussion
P
a
per
|
Discussio
n
P
a
per
|
and Sewerage Board (HMWSSB); Land use statistics from the Directorate of Eco-nomics and Statistics (DES); Groundwater levels (pre-monsoon (end of May) and post-monsoon (end of November)) of 10 observation wells from the Central Groundwater Board (CGWB); and the time series of WDSs sanctioned in Rangareddy district from the District Water Management Agency (DWMA), Rangareddy district.
5
3.1 Rainfall
The 12 rainfall stations and their locations are shown in Fig. 2, and their detailed proper-ties are given in Table 1. The elevation of rainfall stations ranges from 535 m to 720 m above sea level. Among these stations, six had longer records covering 1980–2004, while the other six had shorter records covering 1990–2004.
10
3.2 Reservoir data
Monthly streamflow into HS reservoir has been estimated using water storage levels (1980 to 2004), storage-area-capacity tables, surplus discharges (1980–2004) and wa-ter supply withdrawals (1980 to 2004). Evaporation losses are estimated using monthly evaporation depths estimated by HMWSSB and were assumed to be constant for all
15
the years during the study period.
3.3 Land use information
The mandal (sub-district area, 1985–1987, 1991–1994 and 1999–2004) and district (1985–2004) wise land use information of the study area was collected from DES. Data gaps (1988 and 1990) found in the mandal level were filled with the corresponding
20
percentage changes observed in the district level information. Area irrigated during the Kharif (monsoon, June–November) and Rabi (dry, December–March) seasons in the catchment were obtained from the mandal wise information under area irrigated by the groundwater sources. The difference between the net sown area and the irrigated area was considered as rain fed area.
HESSD
9, 9295–9336, 2012Relating trends in streamflow to anthropogenic
influences
R. Nune et al.
Title Page
Abstract Introduction
Conclusions References
Tables Figures
◭ ◮
◭ ◮
Back Close
Full Screen / Esc
Printer-friendly Version Interactive Discussion
Discussion
P
a
per
|
Dis
cussion
P
a
per
|
Discussion
P
a
per
|
Discussio
n
P
a
per
|
3.4 Groundwater levels
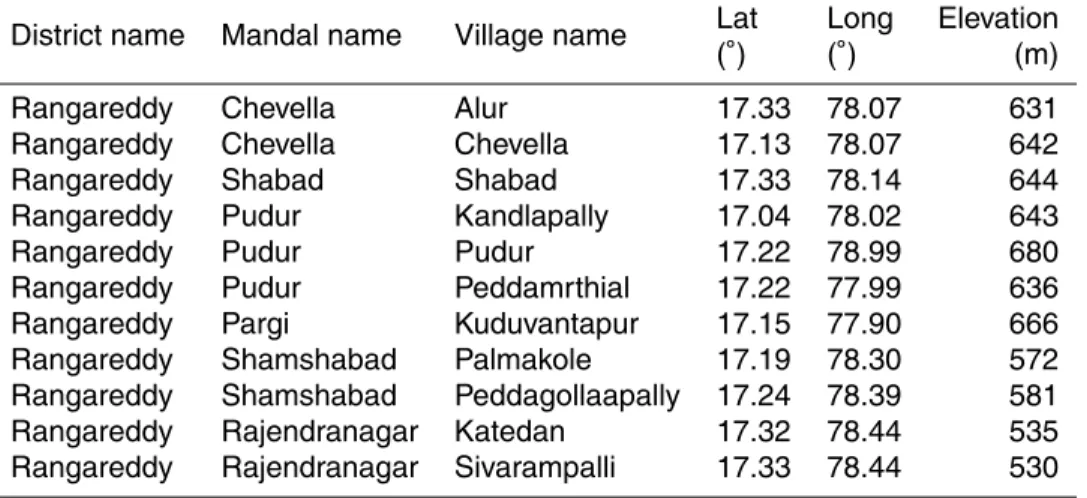
The locations and other details of the observation wells are given in Fig. 2 and Table 2, respectively. The surface elevations of observation wells above mean sea level range from 570 m to 680 m. The district wise groundwater production wells inventory infor-mation (1980–2004) was obtained from the Minor Irrigation Census, (MIC, Ministry of
5
Water Resources), India. The number of groundwater wells within the catchment was obtained from the district level information and the percent of area covered by each district.
3.5 Groundwater extractions survey
The groundwater extraction survey has been taken place based on groundwater
sta-10
tus in the catchment. The groundwater status is defined using four categories based on the ratio of groundwater usage to rainfall recharge. The categories are Over-Exploited (>100 %), Critical (90–100 %), Semi-Critical (75–90 %) and Safe (<75 %). The groundwater status has been evaluated in every watershed by CGWB for every two years. The groundwater status (2004–2005) was taken as the average status for all
15
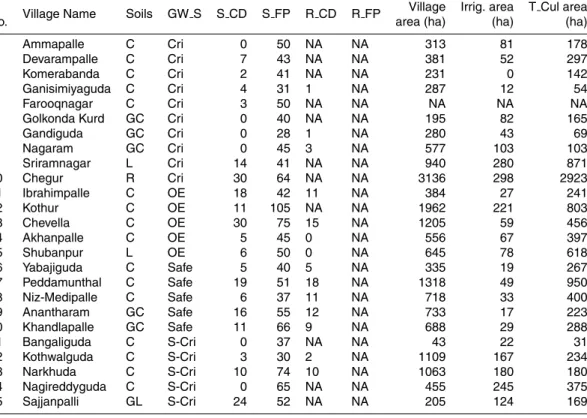
villages within the watershed (Fig. 3). The information needed to estimate the ground-water extractions including typical pumping hours and flow rates, the number of wells per hectare used during the cropping seasons, were collected through field survey in representative villages of every category.
3.6 Watershed development structures
20
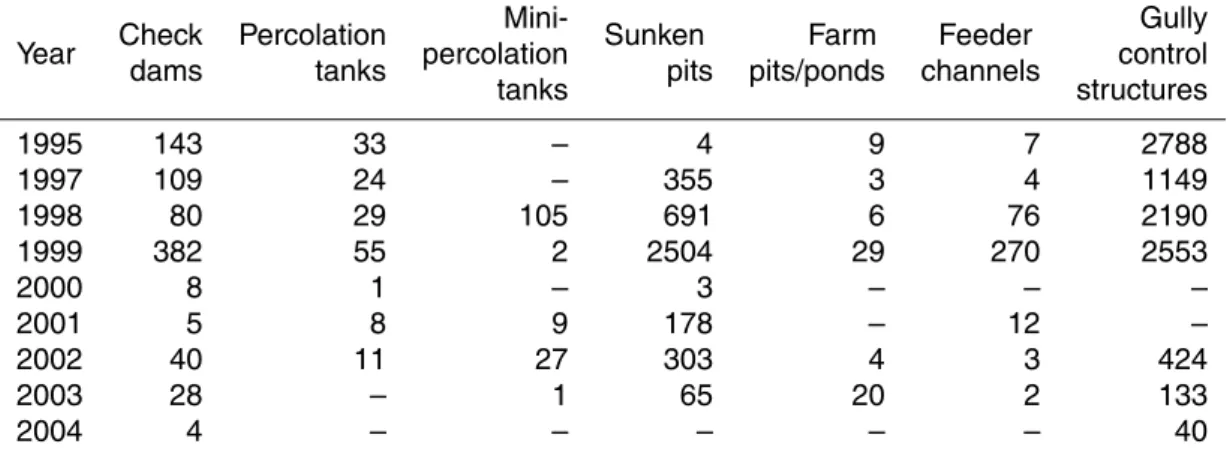
The information of watershed development structures (1995–2005, Table 3) was ex-tracted from the data collected at DWMA, Rangareddy district based on the village lo-cations covered within the catchment. The function of these structures is either silt con-trol (sunken pits, feeder channels and gully concon-trol structures) or groundwater recharge (check dams, percolation tanks, mini-percolation tanks and farm pits). Although the silt
HESSD
9, 9295–9336, 2012Relating trends in streamflow to anthropogenic
influences
R. Nune et al.
Title Page
Abstract Introduction
Conclusions References
Tables Figures
◭ ◮
◭ ◮
Back Close
Full Screen / Esc
Printer-friendly Version Interactive Discussion
Discussion
P
a
per
|
Dis
cussion
P
a
per
|
Discussion
P
a
per
|
Discussio
n
P
a
per
|
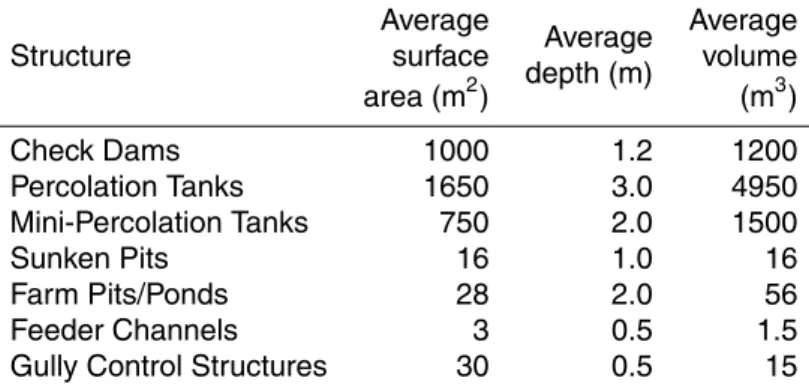
control structures occupy a major part in total number, the volume of water that they could capture is relatively small. There are fewer recharge structures but they can capture a significant amount of runofffrom the catchment. The area-volume relation-ships of each type of structures were collected during field work and are in Table 4. Apart from these watershed development structures, tanks are existed historically in
5
the catchment. The surface areas of these tanks were obtained by analysing the Land Sat images taken during the monsoon seasons of the years 1985, 1989 and 2002.
4 Methods
This section describes the study conceptualization, estimation of streamflows and their trend, and analysis of anthropogenic changes. In this paper, anthropogenic changes
10
include changes in land use, groundwater extractions and water retention in watershed development structures. The analysis presented in this section consists of three parts. First, we examined the streamflow and rainfall data for statistically significant trends. Second, we quantified the variations in streamflows over the study period. Third, we compared the trend in streamflow to various anthropogenic changes that have taken
15
place during study period. Before discussing each of these steps we describe rainfall and streamflow data preparation procedures.
4.1 Estimating streamflows and catchment average rainfall
The consistency of rainfall records was checked using the double mass curve method. Areally weighted average annual rainfall was then estimated using the Thiessen
poly-20
HESSD
9, 9295–9336, 2012Relating trends in streamflow to anthropogenic
influences
R. Nune et al.
Title Page
Abstract Introduction
Conclusions References
Tables Figures
◭ ◮
◭ ◮
Back Close
Full Screen / Esc
Printer-friendly Version Interactive Discussion
Discussion
P
a
per
|
Dis
cussion
P
a
per
|
Discussion
P
a
per
|
Discussio
n
P
a
per
|
Streamflow is not directly observed in HSC; instead it was estimated by applying a water balance to the HS reservoir. Monthly streamflows,Ri, into HS reservoir for the
study period were then estimated using Eq. (1).
Ri¯= ∆RSi+Wi+Ei+Di (1)
In Eq. (1), subscripti is the time period (month),∆RS is the change in reservoir storage
5
volume (GL),W is the water supply withdrawal volume (GL),Ethe evaporation volume (GL) andD is the discharge/spill volume (GL) from the reservoir. Negative streamflow estimates during the non-monsoon period were set to zero.Ri were then summed to
annual values and converted to runoffdepth (mm) by dividing by catchment area.
4.2 Estimating trends of streamflow and rainfall
10
Non-parametric trend analysis tests (the Mann-Kendall test and Spearman’s Rho test) from the TREND tool (Chiew and Siriwardena, 2005) were used for detecting linear trends in the time series data of the annual streamflow and rainfall during study period (1980–2004). A 5 % significance level was adopted for this test.
4.3 Quantification of change in magnitude of streamflows
15
This analysis involved fitting and evaluating a regression model to observed rainfall and runoffdata in the HSC and then quantifying the change in streamflow over the study period for different annual rainfall percentiles.
First, we fitted a non-linear regression rainfall-runoff model (Eq. 2) to simulate streamflows (R) into the reservoir:
20
R=
(at+b) (P −Pt)P ≥Pt 0 P < Pt
(2)
HESSD
9, 9295–9336, 2012Relating trends in streamflow to anthropogenic
influences
R. Nune et al.
Title Page
Abstract Introduction
Conclusions References
Tables Figures
◭ ◮
◭ ◮
Back Close
Full Screen / Esc
Printer-friendly Version Interactive Discussion
Discussion
P
a
per
|
Dis
cussion
P
a
per
|
Discussion
P
a
per
|
Discussio
n
P
a
per
|
which no runoff occurs. The parametersa,band Pt were obtained by minimising the
sum of squared errors between observed and simulated annual runoff values using Microsoft Excel solver. The model quality was evaluated by plotting residuals against predicted values.
Second, we quantified the variations in magnitude of rainfall-runoff relationship at
5
different time steps (1980, 1990, 2000 and 2004) for different annual rainfall percentiles.
4.4 Analysing anthropogenic changes
In this section, we address three aspects of anthropogenic change: land use and evap-otranspiration; groundwater storage and extraction; and interception due to hydrologi-cal structures. These changes can influence the hydrologihydrologi-cal components and alter the
10
entire catchment water balance.
The hydrologic components in the HSC was conceptualised using a simple mass balance method (Eq. 3). That is, input (rainfall, P) to the catchment equals the sum of outputs (evaporation, E, and streamflow, R) from the catchment plus the change in (groundwater) storage, ∆S, within the catchment. Equation (3) is applied for the
15
period 1998–2004 as the data required to evaluate the changes in all components are available. It is assumed that changes in unsaturated zone storage are negligible over this period. This equation implies that a trend observed in runoffmust be balanced by trends in one or more of the other components.
P = ∆S+E+R (3)
20
Units of mm yr−1are used throughout.
First, land use was classified into four classes namely forest, range land (which in-cludes barren lands, non-agricultural use lands, pasture lands, trees, cultivable waste lands and other fallow lands), current fallow land and net sown (i.e. first crop) areas. Then, to examine the detailed changes in land use associated with significant water
25
HESSD
9, 9295–9336, 2012Relating trends in streamflow to anthropogenic
influences
R. Nune et al.
Title Page
Abstract Introduction
Conclusions References
Tables Figures
◭ ◮
◭ ◮
Back Close
Full Screen / Esc
Printer-friendly Version Interactive Discussion
Discussion
P
a
per
|
Dis
cussion
P
a
per
|
Discussion
P
a
per
|
Discussio
n
P
a
per
|
using groundwater during the Rabi season, as the rainfall contribution in this season is very low (10 % of average annual rainfall).
Second, changes in groundwater storages were obtained and their trends were anal-ysed. The change in groundwater storage was estimated using average pre and post monsoon groundwater heads and using Water Table Fluctuation (WTF) method as
5
given in Eq. (4). The Digital Elevation Model (DEM) was used to obtain the average groundwater head of the catchment. For this, the pre and post monsoon groundwater heads for each grid cell was obtained by applying the correlation between observed groundwater heads and elevations at 11 observation wells every year (1997–2004). The groundwater heads of 1997 (pre and post monsoon) were considered as datum
10
to evaluate the change in heads of remaining period (1998–2004) as given in Eq. (5). Then, the mean heads of all grid cells was considered as the average head of the sea-son. The average of pre and post monsoon heads was taken as average change in groundwater storage of the year.
Rchg,t=Sy∆Ht (4)
15
∆Ht=
Pn
j=1
Hi
(t)−H1997
N (5)
Where t is the time period (annual), j is the number of grid cell, Rchg the recharge
(mm),Sy the specific yield and∆H the average of change in water head (mm, post
monsoon and pre monsoon).
20
Third, the change in interception due to watershed development structures over the study period was estimated as follows. The inventory of water retention such as farm pits/pond, check dams, percolation and mini-percolation tanks were captured from DWMA data. As the data collected from DWMA covers 87 % of the study area (only Ranga reddy district), Google Earth images were used to count the major structures
25
HESSD
9, 9295–9336, 2012Relating trends in streamflow to anthropogenic
influences
R. Nune et al.
Title Page
Abstract Introduction
Conclusions References
Tables Figures
◭ ◮
◭ ◮
Back Close
Full Screen / Esc
Printer-friendly Version Interactive Discussion
Discussion
P
a
per
|
Dis
cussion
P
a
per
|
Discussion
P
a
per
|
Discussio
n
P
a
per
|
with no Government funding and these are missing from the information collected. To capture this information we randomly selected 25 villages in the entire catchment and mapped the structures using Google Earth images. The mean densities of farm pits were grouped as per groundwater status of the village, total village area and irrigated area and the means of these groups were compared using ANOVA test to analyse the
5
significance among them. The best correlation was taken into consideration to extrapo-late the information for the entire catchment. The surface area of already existing tanks were estimated by classifying Land Sat images for the years 1985, 1989 and 2002 us-ing the ERDAS Imagine software (Chander et al., 2009). Overall, the total volume of interceptions by these structures was estimated based on the data collected (DWMA),
10
field data and extrapolated data.
5 Results
In this section, we firstly test the temporal trends in rainfall and streamflow. Secondly, we quantify the changes in streamflows before we examine the drivers that have im-pacted the streamflows in the HSC.
15
5.1 Estimation of trends in rainfall and streamflow
Figure 4 shows the pattern of annual average rainfall during the study period. The weighted average annual rainfall is estimated as 718 mm yr−1 and it ranges between 471 mm yr−1(2004) and 996 mm yr−1(1983) with a standard deviation of 153 mm yr−1 and coefficient of variation of 0.21. The trend tests performed on two sets (1980–2004,
20
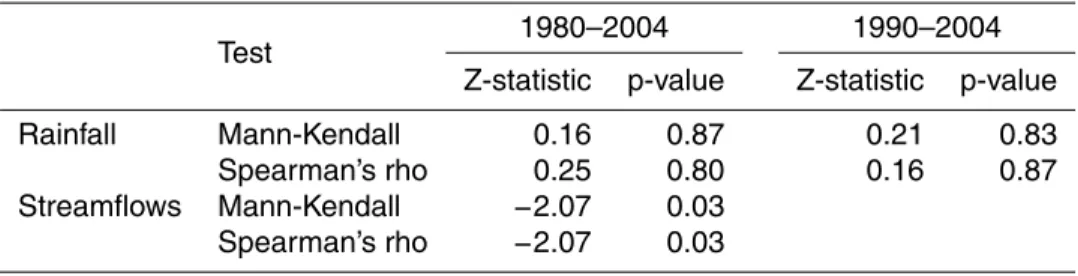
6 rainfall stations; 1990–2004, 12 rainfall stations) of catchment average annual rainfall shows no significant temporal trend (Table 5). The annual streamflow pattern into HS reservoir is also shown in Fig. 4. The average annual streamflow into the HS reservoir is estimated as 58 mm yr−1, ranging between 2 mm yr−1 (2004) and 247 mm yr−1(1983), with a standard deviation of 60 mm yr−1 and coefficient of variation of 1.04. The 5-yr
HESSD
9, 9295–9336, 2012Relating trends in streamflow to anthropogenic
influences
R. Nune et al.
Title Page
Abstract Introduction
Conclusions References
Tables Figures
◭ ◮
◭ ◮
Back Close
Full Screen / Esc
Printer-friendly Version Interactive Discussion
Discussion
P
a
per
|
Dis
cussion
P
a
per
|
Discussion
P
a
per
|
Discussio
n
P
a
per
|
average streamflows for the periods 1980–1984, 1985–1989, 1990–1994, 1995–1999 and 2000–2004 were declined as 105, 55, 50, 46 and 32 mm yr−1 respectively for the corresponding average rainfall of 735, 715, 705, 748 and 687 mm yr−1. It is observed that the average runoffcoefficient has declined from 14 % (1980–1984) to less than 5 % (2000–2004). Also the trend test on annual streamflows suggests that the streamflows
5
were declined significantly (Table 5). Overall, the streamflows showed a declining trend, while no trend was observed in rainfall over the study period, at a 5 % significance level. This strongly suggests that observed changes in streamflow are due to endogenous (i.e. internal to the catchment, anthropogenic) rather than exogenous (due to climate) changes in the catchment.
10
5.2 Quantification of change in magnitude of streamflows
Figure 5a shows the model (Eq. 2) fit to the annual rainfall-runoffdata (1980–2004), for which the coefficient of determination, R2 was 0.76. Figure 5b shows the model residuals plotted over predicted values, which indicated that the model fitted well to the data. It is observed that the parameters resulting from the model fit area=−0.02,
15
b=0.47 andPt=518 mm, wheret=1 in 1980. Using these parameters, the model for
1980, 1990, 2000 and 2004 is shown in Fig. 5c. The predicted runofffor these years and the 25th, 50th and 75th percentile annual rainfall are given in Table 6. From 1980 to 2004, the predicted streamflows declined by 27, 61 and 113 mm respectively for the 25th, 50th and 75th rainfall percentiles. The median change (i.e. 50th rainfall percentile)
20
in streamflow during the study period is a 76 % reduction, from 1980 to 2004.
5.3 Characterizing drivers of streamflow change
In this section, we first characterise the changes in various catchment characteris-tics that could influence streamflows. These are endogenous changes due to anthro-pogenic activities. First, we examined the changes in land use; second we examined
25
HESSD
9, 9295–9336, 2012Relating trends in streamflow to anthropogenic
influences
R. Nune et al.
Title Page
Abstract Introduction
Conclusions References
Tables Figures
◭ ◮
◭ ◮
Back Close
Full Screen / Esc
Printer-friendly Version Interactive Discussion
Discussion
P
a
per
|
Dis
cussion
P
a
per
|
Discussion
P
a
per
|
Discussio
n
P
a
per
|
series of hydrological structures during study period and the volume of water that could be intercepted by these structures.
First, Fig. 6a shows the average land use variations in the catchment between 1985– 1989 and 2000–2004. The comparison of land use changes from 1985–1989 to 2000– 2004 shows that the Forest (F) area has not changed and remained at 6 %, Range
5
Lands (RL) has reduced slightly from 31 % to 28 %, Current Fallow (CF) lands have increased from 23 % to 33 % and Net Sown Area (NSA) has decreased from 40 % to 33 %. However, it is unclear whether these changes reflect the inter-annual variability or whether the changes will be sustained.
A detailed analysis of NSA over the last two decades indicates that the irrigated
10
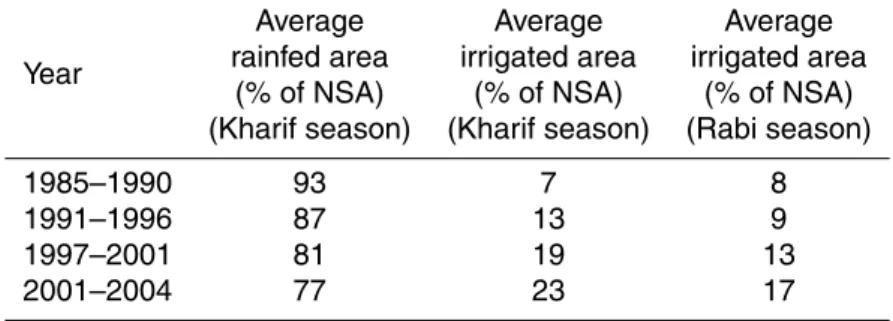
crop area (and the area sown more than once) has at least doubled (Fig. 6b). As a percentage of the net sown area, the average net irrigated area has increased from 7 % (1985–1989) to 23 % (2000–2004) and from 8 % (1985–1989) to 17 % (2000–2004) in the Kharif and Rabi seasons respectively (Table 7). It is also observed that during the Kharif season the overall percentage of rice remained constant, but 40 % of the rain
15
fed rice crop area was converted to irrigate. Thus, it is clear that the most significant land use change in the HSC has been due to irrigation expansion and intensification.
Second, we examined the groundwater heads and draft during study period. The average groundwater heads from 1998 to 2004 appeared to be declining at a rate of 0.30 m yr−1, while the groundwater storage is declining at a rate of 6.1 mm yr−1
(assum-20
ing a specific yield of 0.014, Mar ´echal et al., 2006) as shown in Fig. 7. Groundwater extractions were estimated using two methods: based on inventory of bore wells and land use statistics. The number of groundwater wells in the HSC has increased from 13 280 (1993) to 31 600 (2004). Information on the average number of pumping hours per day (7 h) was collected during the field survey (Table 8) and an average pumping
25
HESSD
9, 9295–9336, 2012Relating trends in streamflow to anthropogenic
influences
R. Nune et al.
Title Page
Abstract Introduction
Conclusions References
Tables Figures
◭ ◮
◭ ◮
Back Close
Full Screen / Esc
Printer-friendly Version Interactive Discussion
Discussion
P
a
per
|
Dis
cussion
P
a
per
|
Discussion
P
a
per
|
Discussio
n
P
a
per
|
results indicate that the groundwater draft estimates in the catchment based on the land use information has increased from 140 mm yr−1 (1998) to 214 mm yr−1 (2004), and based on an inventory of wells it has increased from 110 mm yr−1(1998) to 149 mm yr−1 (2004). Overall, it appears that significant increases in groundwater extraction rate have occurred and as a result the groundwater levels have declined in the HSC.
5
Third we analysed Watershed Development Structures (WDS) data and estimated the volumes of water captured by these structures during the study period. For this, first we compared the statistics of check dams and farm pits collected from the DWMA (Village level data) with the information extracted from Google Earth images (2003 im-age, Table 9). Results showed no significant difference in the number of check dams
10
among the villages where the information is available in both sets (DWMA & Google Earth Survey). However, it was also found that there had been check dams in many other villages, which may have constructed by other Government departments. For farm pond and pit numbers; however, it was observed that there were significant dif-ferences between these two data sets. This difference is likely to arise because the
15
construction cost of a farm pit is low and it can be built without any Government fund-ing, whereas check dams can only be built by Government organisations. As there is significant discrepancy between the farm pit numbers observed from Google Earth data and the Government data, it was concluded that the statistical data for farm ponds and pits are unreliable. Therefore we attempted to predict the density of farm pits based
20
on Google Earth data and village characteristics including village area, irrigated area and cultivable area. The highest correlation was observed between the density of farm pits and the total village area, which was then used to estimate the farm pits number. The estimated total number of farm pits in the HSC was 1950 (in 2004).
Finally the total storage volume of WDS was estimated from the depth-area-volume
25
HESSD
9, 9295–9336, 2012Relating trends in streamflow to anthropogenic
influences
R. Nune et al.
Title Page
Abstract Introduction
Conclusions References
Tables Figures
◭ ◮
◭ ◮
Back Close
Full Screen / Esc
Printer-friendly Version Interactive Discussion
Discussion
P
a
per
|
Dis
cussion
P
a
per
|
Discussion
P
a
per
|
Discussio
n
P
a
per
|
(Table 10). The Surface water storage capacity of tanks and WDS has increased from 26.4 mm yr−1(1995) to 28.4 mm yr−1(2004).
The above all changes indicate that evapotranspiration from the catchment must be have increased significantly. The ET estimates obtained using AVHRR remote sensing images show a continuous increasing trend of 4.1±2.6 mm yr−1 from 1984 to 2001
5
(Teluguntla et al., 2011) (Fig. 8). This increase in ET is mainly due to increase in Leaf Area Index (as indicated by NDVI) which is directly linked to irrigation as there are no other significant changes in land use in the study area.
6 Discussion
The trend tests results showed no significant changes within the rainfall; however,
sig-10
nificant declining trend was observed in streamflows during the study period. The diff er-ence between 5-yr average annual streamflows of 1980–1984 and 2000–2004 shows a decrease of 73 mm from 105 mm yr−1 to 32 mm yr−1. The streamflow simulated by the regression model also show that median streamflows reduced by 61 mm from 1980 (80 mm yr−1) to 2004 (19 mm yr−1). Overall, the rate of change of observed and model
15
simulated streamflows is−3.6±3.5 mm yr−1and−3.5±3.0 mm yr−1respectively. Given the lack of trend in rainfall, the trend observed in the streamflows is likely to be due to internal changes within the catchment, not due to changes in rainfall.
Our analysis of catchment characteristics shows changes in land use, particularly within cropping areas; changes in groundwater extraction; and changes in the number
20
of hydrological structures in the catchment. The major change in land use was in the irrigated area, which increased in both Kharif (from 8 % to 23 %) and Rabi (from 8 % to 16 %) cropping seasons. Most of this irrigation demand was met from groundwater and is reflected in the groundwater storage which is decreasing at a rate of 6.1 mm yr−1. Groundwater irrigation was originally practised as supplemental irrigation to satisfy the
25
HESSD
9, 9295–9336, 2012Relating trends in streamflow to anthropogenic
influences
R. Nune et al.
Title Page
Abstract Introduction
Conclusions References
Tables Figures
◭ ◮
◭ ◮
Back Close
Full Screen / Esc
Printer-friendly Version Interactive Discussion
Discussion
P
a
per
|
Dis
cussion
P
a
per
|
Discussion
P
a
per
|
Discussio
n
P
a
per
|
It is also likely that irrigation practice has changed in the past two decades in the catchment. During field survey, it is observed that the farmers are irrigating the crops without considering the crop water demand. This is mainly because of the availability of free electricity to utilise groundwater. The statistical data on the evolution of the total number of wells in use also demonstrates this. The mix of irrigated crops has also
5
changed with dry crops favoured over wet crops in the wet season, and wet crops favoured over dry crops in the dry season now.
The change in irrigated area has affected groundwater level and storage in the catch-ment. We examined 11 observation wells for the period from 1998 to 2004. It was ob-served that the groundwater levels decreased at a rate of 0.30±0.29 m yr−1, which is
10
6.1±5.9 mm yr−1of decrease in groundwater storage. A study carried out in the Musi catchment during the period 1998–2004 concluded that the water table is declining at a rate of 0.18 m yr−1(Sylvain et al., 2007).
Estimates of groundwater extractions based on inventory of wells and land use statis-tics show increased rates of 7.2±1.6 mm yr−1 and 10.8±6.7 mm yr−1, respectively.
15
There is some evidence (Fig. 7) of increasing rates of groundwater decline over the period 1998–2004, although it is likely that inter-annual variability influences these pat-terns, so it is hard to draw firm conclusions. There is also some uncertainty in the specific yield values used in this analysis which needs some verification in the future. Large changes in groundwater levels are not observed in spite of increased pumping,
20
which may be because overall recharge might has increased due to increased recharge from irrigation and WDSs and also due to reducing base flows in streams.
Given that annual groundwater extraction rates have increase by around 40 mm yr−1 to 75 mm yr−1 over 1998–2004 and that groundwater storages are only declining by an average of 6 mm yr−1 over this period, it is likely that there was both a
de-25
HESSD
9, 9295–9336, 2012Relating trends in streamflow to anthropogenic
influences
R. Nune et al.
Title Page
Abstract Introduction
Conclusions References
Tables Figures
◭ ◮
◭ ◮
Back Close
Full Screen / Esc
Printer-friendly Version Interactive Discussion
Discussion
P
a
per
|
Dis
cussion
P
a
per
|
Discussion
P
a
per
|
Discussio
n
P
a
per
|
structure fills 8 times in a year). Also the data suggest that the increase in intercep-tion was high (0.62±0.37 mm filling−1yr−1or 5.0±3.0 mm 8 fillings−1yr−1) from 1995 to 1998 and that there was only limited increases from 1998 to 2004. However, from the random sampling of Google Earth images, we observed that check dams information in the data obtained from DWMA appears to be incomplete and that there could be many
5
WDS situated within the catchment developed by other departments than DWMA. This suggests that increased WDSs within the catchment may have helped increase the recharge, despite what is suggested by the DWMA. In addition to the WDS, there are existing tanks which capture 26 mm of rainfall when they fill to full capacity. Change in groundwater levels is likely to have reduced base flow discharge to streams and may
10
also have caused some increase in seepage from these large structures.
In an attempt to reconcile the trends in water balance, we rearranged the simple water balance Eq. (3) into Eq. (6), where the rate of change of groundwater storage,
S, is balanced by the net input to the catchment from rainfall,P, evapotranspiration,E, and runoff,R; where it is assumed that changes in soil moisture storage are negligible
15
(Eq. 6).
dS/dt=P −E−R (6)
Approximating the fluxes by linear trends allows them to be written as
P(t)=P0+tdP/dt (7)
20
E(t)=E0+tdE/dt (8)
R(t)=R0+tdR/dt (9)
WhereP0,E0 andR0 are the precipitation, evapotranspiration and runoffatt=0
sub-stituting Eqs. (7), (8) and (9) into Eq. (6) and integrating results in an estimate of the
25
change in groundwater storage as:
HESSD
9, 9295–9336, 2012Relating trends in streamflow to anthropogenic
influences
R. Nune et al.
Title Page
Abstract Introduction
Conclusions References
Tables Figures
◭ ◮
◭ ◮
Back Close
Full Screen / Esc
Printer-friendly Version Interactive Discussion
Discussion
P
a
per
|
Dis
cussion
P
a
per
|
Discussion
P
a
per
|
Discussio
n
P
a
per
|
Assuming that the catchment is in equilibrium att=0 implies the first bracket on the right hand side is zero and thus Eq. (10) simplifies to:
∆S=0.5(dP/dt−dE/dt−dR/dt)t2 (11)
Given that significant water resource development began around 1980 and the low level of water resource development in 1980, we assume that this represents equilibrium
5
conditions at the start of the subsequent development phase.
Our estimates of the rainfall and runoff trends are dP/dt=0 (1980–2004) and dR/dt=−3.6±3.5 mm yr−1(1980–2004). We have several estimates of rates of change of evapotranspiration as follows:
– remote sensing estimate dE/dt=4.1±2.6 mm yr−1(1984 to 2001);
10
– changes in well inventory dE/dt=7.2±1.57 mm yr−1(1998 to 2004); and – changes in irrigation area dE/dt=10.8±6.7 mm yr−1(1998 to 2004).
Using Eq. (11) with dR/dt=−3.6, dP/dt=0, and each of these estimates of dE/dt
in turn implies groundwater storage changes of −63 mm yr−1, −949 mm yr−1 and −1900 mm yr−1respectively, over the period 1998–2004. It should be noted that
equat-15
ing groundwater withdrawals and irrigation volumes to evapotranspiration assumes negligible recharge from irrigation applications, thus these two estimates of dE/dt
should be treated as upper bound estimates. The groundwater data that suggests groundwater storage falls by 6.1±5.9 mm yr−1or from 41 mm to 6 mm (around 35 mm) over 1998–2004.
20
Each of these terms is uncertain, as are the assumptions underlying Eq. (11). Our judgement is that we have more confidence in the rainfall and runofftrends and less confidence in the evapotranspiration and groundwater trends. The remote sensing es-timates of evapotranspiration trends appear to lead to a reasonable reconciliation of the combination of rainfall, runoffand groundwater trends over the period 1998–2004.
25
HESSD
9, 9295–9336, 2012Relating trends in streamflow to anthropogenic
influences
R. Nune et al.
Title Page
Abstract Introduction
Conclusions References
Tables Figures
◭ ◮
◭ ◮
Back Close
Full Screen / Esc
Printer-friendly Version Interactive Discussion
Discussion
P
a
per
|
Dis
cussion
P
a
per
|
Discussion
P
a
per
|
Discussio
n
P
a
per
|
Using a specific yield of 0.02 as above, the declines would be 7, 29 and 104 m respec-tively. Given that depth to water table is currently around 10 m (implying the decline since 1980 is≤10 m), also suggests that the remote sensing estimates of evapotran-spiration trends are the most plausible of the three.
7 Conclusions
5
This paper considers hydrologic trends and compares anthropogenic changes in dif-ferent aspects of the water balance of the Himayat Sagar Catchment in India. It is demonstrated that there are no statistically significant trends in annual rainfall, whereas there are clearly trends over time in catchment streamflows. These are associated with trends in land use and water management. Increases in irrigated area have occurred
10
and groundwater levels are declining. It is likely that increases in recharge from struc-tures such as tanks, check dams and percolation tanks have occurred, together with declining groundwater discharge. Irrigation water use per unit of irrigated area seems to be increasing. By examining water flux and storage trends within a simple water balance framework, it was possible to approximately reconcile the changes in the
vari-15
ous fluxes with groundwater storage declines, although significant uncertainty exists in these estimates.
Overall, it is clear that the trend in streamflow is due to anthropogenic changes, particularly increasing irrigation and groundwater extractions, as well as some increase in interception by WDSs in the HSC. Water usage in this catchment now exceeds
20
total sustainable resource availability, which suggests water shortages will continue to increase into the future unless water management practices change.
Acknowledgements. This research is funded by Australian Centre for International Agricultural Research (ACIAR) through a John Allwright Fellowship Award to the first Author. The Robert Bage Memorial Scholarship, University of Melbourne funded the first author to conduct the field 25
HESSD
9, 9295–9336, 2012Relating trends in streamflow to anthropogenic
influences
R. Nune et al.
Title Page
Abstract Introduction
Conclusions References
Tables Figures
◭ ◮
◭ ◮
Back Close
Full Screen / Esc
Printer-friendly Version Interactive Discussion
Discussion
P
a
per
|
Dis
cussion
P
a
per
|
Discussion
P
a
per
|
Discussio
n
P
a
per
|
International Water Management Institute (IWMI), ICRISAT, Hyderabad provided office space during field work in India. Tim Peterson and Murray Peel (The University of Melbourne) provided valuable suggestions on rainfall and groundwater analysis in this paper.
References
Adnan, N. A. and Atkinson, P. M.: Exploring the impact of climate and land use 5
changes on streamflow trends in a monsoon catchment, Int. J. Climatol., 31, 815–831, doi:10.1002/joc.2112, 2011.
Alemayehu, T., Furi, W., and Legesse, D.: Impact of water overexploitation on highland lakes of eastern ethiopia, Environ. Geol., 52, 147–154, doi:10.1007/s00254-006-0468-x, 2007. Beavis, S. G., Zhang, L., Evans, J. P., and Jakeman, A. J., and Smith, D. I.: Impacts and implica-10
tions of farm dams on catchment hydrology: Methods and application to chafrey catchment, MODSIM 97 Hobart, 1997.
Benoit, D., Jean-Marie, G., Faissal, K. Z., Shekeel, A., and Subrahmanyam, K.: A decision support tool with variable agro-climatic scenarios for sustainable groundwater management in semi-arid hard-rock areas, Curr. Sci. India, 92, 1093–1102, 2007.
15
Bouwer, L. M., Aerts, J. C. J. H., Droogers, P., and Dolman, A. J.: Detecting the long-term impacts from climate variability and increasing water consumption on runoffin the Krishna river basin (India), Hydrol. Earth Syst. Sci., 10, 703–713, doi:10.5194/hess-10-703-2006, 2006.
Cassardo, C. and Jones, J. A. A.: Managing water in a changing world, Water 3, 618–628, 20
doi:10.3390/w3020618, 2011.
Chander, G., Markham, B. L., and Helder, D. L.: Summary of current radiometric calibration coefficients for landsat mss, tm, etm+, and eo-1 ali sensors, Remote Sens. Environ., 113, 893–903, 2009.
Charlton, M. B. and Arnell, N. W.: Adapting to climate change impacts on water resources 25
in england – an assessment of draft water resources management plans, Global Environ. Chang., 21, 238–248, doi:10.1016/j.gloenvcha.2010.07.012, 2011.
Chiew, F. H. S. and McMahon, T. A.: Modelling the impacts of climate change on australian streamflow, Hydrol. Process., 16, 1235–1245, doi:10.1002/hyp.1059, 2002.
HESSD
9, 9295–9336, 2012Relating trends in streamflow to anthropogenic
influences
R. Nune et al.
Title Page
Abstract Introduction
Conclusions References
Tables Figures
◭ ◮
◭ ◮
Back Close
Full Screen / Esc
Printer-friendly Version Interactive Discussion
Discussion
P
a
per
|
Dis
cussion
P
a
per
|
Discussion
P
a
per
|
Discussio
n
P
a
per
|
Chulli, B., Favreau, G., Jebnoun, N., and B ´edir, M.: Impact of changing climate in the kairouan hydrological basin (central tunisia), J. Environ. Sci. Eng., 5, 682–688, 2011.
Dewandel, B., Gandolfi, J. M., de Condappa, D., and Ahmed, S.: An efficient methodology for estimating irrigation return flow coefficients of irrigated crops at watershed and seasonal scale, Hydrol. Process., 22, 1700–1712, doi:10.1002/hyp.6738, 2008.
5
George, B., Malano, M. H., and Davidson, B.: Integrated water allocation-economic modelling at a catchment scale, MODSIM-2007, Christchurch, 2007,
Gurunadha Rao, V. V. S., Suryanarayana, G., Prakash, B. A., Mahesh Kumar, K., and Ramesh, M.: Ecological study of osmansagar and himayatsagar lakes in greater hyderabad, andhra pradesh, india, 12th World Lake Conference, Taal 2007 Jaipur, India, 2007.
10
Hanumantha Rao, T.: Innivation participation technologies for water harvesting structures & catchment management in semi arid tropics of india, 2nd International Conference on Hy-drology and Watershed Management, Hyderabad, 2006.
Kalpataru Research Foundation, K.: Watershed development, Kalpataru Research Foundation, Report No. 139, 2001.
15
Mar ´echal, J. C., Dewandel, B., Ahmed, S., Galeazzi, L., and Zaidi, F. K.: Combined estimation of specific yield and natural recharge in a semi-arid groundwater basin with irrigated agriculture, J. Hydrol., 329, 281–293, doi:10.1016/j.jhydrol.2006.02.022, 2006.
Masih, I., Maskey, S., Uhlenbrook, S., and Smakhtin, V.: Impact of upstream changes in rain-fed agriculture on downstream flow in a semi-arid basin, Agr. Water Manage., 100, 36–45, 20
doi:10.1016/j.agwat.2011.08.013, 2011.
Ramireddygari, S. R., Sophocleous, M. A., Koelliker, J. K., Perkins, S. P., and Govindaraju, R. S.: Development and application of a comprehensive simulation model to evaluate impacts of watershed structures and irrigation water use on streamflow and groundwater: The case of wet walnut creek watershed, kansas, USA, J. Hydrol., 236, 223–246, 2000.
25
Rientjes, T. H. M., Haile, A. T., Kebede, E., Mannaerts, C. M. M., Habib, E., and Steenhuis, T. S.: Changes in land cover, rainfall and stream flow in Upper Gilgel Abbay catchment, Blue Nile basin – Ethiopia, Hydrol. Earth Syst. Sci., 15, 1979–1989, doi:10.5194/hess-15-1979-2011, 2011.
Rockstrom, J., Falkenmark, M., Karlberg, L., Hoff, H., Rost, S., and Gerten, D.: Future water 30
HESSD
9, 9295–9336, 2012Relating trends in streamflow to anthropogenic
influences
R. Nune et al.
Title Page
Abstract Introduction
Conclusions References
Tables Figures
◭ ◮
◭ ◮
Back Close
Full Screen / Esc
Printer-friendly Version Interactive Discussion
Discussion
P
a
per
|
Dis
cussion
P
a
per
|
Discussion
P
a
per
|
Discussio
n
P
a
per
|
Sakthivadivel, R., Fernando, N., and Brewer, D. J.: Rehabilitation planning for small tanks in cascades: A methodology based on rapid assessment, International Water Management Institute, Colombo, 1997.
Schreider, S. Y., Jakeman, A. J., Letcher, R. A., Nathan, R. J., Neal, B. P., and Beavis, S. G.: Detecting changes in streamflow response to changes in non-climatic catchment conditions: 5
Farm dam development in the murray-darling basin, australia, J. Hydrol., 262, 84–98, 2002. Sharma, B., Amarasinghe, U., Xueliang, C., de Condappa, D., Shah, T., Mukherji, A., Bharati,
L., Ambili, G., Qureshi, A., Pant, D., Xenarios, S., Singh, R., and Smakhtin, V.: The in-dus and the ganges: River basins under extreme pressure, Water Int., 35, 493–521, doi:10.1080/02508060.2010.512996, 2010.
10
Stahl, K., Hisdal, H., Hannaford, J., Tallaksen, L. M., van Lanen, H. A. J., Sauquet, E., Demuth, S., Fendekova, M., and J ´odar, J.: Streamflow trends in Europe: evidence from a dataset of near-natural catchments, Hydrol. Earth Syst. Sci., 14, 2367–2382, doi:10.5194/hess-14-2367-2010, 2010.
Sylvain, M., George, B., Gaur, A., and Nune, R.: Groundwater modelling for sustainable re-15
source management in the musi catchment, India, MODSIM-2007, Christchurch, 1429– 1435, 2007.
Sylvain, M., J ´erome, P., C ´edric, M., Mohamed, W., Subash, C., and Benoit, D.: Percolation efficiency of an artificial tank in semi-arid hard rock aquifer context, South India, International Water Resources Association, 13th World Water Congress, 2008.
20
Teluguntla, P., Ryu, D., George, B. A., and Walker, J.: Impact of spatial scale on remotely sensed evapotranspiration estimates from heterogeneous land surfaces, 19th International Congress on Modelling and Simulation, Perth, 2011.
Van Kirk, R. W. and Naman, S. W.: Relative effects of climate and water use on base-flow trends in the lower klamath basin, J. Am. Water Resour. As., 44, 1035–1052, doi:10.1111/j.1752-25
1688.2008.00212.x, 2008.
HESSD
9, 9295–9336, 2012Relating trends in streamflow to anthropogenic
influences
R. Nune et al.
Title Page
Abstract Introduction
Conclusions References
Tables Figures
◭ ◮
◭ ◮
Back Close
Full Screen / Esc
Printer-friendly Version Interactive Discussion
Discussion
P
a
per
|
Dis
cussion
P
a
per
|
Discussion
P
a
per
|
Discussio
n
P
a
per
|
Table 1.Details of rainfall stations distributed in and around HS catchment.
Rainfall Average
Station
station Latitude Longitude Data Elevation annual
code
name (
◦
) (◦) period (m) rainfall
(mm)
1411122 Kondurg 17.01 78.04 1990–2004 639 645
1412120 Farooqnagar 17.03 78.17 1980–2004 634 700
1413123 Kothur 17.14 78.26 1990–2004 598 625
1414121 Keshampet 16.98 78.33 1990–2004 566 590
1516113 Rajendranagar 17.39 78.40 1980–2004 535 775
1517121 Moinabad 17.31 78.25 1990–2004 607 707
1518117 Chevella 17.32 78.12 1980–2004 627 793
1529122 Pargi 17.12 77.94 1980-2004 720 911
1530128 Pudur 17.23 77.98 1990–2004 677 893
1531119 Shabad 17.18 78.16 1980–2004 646 623
1532116 Shamshabad 17.21 78.38 1980–2004 585 780
HESSD
9, 9295–9336, 2012Relating trends in streamflow to anthropogenic
influences
R. Nune et al.
Title Page
Abstract Introduction
Conclusions References
Tables Figures
◭ ◮
◭ ◮
Back Close
Full Screen / Esc
Printer-friendly Version Interactive Discussion
Discussion
P
a
per
|
Dis
cussion
P
a
per
|
Discussion
P
a
per
|
Discussio
n
P
a
per
|
Table 2.The location details of observation wells in HS catchment.
District name Mandal name Village name Lat Long Elevation
(◦) (◦) (m)
Rangareddy Chevella Alur 17.33 78.07 631
Rangareddy Chevella Chevella 17.13 78.07 642
Rangareddy Shabad Shabad 17.33 78.14 644
Rangareddy Pudur Kandlapally 17.04 78.02 643
Rangareddy Pudur Pudur 17.22 78.99 680
Rangareddy Pudur Peddamrthial 17.22 77.99 636
Rangareddy Pargi Kuduvantapur 17.15 77.90 666
Rangareddy Shamshabad Palmakole 17.19 78.30 572
Rangareddy Shamshabad Peddagollaapally 17.24 78.39 581
Rangareddy Rajendranagar Katedan 17.32 78.44 535
HESSD
9, 9295–9336, 2012Relating trends in streamflow to anthropogenic
influences
R. Nune et al.
Title Page
Abstract Introduction
Conclusions References
Tables Figures
◭ ◮
◭ ◮
Back Close
Full Screen / Esc
Printer-friendly Version Interactive Discussion
Discussion
P
a
per
|
Dis
cussion
P
a
per
|
Discussion
P
a
per
|
Discussio
n
P
a
per
|
Table 3.The watershed development structures within HS catchment extracted from collected data (DWMA).
Check Percolation Mini- Sunken Farm Feeder Gully
Year
dams tanks percolation pits pits/ponds channels control
tanks structures
1995 143 33 – 4 9 7 2788
1997 109 24 – 355 3 4 1149
1998 80 29 105 691 6 76 2190
1999 382 55 2 2504 29 270 2553
2000 8 1 – 3 – – –
2001 5 8 9 178 – 12 –
2002 40 11 27 303 4 3 424
2003 28 – 1 65 20 2 133
HESSD
9, 9295–9336, 2012Relating trends in streamflow to anthropogenic
influences
R. Nune et al.
Title Page
Abstract Introduction
Conclusions References
Tables Figures
◭ ◮
◭ ◮
Back Close
Full Screen / Esc
Printer-friendly Version Interactive Discussion
Discussion
P
a
per
|
Dis
cussion
P
a
per
|
Discussion
P
a
per
|
Discussio
n
P
a
per
|
Table 4.Area-Volume particulars of different watershed development structures collected from the field survey.
Average
Average Average
Structure surface
depth (m) volume
area (m2) (m3)
Check Dams 1000 1.2 1200
Percolation Tanks 1650 3.0 4950
Mini-Percolation Tanks 750 2.0 1500
Sunken Pits 16 1.0 16
Farm Pits/Ponds 28 2.0 56
Feeder Channels 3 0.5 1.5
HESSD
9, 9295–9336, 2012Relating trends in streamflow to anthropogenic
influences
R. Nune et al.
Title Page
Abstract Introduction
Conclusions References
Tables Figures
◭ ◮
◭ ◮
Back Close
Full Screen / Esc
Printer-friendly Version Interactive Discussion
Discussion
P
a
per
|
Dis
cussion
P
a
per
|
Discussion
P
a
per
|
Discussio
n
P
a
per
|
Table 5.Results of trend test on rainfall and streamflows.
Test 1980–2004 1990–2004
Z-statistic p-value Z-statistic p-value
Rainfall Mann-Kendall 0.16 0.87 0.21 0.83
Spearman’s rho 0.25 0.80 0.16 0.87
Streamflows Mann-Kendall −2.07 0.03
HESSD
9, 9295–9336, 2012Relating trends in streamflow to anthropogenic
influences
R. Nune et al.
Title Page
Abstract Introduction
Conclusions References
Tables Figures
◭ ◮
◭ ◮
Back Close
Full Screen / Esc
Printer-friendly Version Interactive Discussion
Discussion
P
a
per
|
Dis
cussion
P
a
per
|
Discussion
P
a
per
|
Discussio
n
P
a
per
|
Table 6.Change in magnitude of streamflows at different time steps.
Percentile Rainfall Streamflow (mm)
(mm) 1980 1990 2000 2004
25th 596 36 25 13 9
50th 693 80 56 30 19
HESSD
9, 9295–9336, 2012Relating trends in streamflow to anthropogenic
influences
R. Nune et al.
Title Page
Abstract Introduction
Conclusions References
Tables Figures
◭ ◮
◭ ◮
Back Close
Full Screen / Esc
Printer-friendly Version Interactive Discussion
Discussion
P
a
per
|
Dis
cussion
P
a
per
|
Discussion
P
a
per
|
Discussio
n
P
a
per
|
Table 7.Average variations in net sown area at different time periods.
Average Average Average
Year rainfed area irrigated area irrigated area (% of NSA) (% of NSA) (% of NSA) (Kharif season) (Kharif season) (Rabi season)
1985–1990 93 7 8
1991–1996 87 13 9
1997–2001 81 19 13
HESSD
9, 9295–9336, 2012Relating trends in streamflow to anthropogenic
influences
R. Nune et al.
Title Page
Abstract Introduction
Conclusions References
Tables Figures
◭ ◮
◭ ◮
Back Close
Full Screen / Esc
Printer-friendly Version Interactive Discussion
Discussion
P
a
per
|
Dis
cussion
P
a
per
|
Discussion
P
a
per
|
Discussio
n
P
a
per
|
Table 8.Groundwater extraction survey particulars during field survey.
Average Average
Number
Number
No. number of number of
of Wells
of Wells GW Status
of samples pumping pumping
used
used
days hours (Kharif Season)
(Rabi Season) per day (Rabi Season)
Safe 10 115 7 All 70 %
Semi-Critical 15 120 7 All 50 %
Critical 15 120 7 All 50 %