Oct. Jour. Env. Res. Vol. 2(2): 168-177
Available online http://www.sciencebeingjournal.com
Octa Journal of Environmental Research
Research Article
MAJOR ION CHEMISTRY OF ASAN RIVERCATCHMENT OF DEHRADUN DISTRICT
(IMPACT ASSESSMENT OF ANTHROPOGENIC SOURCES)
Bahukhandi Kanchan Deoli a and Bartarya S.K b
a. University of Petroleum & Energy Studies,Dehradun, India. b. Wadia Institute of Himalayan Geology, Dehradun India.
*Corresponding author’s Email: kanchan@ddn.upes.ac.in
Received: 14th April 2014 Revised: 15th June 2014 Accepted: 26th June 2014
Abstract: Major ion chemistry of Asan river catchment were studied to find the out the impact of
anthropogenic activities on water quality. Surface and groundwater samples were collected from Asan Catchment, surface water samples were collected from Asan river while ground water samples were
collected from tube wells and hand pumps. The parameters i.e. pH , EC, TDS, SO
2-4, Cl-, NO-3, PO
2-4SO4, HCO-3, total hardness, Ca2+, Mg2+, Na+, K+ were analyzed for studying major ion chemistry of
surface and groundwater of Asan river catchment. Total 38 samples were collected from surface and subsurface water. The physical parameter like temperature, conductivity and pH, DO were measured in the field while for the analysis of remaining parameters, samples were brought in laboratory and analyzed by using standard methods of APHA for water and waste water analysis. Ion- chromatography
were used for the analysis of cations (Ca2+, Mg 2+, Na +, K+) and anions (SO
2-4, Cl-, NO-3, PO2-4, F-).The
ions i.eCa, Na, and HCO3 were found to be dominant ions in surface and groundwater. The average
(Ca+Mg): HCO3 equivalent ratio of 1.4, relatively high contribution of (Ca+Mg) to the total cations (TZ+)
and high (Ca+Mg): (Na+K) equivalent ratio of 9.1 indicate that carbonate weathering is the primary source of major ions to these water. Study result shows that water is slightly acidic to basic in nature.
The EC were ranged from 54.2 to 1353 micro Siemens/, TDS ranged from 91 mg/l to 553 mg/l, HCO3
were ranged from 21.0 mg/l to 366 mg/l and pH were ranged from 6.0 to 8.7. All cations and anions were compared with WHO and BIS Standard of drinking water quality in order to ascertain its suitability for drinking purpose.
Keywords: Asan Catchment; Ion chemistry; Water quality.
Postal Address: Bidholi Campus, Via Prem Nagar, Misraspatti, Dehradun, Uttarakhand- 248007
INTRODUCTION
Water is one of the most important natural
resource for the survival of all living organism.
The chemistry of surface water is governed by
supply of various elements from natural
(chemical
weathering
and
rain)
and
anthropogenic source sewage, industrial effluent,
mining and municipal solid waste) (Semwal
2009). The quality of surface and groundwater is
severely
deteriorating
due
to
increased
urbanization, industrialization and application of
chemical fertilizers for agricultural lands. River
has always been the most important fresh water
resources. Since ancient times river has been
used
for various
sectors
i.e
industry,
Oct. Jour. Env. Res. Vol 2(2): 168-177
169
The concentration of nitrate and chloride is
increased in surface and ground water due
percolation of sewage effluents, industrial waste
and agricultural waste (Hern and Feltz , 1998,
Hao Change, 2002). Hydrochemistry of the
ground water is changed due to rock - water
interaction and oxidation reduction during
percolation of water through aquifers (Krishna
Kumar
et al.
2009). The ionic composition in
glacial melt stream which are located in
Bhagirathi river were studied separately to
observe contribution of ions in the river. The
cations composition in River Bhagirithi was
Ca>Mg > Na > K> NH4 and anions composition
HCO
3> SO
4>Cl> NO
3. (Semwal 2009). The
hydrochemistry of the Himalayan river is
predominantly governed by lithology of the basin
and less commonly by anthropogenic sources.
(Sarin 2005, Semwal 2009). The weathering of
carbonate
rocks,
calcsilicatesandalbite
by
carbonic and sulphuric acid dominated in
Himalayan river basin (Semwal 2006). The
dominance of carbonate rock weathering were
found in the Himalayan river (Singh AK 1992,
1998). The study of major anions (HCO
3, Cl,
SO
4, PO
4, NO
3, F) and cations (Ca, Mg, Na, K)
play a significant role in classifying water quality.
An estimation of poor water quality gives real
pictures for adopting management strategies for
remediation. (Jotimani 2012). The deterioration
of water quality due to industrialization and
urbanization of Dehradun district were studied by
many authors (Dudeja 2010, Bahukhandi 2012,
2011, 2010, 2009, Jain 2002). The study on the
deterioration of water quality in Asan and Tons
river due to anthropogenic sources and industrial
sources was carried by Khan 2013 and found
that abiotic factors have directly affected diversity
of the plankton and resulted decreased
planktonic diversity. The Asan river and its
catchment is contaminating day by day due
discharge of waste
i.e.
sewage waste, solid
waste, agricultural runoff i.e. application of
chemical fertilizer and pesticides in agricultural
land and discharge of industrial effluent s (due to
improper treatment methods) and improper
disposal of hazardous waste. Maximum part of
the Asan river flows through rural area, semi
urban area or slums area and these communities
are using surface and ground water (shallow
hand pump and deep hand pump) for drinking
and irrigation purposes. Increased urbanization in
Dehradun district has posed on immense
pressure on all the resources including water
resources. Contamination of water resources not
only linked with deterioration of water quality but
causes with depletion of water resources and if
present trend continue, there may be water
scarcity in near future. The drinking water
supplied directly from tube well to the villagers
without any drinking water treatment process and
further it is affecting human health and children
are more susceptible to diseases. Apart from
urbanization, the industrial development in Asan
Catchment is also one of the major sources of
surface and ground water pollution. Keeping in
this view it has been purposed to conduct a study
on assessment of anthropogenic activities on
surface and ground water of Asan river
catchment under the following objectives; study
of major ion chemistry of Asan river catchment
and imapct assessment of anthropogenic
sources on surface and ground water.
The study area lies in Asan catchment in
Dehradun district of Uttarakhand (Figure 1).
Dehradun or Doon Valley is the capital city of the
State of Uttarakhand in North India. It is
surrounded by the Himalayas in the north,
Siwalik Hills in the south, the River Ganges in the
east and the River Yamuna in the west. It is
located between 29 ° 58 'and 31 ° 2' 30 "north
latitude and 77 ° 34 '45" and 78° 18' 30 "east
longitude. The Tons River is one of the most
important and largest tributary of the Yamuna
River and flows south-southwest. The River
Asan is another important tributary of River
Yamuna flowing northwest of Doon valley and
latter joins the Yamuna River.
EXPERIMENTAL
Oct. Jour. Env. Res. Vol 2(2): 168-177
170
downstream (Figure 2). The origin point of this
river is from Chandrbani (spring water) in
Dehradun district and joined Yamuna river in
Vikasnager. Total 38 surface and groundwater
samples were collected from Asan Catchment in
the year 2008. Surface water samples were
collected from Asanriverand ground water
samples were collected from tubewell, handpump
and shallow handpump. All surface and ground
water samples were collected in summer season
( Apri- May), winter season (December - Jan)
and post monsoon season (September -
October). Sample were collected in polythene
container, precleaned with 10% reagent grade
nitric acid, followed by rinsing deionized water.
The parameter
i.e
pH, Temperature, DO, EC and
TDS weremeasured in the field with the help of
Multiparameter monitoring Kit and bicarbonate
were measured immediately after collecting the
samples with acid- base titration method using
methyl orange and phenopthelene indicator
(APHA, 1998). Na and K were determined with a
Flame photometer and while silica with the help
of spectrophotometer. The remaining anions and
cations were measured by Ion Chromatography.
Figure 2. Asan river map, Sources (Google)
Figure 3. Geological / Drainage Map of Doon
valley,
(Valdiya, 1980; Joshi, 2003, Dudeja 2010)Oct. Jour. Env. Res. Vol 2(2): 168-177
168 RESULT AND DISCUSSION
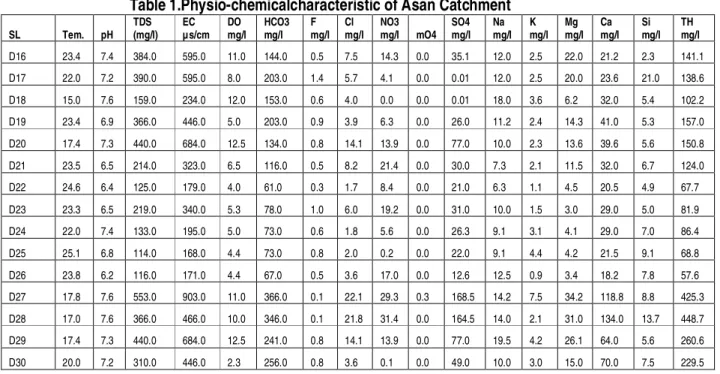
The TDS concentration were ranged from 91 mg/l to 553 mg/l with an average concentration of 254 mg/l while pH value ranged from 6 to 8.7 with an average concentration of 6.8 indicating acidic nature of the water in Assan Catchment of Dehradun district. The concentration of various ions (max, minimum and average value) (Table 1) and their comparison with BIS standards for drinking water quality were shown in (Table 2.). Overall cations and anions concentration shows following trend in the study area.
Overall cations and anions concentration shows following trend in the study area.
HCO3>Ca>SO4>Cl> NO3>Mg>Na >Si > K
>PO4>F. The order of abundance of major
anions are HCO3 (64%)>SO4(23
%)>Cl(6.2%)>NO3 (4.7 %)>F(1.3%)>PO4 (0.01
%) and for major cations in Ca (61 %) > Mg (23%) > Na (13%) > K (3.0%) in Assan
catchment of Dehradun. HCO3 and SO4 are
major anions which together contribute 87 % of total anions while Ca and Mg are major cations, together they account for 84% of cations in surface and ground water of Asan Cathcment. The coefficient of correlations between cations and anions was 0.98, indicating almost all the anions are balanced by caitons (Figure 4).
Figure 4. Equivalent ratio between anions and cations
The bicarbonate constitutes ~71% of the anions and calcium and magnesium constitute respectively 70% and 20% of cations. The
SO4:Cl equivalent ratio is also high (6.8)
indicating leaching of sulphate either from dissolution of gypsum or from oxidation of pyrite or from anthropogenic sources. The
SiO2 concentration ranges from 79.3µ mole/l to
236.05µ mole/l with a mean value of 166µ mole/l. Calcium and magnesium together constitute about 90% of the cations and magnesium and calcium equivalent ratio is 0.3.
Highratio of Na:Cl (2.5) in water of Asan river
suggest less significant contribution of Na from
other than marine source. The ratio of Na+K:
TZ+ is 0.08 indicating the contribution from silicate weathering is limited to 8%. This indicates possibility of Na from anthropogenic source.
Table 1.Physio-chemicalcharacteristic of Asan Catchment
SL Tem. pH
TDS (mg/l)
EC µs/cm
DO mg/l
HCO3 mg/l
F mg/l
Cl mg/l
NO3 mg/l mO4
SO4 mg/l
Na mg/l
K mg/l
Mg mg/l
Ca mg/l
Si mg/l
TH mg/l
D16 23.4 7.4 384.0 595.0 11.0 144.0 0.5 7.5 14.3 0.0 35.1 12.0 2.5 22.0 21.2 2.3 141.1
D17 22.0 7.2 390.0 595.0 8.0 203.0 1.4 5.7 4.1 0.0 0.01 12.0 2.5 20.0 23.6 21.0 138.6
D18 15.0 7.6 159.0 234.0 12.0 153.0 0.6 4.0 0.0 0.0 0.01 18.0 3.6 6.2 32.0 5.4 102.2
D19 23.4 6.9 366.0 446.0 5.0 203.0 0.9 3.9 6.3 0.0 26.0 11.2 2.4 14.3 41.0 5.3 157.0
D20 17.4 7.3 440.0 684.0 12.5 134.0 0.8 14.1 13.9 0.0 77.0 10.0 2.3 13.6 39.6 5.6 150.8
D21 23.5 6.5 214.0 323.0 6.5 116.0 0.5 8.2 21.4 0.0 30.0 7.3 2.1 11.5 32.0 6.7 124.0
D22 24.6 6.4 125.0 179.0 4.0 61.0 0.3 1.7 8.4 0.0 21.0 6.3 1.1 4.5 20.5 4.9 67.7
D23 23.3 6.5 219.0 340.0 5.3 78.0 1.0 6.0 19.2 0.0 31.0 10.0 1.5 3.0 29.0 5.0 81.9
D24 22.0 7.4 133.0 195.0 5.0 73.0 0.6 1.8 5.6 0.0 26.3 9.1 3.1 4.1 29.0 7.0 86.4
D25 25.1 6.8 114.0 168.0 4.4 73.0 0.8 2.0 0.2 0.0 22.0 9.1 4.4 4.2 21.5 9.1 68.8
D26 23.8 6.2 116.0 171.0 4.4 67.0 0.5 3.6 17.0 0.0 12.6 12.5 0.9 3.4 18.2 7.8 57.6
D27 17.8 7.6 553.0 903.0 11.0 366.0 0.1 22.1 29.3 0.3 168.5 14.2 7.5 34.2 118.8 8.8 425.3
D28 17.0 7.6 366.0 466.0 10.0 346.0 0.1 21.8 31.4 0.0 164.5 14.0 2.1 31.0 134.0 13.7 448.7
D29 17.4 7.3 440.0 684.0 12.5 241.0 0.8 14.1 13.9 0.0 77.0 19.5 4.2 26.1 64.0 5.6 260.6
D30 20.0 7.2 310.0 446.0 2.3 256.0 0.8 3.6 0.1 0.0 49.0 10.0 3.0 15.0 70.0 7.5 229.5
Oct. Jour. Env. Res. Vol 2(2): 168-177
169
D31 18.7 6.5 307.0 441.0 3.1 158.0 0.6 15.2 24.4 0.0 57.0 12.0 10.2 12.0 61.3 5.9 196.3
D32 18.8 7.9 405.0 589.0 7.8 305.0 0.6 7.5 13.5 0.0 77.4 8.4 2.4 19.8 95.4 10.4 310.1
D33 21.8 7.0 323.0 466.0 3.1 195.0 0.6 5.1 8.1 0.0 0.01 9.0 2.1 15.2 38.7 13.1 155.2
D34 23.2 6.2 157.0 222.0 2.5 138.0 2.5 1.3 2.1 0.0 0.01 9.0 1.6 6.0 30.0 6.7 96.6
D35 16.4 6.2 251.0 358.0 2.4 176.0 0.5 0.3 0.1 0.0 0.01 4.5 0.9 4.9 43.0 15.2 123.3
D36 20.5 7.7 311.0 449.0 6.6 177.0 0.1 4.8 9.6 0.0 61.2 8.1 2.0 12.3 64.9 12.0 206.2
D37 23.1 6.3 165.0 232.0 3.7 115.0 0.1 0.3 1.9 0.0 0.01 4.5 0.6 2.5 28.0 17.0 77.5
D38 23.4 6.7 195.0 275.0 4.2 145.0 0.1 0.2 0.1 0.0 0.01 5.0 6.7 3.5 18.0 18.0 57.6
D39 21.6 6.7 159.0 221.0 4.3 105.0 0.1 1.9 3.6 0.0 0.01 5.6 0.8 2.6 23.5 21.0 67.1
D40 24.3 6.1 323.0 471.0 2.9 165.0 0.1 3.4 7.2 0.0 32.8 9.5 1.5 8.0 44.0 14.4 138.4
D41 24.3 6.1 323.0 471.0 2.9 176.0 0.1 41.0 41.0 0.0 29.0 33.5 16.0 9.0 55.0 9.1 168.9
D42 23.3 6.0 136.0 190.0 3.4 61.0 0.1 8.6 33.1 0.0 0.01 11.5 2.0 2.6 18.0 15.9 53.9
D43 17.3 7.1 549.0 840.0 2.0 158.0 0.1 57.8 25.5 0.0 44.5 39.5 4.9 9.0 53.3 14.1 164.8
D44 19.9 6.3 296.0 429.0 3.5 68.0 0.1 34.9 33.4 0.0 22.0 15.5 2.5 6.5 34.2 14.3 108.7
D45 22.7 6.3 117.0 165.0 5.7 65.0 0.1 3.2 12.7 0.2 18.1 5.4 0.1 2.0 20.4 17.6 57.2
D46 23.2 6.6 115.0 164.0 4.5 63.0 0.5 2.5 6.5 0.0 20.1 4.4 0.8 3.6 20.4 14.0 63.8
D47 23.7 6.3 99.0 137.0 4.5 58.0 0.1 3.7 0.8 0.0 15.0 4.7 0.7 2.8 16.0 17.6 49.9
D48 23.4 6.1 141.0 195.0 4.3 61.0 2.1 10.7 10.0 0.0 18.0 6.8 0.8 2.2 21.6 18.2 60.9
D49 24.2 6.5 128.0 178.0 4.5 67.0 0.7 2.1 3.0 0.0 30.0 5.1 1.4 1.7 25.2 15.0 67.5
D50 19.5 6.7 91.0 131.0 5.3 49.0 4.1 1.7 2.2 0.0 37.0 5.7 2.4 2.2 22.4 17.1 62.8
D51 17.6 6.4 336.0 451.0 4.7 21.0 0.8 1.8 0.0 0.0 0.9 3.4 0.9 0.5 3.6 16.0 10.7
D52 15.7 8.7 185.0 133.0 6.6 69.0 0.6 5.0 0.3 0.0 2.4 5.9 1.6 1.9 16.5 7.5 47.4
D53 23.8 6.9 247.0 358.0 3.4 63.0 0.9 24.0 6.0 0.0 6.9 4.5 1.0 2.9 29.8 7.6 83.4
Max 25.1 8.7 553.0 903.0 12.5 366.0 4.1 57.8 41.0 0.3 168.5 39.5 16.0 34.2 134.0 21.0 448.7
Min 16.4 6.0 91.0 131.0 2.0 21.0 0.1 1.7 0.0 0.0 0.01 3.4 0.1 0.5 3.6 2.3 10.7
Average 20.9 6.8 254.9 368.3 5.5 136.1 0.7 9.4 11.3 0.0 31.9 10.4 2.8 9.1 38.9 11.4 130.7
SL: Sampling Locations
The pH concentration was found less than 6.5 in almost 13 sampling location indicating acidic nature of the water. The pH beyond the range of 6.5 to 8.5 affects mucus membrane as per IS standard (10500, 1992, 1993). The increase acidic water is possibly attributed to higher
concentration of NO3, K, Cl from anthropogenic
sources mainly due to improper disposal of solid waste, addition of chemical fertilizer due to surface runoff and discharge of industrial effluent into nearby stream or lands. These chemicals contaminate shallow aquifers as well as deep aquifers due to industrial effluent. Higher concentration of fluoride above (1.5
mg/l) can cause flourisis (Wee et al, 2000,
Subba Rao and Naveda, 2003) The florideconcentration has crossed maximum permissible limit of BIS standards of drinking
water quality in two sampling location i.e.
surface water (Asan River) D 48 (2.1 mg/L) and in ground water (boring water) , near industrial area Sidcul, D 50 (4.1 mg/l) which may be attributed to discharge of industrial effluent in nearby river or stream. The determination of TDS concentration is also very important to find out its suitability for irrigation and drinking purposes (Davis and De wiest 1966, Fatters , 1990. Higher concentration of TDS were found at the sampling location of D16 - Badowala (384 mg/l), D19 - Karbari ( 366 mg/l ), D 27 –Chandrabani Spring (553 mg/l), ( mg/l), D- 32 (405 mg/l), D 43 – Redapur(549 mg/l). Two samples have crossed the maximum permissible limit (500 mg/l) of BIS standards of drinking water quality. High concentration of TDS causes gastro-intentional irritation.
Oct. Jour. Env. Res. Vol 2(2): 168-177
170
Table 2. Comparison of Ions with BIS standards for drinking water quality
# Parameter Max Min Average BIS (IS 10500 : 1991)
(Desirable Limit)
BIS(IS 10500 : 1991 (Permissible Limit)
1 Temp. 25.1 16.4 20.5 -
2 pH 8.7 6.0 6.80 6.5 – 8.5 No relaxation
3 TDS 553 91 254 500 mg/l 2000 mg/l
4 EC (µ cs/cm) 903 131 368 - 2250
5 DO 12.5 2.02 5.5
6 Alkalinity (HCO3)
366 21 136 200 mg/l 600 mg/l
7 F 4.1 0.1 0.7 0.6 mg/l 1.2 mg/l 1.5 mg /l
8 Cl 1.7 57.8 9.4 250 mg/l 1000 mg/l
9 NO3 41 0.001 11.3 45 mg /l 100 mg/l
10 PO4 0.3 0.01 0.01 0.3 mg/l (WHO)
11 SO4 0.01 168 31.9 200 mg/l 400 mg/l
12 Na 39.50 3.4 10.4
13 K 16 0.1 2.8 50 mg/l (WHO)
14 Mg 34.2 0.5 9.1 30 mg/l 100 mg/l
15 Ca 134 3.6 38.9 75 mg/l 200 mg/l
16 Si 21 2.3 11.4
17 Hardness 448 10.6 130.7 300 mg/l 600 mg/l
All cations and anions were compared with BIS standards of water quality. Majority of the physical and chemical parameter were found to be under permissible limit of BIS standards for drinking water quality (Figure 5-12)
however few parameters i.e. F, SO4, TDS, pH,
Ca and Hardness crossed the maximum permissible limit of Bureau of Indian Standard (BIS) for drinking water quality at few sampling
locations. The SO4 concentration in study area
varies from 0.01 mg/l to 168 mg/l with an
average value of 31.9 mg/l in winter season. The higher concentration of sulphate were
found in Assan Catchment possibly due to weathering of gypsum bearing carbonate rock of Krol formation present in northern part of Doon valley. The major physic-chemical parameters, which decide the suitability of river water for irrigation, are pH, EC, TDS, Hardness, chloride, sulphate, carbonate, bicarbonate, nitrate, sodium, potassium, calcium magnesium and Sodium Absorption Ratio (SAR) and Permeability Index (PI) etc. The water of the study area was found to be moderate to no problem category for irrigation purposes. 0.00 200.00 400.00 600.00 800.00 B I S A S 4 A S 8 A S 1 2 A S 1 5 A S 1 9 A S 2 3 A S 2 7 A S 3 1 A S 3 5 A S 3 9 A S 4 3 A S 4 7 A S 5 1 A S 5 5 A S 5 9 H C O 3 ( m g / l) Sampling Locations
Figure 5. Comparison of HCO3 anf F with BIS standards for drinking water quality. 0.00 1.00 2.00 3.00 4.00 5.00 B IS A S 4 A S 8 A S 1 2 A S 1 5 A S 1 9 A S 2 3 A S 2 7 A S 3 1 A S 3 5 A S 3 9 A S 4 3 A S 4 7 A S 5 1 A S 5 5 A S 5 9 F m g / l
Sam pling Locat ion
172
Oct. Jour. Env. Res. Vol 2(2): 168-177
171
Figure 6. Comparison of Cl and NO3with BIS standards for drinking water quality.
Figure 7. Comparison of SO4and K with BIS standards for drinking water quality.
Figure 8. Comparison of Mg and Hardness with BIS standards for drinking water quality.
Figure 9. Comparison of TDS and Ca with BIS standards for drinking water quality.
The scatter diagram of (Ca+Mg) verses bicarbonate (Figure 10) shows that almost all of the Ca+Mg in Asan catchment are balanced by bicarbonate. This suggests that the chemistry
of Asan catchment is dominated by weathering of carbonate. This is consistent with the geology of river basin dominated by limestone
Oct. Jour. Env. Res. Vol 2(2): 168-177
172
and dolomite in northern part and Siwalik sandstone in southern part of the valley.
Figure 10. Equivalnet ration between HCO3 and (Ca +Mg).
The Ternary cations plot between (Ca +Mg), Na and K (Figure 11) indicated most of the cations data falls towards (Ca+Mg) vertex and
on a Ternary anions plots that HCO3, SO4 and
(Cl+ NO3+F +PO4) (Figure 12), most of the
data falls towards the HCO3vertex while few
samples falls towards the (Cl+SO4+NO3+F)
suggested the chemistry of the Asan
Catchment is dominant by carbonate
weathering but anthropogenic sources also affecting water chemistry of the region possibly due to improper disposal of waste in Dehradun
city (Bahukhandi, 2012). The SiO2
concentration ranges from 79.3µ mole/l to 236.05µ mole/l with a mean value of 166µ mole/l.
Asan Catchment
K
0 10 20 30 40 50 60 70 80 90 100
(Ca +Mg)
0 10 20 30 40 50 60 70 80 90 100
Na
0 10 20 30 40 50 60 70 80 90 100
Figure 11. Ternary diagram between (Ca +
Mg), Na and K (Cl +PO4 +NO3+F)
A s a n C a tc h m e n t
S O 4
0 1 0 2 0 3 0 4 0 5 0 6 0 7 0 8 0 9 0 1 0 0
H C O 3
0 1 0 2 0 3 0 4 0 5 0 6 0 7 0 8 0 9 0 1 0 0
(C l + P O 4+ NO 3+ F )
0
1 0
2 0
3 0
4 0
5 0
6 0
7 0
8 0
9 0
1 0 0
C o l 1 v s C o l 2 vs C o l 3
Figure 12. Ternary diagram between HCO3,
SO4 and (Cl +PO4 +NO3+F)
CONCLUSION
The average (Ca+Mg)/HCO3 equivalent
ratio of 1.43, HCO3/TZ- ratio of 0.6, relatively high contribution of calcium and magnesium to the total cations TZ + and high 7 ratio of (Ca+Mg) /(Na+K) indicate that the carbonate weathering is primary source of major ions Asan Catchment of Dehradun district. The
parameter such as HCO3, Cl, PO4, Ca, Mg, Na,
are under permissible limit of BIS and WHO standards for drinking water quality. However
the ions, viz. F, K, NO3 and SO4 crossed
permissible limit of BIS standards for drinking water quality at few locations of Asan Catchment. The surface and ground water of the Asan Catchment area were found to be good category for irrigations purposes.
Acknowledgements: Authors are grateful and highly obliged to honorable Dr. S.J Chopra, Chancellor and esteemed Dr. Parag Diwan Vice Chancellor, of University of Petroleum and Energy Studies and Director, Wadia Institute of Himalayan Geology for encouraging me to pursue research and providing special permission to do (carry out) work at Wadia Institute of Himalayan Geology, Dehradun.
Oct. Jour. Env. Res. Vol 2(2): 168-177
173 REFERENCES
A.K. Singh and S. I. Hasnain, (1998). Hydrological Sceinces: Des. Sceinces Hydrogiques, “b” 43 (6):825 –843
Bahukhandi Deoli Kanchan, Siddiqui N.A. (2008). Impact assessment of Urbanization on water quality on Environmental Pollution Control Journal, Nov – December, 2008, Vol 12 No- 1. Bahukhandi Kanchan (2011). Assessment of Water
quality in Dehradun district” In: National
Symposium on Advance in Biotechnological Research in Agri-Horticultural Crops for Sustaining Productivity, Quality Improvement and Food Security on September 14th to 16 , 2011 by Centre of Excellence in Agricultural Biotechnology, at Sardar Vallabhbhai Patel University of Agri. & Tech., Merrut (UP). Bartarya S.K, (1995). Hydrogeology and Water
Resources of Intermontane Doon Valley, Journal of Himalayan Geology, (Wadia Institute of Himalayan Geology), Vol. 6, No. 2 Bartarya S.K, Deoli Kanchan Bahukhandi (2012).
“Impact Assessment of Urbanization and Industrialization on surface and groundwater quality of Dehradun district of Uttarakhand, Global Journal of Engineering, Design and Technology, (Global Institute of Research & Education) 1.(1):11:-22
BIS Standards of drinking water quality, Drinking Water Specification: IS: 10500, 1992 (Reaffirmed 1993)
Davis, S.N. and De Wiest, R.J. (1996). Hydrogeology Newyork, Wiley.
Deoli Kanchan Bahukhandi and Bartarya S.K.
(2011). In International Conference
Proceeding entitled “Hydrochemistry of Surface and Groundwater Haridwar district, Uttarakhand” International Conference on Chemical, Biological and Environmental
Engineering (ICBEE- 2011), 31st December,
2011. Bangalore, organized by IIMT, Bhubaneswar.
Deoli Kanchan Bahukhandi and Bartarya SK (2012). Hydrochemistry of Surface and
groundwater of Doon valley In. proceeding
volume on "Fifth International Groundwater
Conference (IGWCC) organized by
Association of Geologist and Hydrologist at Aurangabad, Maharashtra, Volume 3, Paper No- 74, Pg. 1109-1119.
DudejaDivya, Kuamr Bartarya Suresh, Biyani A.K. (2011). Hydrochemical and water quality assessment of groundwater in Doon Valley of
Outer Himalaya, Uttarakhand, India, Environ Monit Assess.
Fetter, C. W. (1990). Applied Hydology, New Delhi India , CBS Publication and Distributors. Fouzia Ishaq and Amir Khan (2013). Comparative
assessment of physico –chemical condition and Plankton diversity of River Tons and Asan in Dehradun Distrcit of Uttarakhand. Advance in Applied Science Research 4(2):342-355 G. Kanagarj, S.G.D. Sridhar, S. Mahalingam and S.
Natchimuthu (2012). Hydrochemcial Analysis and Evalaution of Groundwater Quality in Parts of Kancheepuram District, Tamilnadu,
India Conferecne Proceeding - Fift
International Groundwater Conference (IGWC – 2012).
Hao, X, Change, C, (2002). Does long term heavy cattle manure application increase salinity of a clay loam in semi arid southern Alberta Agricul . Ecosys. Environ. 1934:1-16.
Hern, J., Feltz, H.R., (1998). Effects of irrigation on the envrionment of selected area of the Western United States and implications to the world population gowth and food prodcution . J. Envriron. Manag. 353 – 360.
Jain, C.K, Bhatia, K.K.K. and Sharma, M.K. (1997). Groundwater quality evaluation in Doon valley, Dehradun, Unpublished report no. CS (AR) 10/96-97, National Institute of Hydrology Roorkee. p.37
Jain, C.K (2002). Ground water quality district Dehradun, National Institute of Hydrology, JalVigyanBhawan, CS(AR) 10/96-97
Jothimani . P, C. Mayilswami, Valliammai A. and
Chellamuthu (2012). Monitoring of
Groundwater quality in the Parambikulam – Aliyar Basin of Tamil Nadu” Conferecne Proceeding - Fift International Groundwater Conference (IGWC – 2012).
Krishnakumar, S. (2004). Quality Charaterization and Geocehmical Charateristics of Lower Gadilum River Basin, Tamil Nadu, India, Dissertation , University of Madras.
N. Semwal and P. Akolkar, (2006). Res. J. Chem and Environ, 10 (2), 54 – 63.
Semwal N and Jangwan JS (2009). Major Ion Chemistry of River Bhagirithi and River Kosi in the Uttarakahnd Himalaya” Int. J. Chem. Sci.: 7 (2), 2009, 607 – 616.
Shiddamallayya N, and Pratima M, (2008). Journal of Environ Bioloy, 29:303 –308.
Oct. Jour. Env. Res. Vol 2(2): 168-177
174
Subbo Rao, N. (2006). Seasonal Varation of ground water qualtiy in part of Guntur district, Andhra Pradesh, India. Environmental Geology.
Source of Support: None.
Conflict of interest: None declared.