D
D
e
e
v
v
e
e
l
l
o
o
p
p
m
m
e
e
n
n
t
t
o
o
f
f
t
t
h
h
e
e
I
I
n
n
t
t
e
e
r
r
n
n
e
e
t
t
W
W
a
a
t
t
e
e
r
r
s
s
h
h
e
e
d
d
E
E
d
d
u
u
c
c
a
a
t
t
i
i
o
o
n
n
a
a
l
l
T
T
o
o
o
o
l
l
(
(
I
I
n
n
t
t
e
e
r
r
W
W
E
E
T
T
)
)
Shane Parson
Dewberry and Davis, LLC
James Hamlett
The Pennsylvania State
University
Paul Robillard
The Pennsylvania State
University
Abstract
Watershed educational and informational efforts have largely neglected to inform one important group of decision-makers: local government offi-cials. The Internet Watershed Educational Tool (InterWET) was developed to help inform local officials about water resources, using as a case study the Spring Creek Watershed in central Pennsylvania. Utilizing the “microworlds” concept, InterWET consists of a set of web pages that present water resource issues and components from different perspectives. Specifically, the components of surface runoff, groundwater flow, detached and delivered sediment, in-stream nutrients, and fish populations are presented from the perspectives of a researcher, a conservationist, and a local offi-cial. In addition to informing local officials, InterWET can also be used as a stand-alone informational resource or as part of larger watershed edu-cational efforts.
Keywords: Watershed, Hydrologic Modeling, Internet, World Wide Web, Microworld, Education.
Introduction
“Think Globally, Act Locally” is one of the most prominent environmental slogans. Yet, environmental education efforts have largely neglected to inform the local officials that make some of the most important decisions regarding water re-source management.
The important decisions concerning water in particular re-gions of the U.S. are often made at the local level, even though water resource management falls under the jurisdiction of federal, state, and local governments and agencies. Federal and state regulations establish standards for water use and treatment, while local officials manage day-to-day zoning changes, housing development approvals, expansion of stormwater and sewage pipes, etc. Federal and state officials who make decisions concerning water resources typically have scientific or environmental backgrounds and work in agencies such as the U.S. Environmental Protection Agency or the state equivalent, where expertise on complex water problems is readily available. In contrast, local officials,
espe-cially those in rural areas, are part-time civic volunteers who often have non-scientific backgrounds and are generally em-ployed by non-governmental companies and businesses. They only meet a few times each month to discuss a variety of local government issues, which may include water resources. A town or county may have a small staff, for example at water supply or sewage treatment facilities, who may give reports and advice to the elected officials, but these individuals do not set policy nor vote on the decisions which affect water re-sources for a community. Hence, local officials need informa-tion to assist them in becoming better informed about the im-pact of their decisions on water issues within their commu-nity.
This paper describes the components of a tool that was devel-oped to help inform local officials about water resources. Specifically, this paper focuses on the design of the Internet Watershed Educational Tool (InterWET) and its application for distributing information about a specific watershed and for general watershed education. InterWET’s design concept for the case study watershed is presented, starting with the ideas and theories used to construct the framework and continuing with the details about the different components. The strategies that were used to apply InterWET to different informational settings are also detailed.
Design Concept for InterWET
The original concept for InterWET arose from work con-ducted in the Spring Creek Watershed in Centre County, Pennsylvania (Figure 1) during 1996. As part of the Susque-Material published as part of this journal, either on-line or in print,hanna River Basin, the watershed drains 381 km2 in the Ridge and Valley physiographic province of central Pennsylvania. Spring Creek flows for a length of 35 km and is nationally known for its trout fishing (Schmalz, 1996). In September 1996, the Spring Creek Watershed hosted the International Countryside Stewardship Exchange. The Exchange, spon-sored by several national environmental organizations (in-cluding the Chesapeake Bay Program) brought a group of international watershed experts to Spring Creek to help local organizations and governments develop a list of the most im-portant water resource issues (International Countryside Stewardship Exchange Steering Committee, 1996a). The ex-perts condensed a large list of issues and concerns raised by local stakeholders into a report that highlighted the most im-portant issues (International Countryside Stewardship Ex-change Steering Committee, 1996b).
The report showed that the community’s watershed issues were not entirely unique or uncommon, but typical of many smaller watersheds throughout the world. The development of InterWET was based around this concept that every local wa-tershed community has its own particular water resource
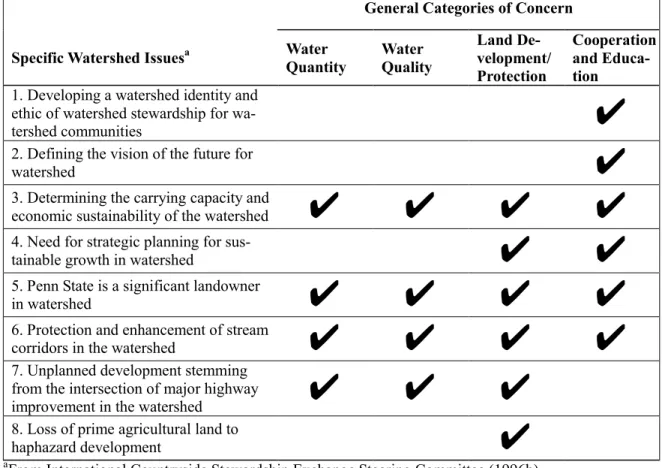
is-sues based on specific problems, but often these isis-sues are common to other watersheds. Table 1 shows the eight major specific issues for the Spring Creek Watershed (International Countryside Stewardship Exchange Steering Committee, 1996b), and combines these issues into four broader catego-ries of concern for water quantity, water quality, land devel-opment/protection, and cooperation and education. InterWET was developed around these four categories of concern, but used the specific Spring Creek Watershed issues as the case study within these categories. This gave InterWET relevancy to local officials making decisions in Spring Creek and other small watersheds.
Abegg, 1996) and to present the available information in a globally consistent format (Khan, 1997). Watersheds have numerous dynamic elements, including stream flow and pol-lutant/water interactions, which can be displayed numerically or spatially with maps. The use of CBI and WBI methods al-lowed InterWET to show this dynamic information. The Internet makes this information globally accessible and, through the use of web browsers, in a format that is stable regardless of the computer platform. This allows local offi-cials to use InterWET from any Internet connected computer without having to produce numerous hard copies and distrib-ute them.
Aside from the technical aspects, InterWET’s format was also designed to have multi-perspective aspects. One’s knowledge about water resources is not solely technical, but depends on one’s perspective. The International Countryside Stewardship Exchange for the Spring Creek Watershed brought out the perspectives of stakeholders such as farmers, land owners, developers, and local officials. Brody (1995), in his develop-ment of the National Project for Water Education for Teachers (Project WET), described this idea as affective knowledge; how people’s beliefs, values, and attitudes differ concerning water. In the development of InterWET, this meant presenting
the technical information for the four categories of concern from the perspective of a local official, and from the perspec-tives of others who deal with the technical aspects of water-sheds, like researchers and conservationists. The information needed to be sufficiently detailed to simulate the real-world within each perspective, but also needed to present basic fun-damentals to avoid overwhelming the understanding of the user.
In order to balance detail with understanding, the “mi-croworlds” concept was used in InterWET. Edwards (1995) defines “microworlds” as computer-based learning environ-ments, “which embody mathematical and scientific concepts in a context which is engaging to the learner, and which al-lows for a certain degree of self-directed exploration or dis-covery of the implicit ideas and processes.” Audet and Abegg (1996) say, “Some computer programs create ‘microworlds,’ which help novices construct conceptual models that include the declarative and procedural knowledge typically mani-fested by experts in a particular ‘knowledge domain.’” For InterWET, the knowledge domain would be the technical wa-tershed knowledge possessed by people from a particular per-spective. These “microworlds” can be further tailored to spe-cific technical topics, like runoff. For example, InterWET
General Categories of Concern
Specific Watershed Issuesa Water Quantity
Water Quality
Land De-velopment/ Protection
Cooperation and Educa-tion 1. Developing a watershed identity and
ethic of watershed stewardship for wa-tershed communities
✔
2. Defining the vision of the future for
watershed
✔
3. Determining the carrying capacity and
economic sustainability of the watershed
✔
✔
✔
✔
4. Need for strategic planning for
sus-tainable growth in watershed
✔
✔
5. Penn State is a significant landowner
in watershed
✔
✔
✔
✔
6. Protection and enhancement of stream
corridors in the watershed
✔
✔
✔
✔
7. Unplanned development stemming from the intersection of major highway improvement in the watershed
✔
✔
✔
8. Loss of prime agricultural land to
haphazard development
✔
a
From International Countryside Stewardship Exchange Steering Committee (1996b).
contains microworlds showing runoff from the researcher per-spective and from the local official perper-spective. While both microworlds deal with the same technical topic, the unique perspectives change how the microworld is constructed and how the information is portrayed. So, the “microworlds” idea was used to develop the technical and multi-perspective as-pects of InterWET for the four categories of concern listed in Table 1 for the Spring Creek Watershed.
Design Framework Description
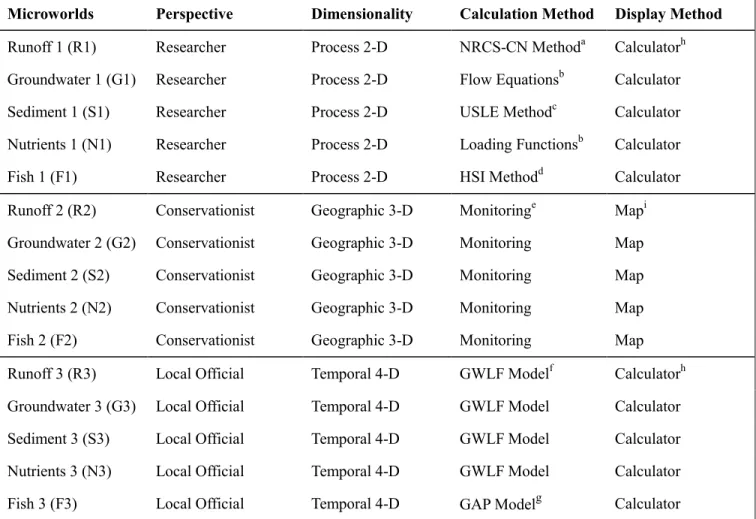
The design framework for InterWET was developed around fifteen different microworlds, shown in Table 2. Each mi-croworld is a combination of one of five water resource com-ponents (runoff, groundwater, sediment, nutrient, fish) and one of three perspectives (researcher, conservationist, local official). These components and perspectives account for the four categories of concern for the Spring Creek Watershed (Table 1) through multiple perspectives from a technical viewpoint. The water resource components directly address the categories of water quantity and quality for Spring Creek Microworlds Perspective Dimensionality Calculation Method Display MethodRunoff 1 (R1) Researcher Process 2-D NRCS-CN Methoda Calculatorh
Groundwater 1 (G1) Researcher Process 2-D Flow Equationsb Calculator
Sediment 1 (S1) Researcher Process 2-D USLE Methodc Calculator
Nutrients 1 (N1) Researcher Process 2-D Loading Functionsb Calculator
Fish 1 (F1) Researcher Process 2-D HSI Methodd Calculator
Runoff 2 (R2) Conservationist Geographic 3-D Monitoringe Mapi
Groundwater 2 (G2) Conservationist Geographic 3-D Monitoring Map
Sediment 2 (S2) Conservationist Geographic 3-D Monitoring Map
Nutrients 2 (N2) Conservationist Geographic 3-D Monitoring Map
Fish 2 (F2) Conservationist Geographic 3-D Monitoring Map
Runoff 3 (R3) Local Official Temporal 4-D GWLF Modelf Calculatorh
Groundwater 3 (G3) Local Official Temporal 4-D GWLF Model Calculator
Sediment 3 (S3) Local Official Temporal 4-D GWLF Model Calculator
Nutrients 3 (N3) Local Official Temporal 4-D GWLF Model Calculator
Fish 3 (F3) Local Official Temporal 4-D GAP Modelg Calculator
a
Natural Resource Conservation Service - Curve Number Method (USDA-SCS, 1986). b
Based on methods used in Generalized Watershed Loading Functions Model (Haith et al., 1992).
c
Universal Soil Loss Equation (Wischmeier and Smith, 1978). d
Habitat Suitability Index for brown trout (Raleigh et al., 1986). e
Monitoring data from EPA STORET Database (US-EPA, 1998). f
Generalized Watershed Loading Functions Model (Haith et al., 1992). g
Aquatic Model from Gap Analysis Program (Bain and Meixler, 1997). h
Calculators developed using JavaScript software (Wooldridge and Morgan, 1997). i
Maps developed using ActiveMaps v2.0 software (InternetGIS.com, 1998).
Watershed. The categories of land development/protection and cooperation and education are encountered indirectly within the microworlds.
Each of the three perspectives is linked to a certain dimen-sionality shown in Table 2. For a researcher like an agricul-tural engineer, the water resource components are seen as in-dividual, two-dimensional processes. A process like runoff might be measured from a small field plot. This can be con-trasted with the perspective of a conservationist from an or-ganization like Trout Unlimited, who is more concerned with the geographic, three-dimensional aspects of water resources. From this perspective, the amount of runoff in watershed streams on a particular day is important. A local official ex-pands this idea to a temporal, or four-dimensional perspective. Not only is the amount of runoff on a particular day impor-tant, but how will local policy choices made today affect av-erage stream flow 10 and 20 years from now. While actual researchers, conservationists, and local officials are concerned with all dimensions in a watershed, they are more likely to deal with information in the dimension they are linked to in InterWET. Assigning a particular perspective to a certain di-mension puts a human face to that didi-mension.
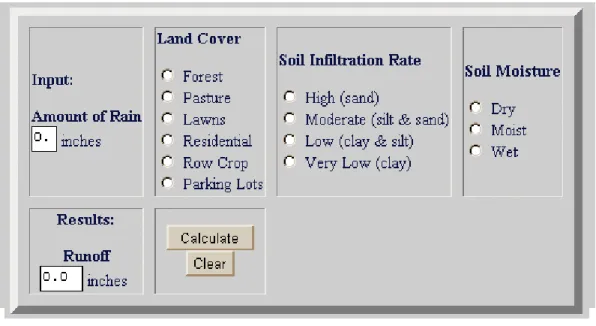
Table 2 also gives details on how each of the microworlds calculate and display information. Going back to the runoff example, Figure 2 shows the calculator display for Mi-croworld R1 (runoff from the researcher perspective). Based on the NRCS-CN method (USDA-SCS, 1986) and developed using JavaScripting (Wooldridge and Morgan, 1997), this cal-culator allows the learner to explore runoff at the process level
and understand how land cover and soil affect runoff levels. All the microworlds from the researcher perspective use simi-lar calculators, based on established calculation methods, which allow learners to see the relationship between different factors and a particular water resource component.
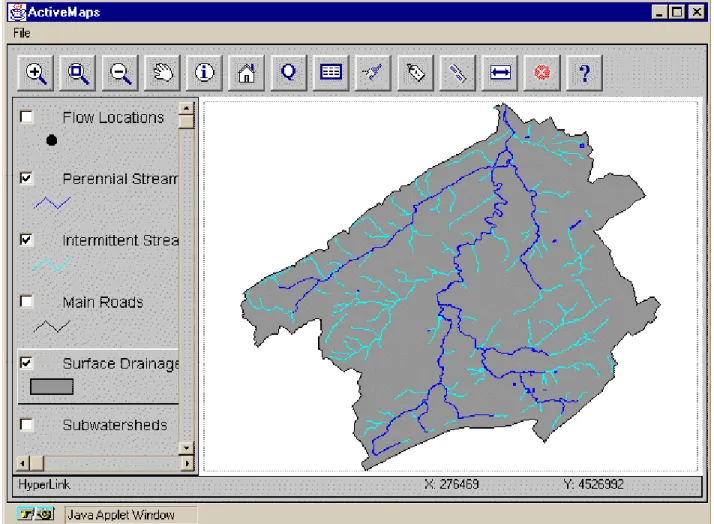
Figure 3 shows an example of a map display for Microworld R2 (runoff from the conservationist perspective). These maps display stream monitoring data from sources including the U.S. EPA (1998) using ActiveMaps software
(Internet-GIS.com, 1998) with links to monitoring data sites. This gives users a geographic view of runoff. From this geographic level, a learner sees each of the water resource components in map form and explores the relationships between location and wa-ter resource.
Finally, calculator displays like Figure 2 can also be used for the temporal or local official perspective. The calculators use JavaScript, but instead of being based on hydrologic theory and methods like the researcher microworlds, they are based on predictions made by models, specifically the Generalized Watershed Loading Functions Model (GWLF) (Haith et al., 1992), and the aquatic model from the Gap Analysis Program (Bain and Meixler, 1997). The temporal perspective makes use of computer models to help predict how current policy choices affect future levels for the different water resource components. Here learners have the ability to pick from a se-lected list of local policies on topics like land development and stream bank protection and are shown how their set of choices may affect each water resource component in the fu-ture.
InterWET is accessible through The Pennsylvania State Uni-versity’s Agricultural and Biological Engineering Depart-ment’s home page for, at
http://server.age.psu.edu/dept/grads/parson/research/home.ht m
Information and Education Theory
used in Design Framework
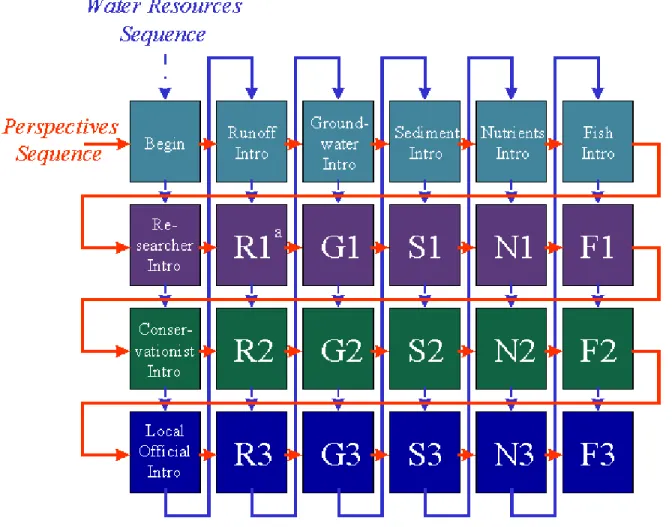
Utilizing these microworlds, InterWET was designed to be self-guided and to have a flexible sequence. The microworlds are the core of a set of web pages that guide a learner through perspective and water resource components, shown in Figure 4. A learner goes through the web pages using one of two mi-croworld sequences. Sequencing in educational curriculum refers to teaching a particular topic at increasingly higher lev-els over the learning time (Brody, 1995). Each microworld has its own unique lesson, but when a learner goes through all the microworlds in either of two certain sequences, larger lessons and ideas are conveyed.The two significant sequences for InterWET’s microworlds are arranged to emphasize the water resource components or the different perspectives. Figure 4 shows a diagram of the order of web pages one would go through for each sequence. For example, the perspectives sequence starts at the beginning web page, proceeds through the pages introducing the water resource components, and then looks at these components one perspective at a time. This sequence emphasizes how a par-ticular perspective addresses all the water resource compo-nents. On the other hand, the water resources sequence takes the learner through InterWET one water resource component at a time, seeing the component from all three perspectives. Here the contrasts between each perspective are brought out.
In both cases, the sequence of the microworlds utilizes the idea of scaffolding. Scaffolding is providing a curriculum that supports learners with varying amounts of starting knowledge on a subject (Collins, 1996). In other words, the curriculum builds upon itself from simple to more complex understand-ing. Understanding of each component relies on the learning from the previous components.
Sequencing and scaffolding are the two primary instruction methods used to accommodate different perspectives and learning styles. McLoughlin (1999) highlights research into designing instructional materials for learners with different learning styles. McLoughlin (1999) states, “Instructional de-sign decisions need to be based not only on desired learning outcomes, but also on motivational, cognitive and volitional views of learning from the learner’s perspective.” Instruc-tional materials need to highlight both unifying and dividing concepts so that a given learner with a particular level of ab-straction on a topic will be open to instruction and will have a better opportunity to learn.
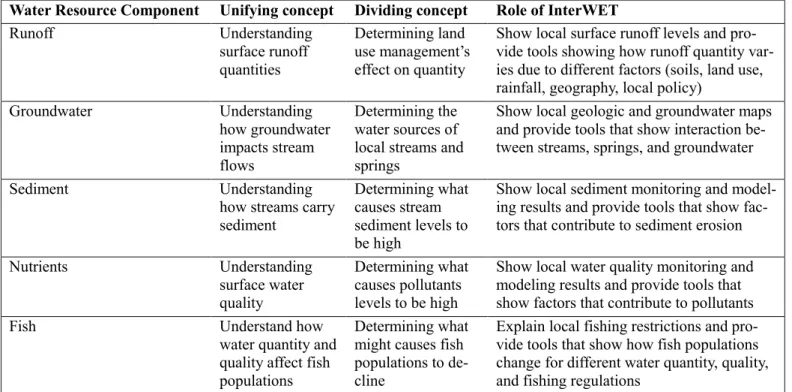
Table 3 shows for each water resource component in Inter-WET the major unifying and dividing concepts and what role of InterWET has in addressing these concepts. The unifying concepts center around the idea of quantity or a level, such as surface runoff quantity or fish populations. The dividing
con-cepts are determining what causes these levels to be a certain value. InterWET attempts to explain these causes through the use of microworlds. Microworlds provide interactive tools that can allow learners to “discover the truth” for themselves of what causes a particular quantity.
This use of an interactive tool with feedback to the learner has been shown in recent literature to be the direction for effective frameworks in Information Science. Spink (2000) details how the most appropriate framework for Informational Science should concern how learners seek, retrieve, and the use infor-mation and emphasizes the use of inforinfor-mational feedback loops. Sims (2000) discussed the role of interactivity in ing theory as the ability to better engage and enhance learn-ing. The InterWET microworlds provide learners with an interactive way to learn new information that is engaging and relevant to their perspective.
a
See Table 2 for code descriptions.
Informing Learners with InterWET
InterWET is designed to inform learners as a self-guided tool or as part of a larger watershed education program for not only Spring Creek Watershed, but other watersheds as well. Self-guided learners can move through InterWET and utilize the structure provided by the two sequences focusing on the different perspectives or water resources. The microworlds from the researcher perspective are based on hydrologic the-ory, and are applicable to all watersheds, not only Spring Creek. While the conservationist and local official perspec-tives are tied to the geography of Spring Creek Watershed, the different skills each perspective employs are important to know from a general watershed informational standpoint.InterWET also can play an important role as part of larger watershed education programs. For Spring Creek Watershed, InterWET provides a technical supplement to existing water-shed education programs conducted by local schools and gov-ernment groups. In the Spring of 2000, schools in State Col-lege and Bellefonte, Pennsylvania (towns in the Spring Creek Watershed) both used InterWET in conjunction with science classes. Students commented that the microworld calculators were like games, where they would try produce the highest runoff or determine what conditions might kill young fish. Other watershed programs, like Water Environment Federa-tion (WEF) Watershed Management Specialty Conference (1998), seek to create awareness of the different perspectives
of watershed stakeholders through role playing. These pro-grams can also benefit from InterWET’s multiple perspectives by adding a technical aspect to this role playing. In educa-tional efforts like those by Liukkonen and Hagley (1998), which focused on educating shoreland owners about their im-pact on water resources, the two-dimensional, process level microworlds in InterWET can help owners understand their impact on water resources.
The concept and framework of InterWET can also provide a model for future research. Research using the existing Inter-WET site could involve evaluation of the effectiveness of the web site through surveys of learners of different ages and educational backgrounds. This evaluation could lead to en-hancement of the existing interfaces and changes to the site design. The framework could also be extended to other topics such as forestry, wetlands, and stream bank stabilization. These are just a few examples of how InterWET could be in-cluded in larger watershed educational efforts and future re-search.
Conclusions
The Internet Watershed Educational Tool (InterWET) pro-vides a valuable resource for informing local government of-ficials by broadening their knowledge and understanding of watershed issues. Each microworld in InterWET gives a “snapshot” of how a researcher, conservationist, or local offi-Water Resource Component Unifying concept Dividing concept Role of InterWET
Runoff Understanding surface runoff
quantities
Determining land use management’s effect on quantity
Show local surface runoff levels and pro-vide tools showing how runoff quantity var-ies due to different factors (soils, land use, rainfall, geography, local policy)
Groundwater Understanding how groundwater
impacts stream flows
Determining the water sources of local streams and springs
Show local geologic and groundwater maps and provide tools that show interaction be-tween streams, springs, and groundwater
Sediment Understanding how streams carry
sediment
Determining what causes stream sediment levels to be high
Show local sediment monitoring and model-ing results and provide tools that show fac-tors that contribute to sediment erosion
Nutrients Understanding surface water
quality
Determining what causes pollutants levels to be high
Show local water quality monitoring and modeling results and provide tools that show factors that contribute to pollutants
Fish Understand how
water quantity and quality affect fish populations
Determining what might causes fish populations to de-cline
Explain local fishing restrictions and pro-vide tools that show how fish populations change for different water quantity, quality, and fishing regulations
cial might view water resources like runoff, groundwater, soil erosion, in-stream nutrients, or fish populations. This “pic-ture” may be in the form of a calculator or an interactive map. These features allow InterWET to help local officials better see all sides for water resource issues and understand the im-pact of their policy decisions on water resources.
InterWET was designed around the case study of the Spring Creek Watershed in central Pennsylvania, but its technical, multi-perspective approach to watershed education is applica-ble to many watersheds. Used by itself, the microworlds in InterWET can provide better understanding and information about water resources for a variety of learners, not only local officials. Furthermore, InterWET can be a valuable supple-ment to existing watershed programs, both as a technical re-source and as a model for new rere-sources. InterWET’s ap-proach to watershed education helps more people, especially local officials, to “Think Globally, Act Locally.”
REFERENCES
Audet, R.H. & Abegg, G.L. (1996). Geographic information systems: Implications for problem solving. Journal of Research in Science Teaching, 33(1), 21-45.
Bain, M.B. & Meixler, M.S. (1997). Application of GAP Analysis to Aquatic Biodiversity Conservation. Accessed on May 1, 2000 at
http://www.dnr.cornell.edu/hydro2/aquagap.htm
Brody, M. (1995). Development of a curriculum framework for water education for educators, scientists, and resource managers. The Journal of Environmental Education, 26(4), 18-29.
Collins, A. (1996). Design issues for learning environments. In Interna-tional Perspectives on the Design of Technology-Supported Learn-ing Environments, ed. S. Vosniadou, E. De Corte, R. Glaser, and H. Mandl, 347-361. Mahwah, New Jersey: Lawerence Erlbaum.
Edwards, L.D. (1995). The design and analysis of a mathematical mi-croworld. Journal of Educational Computing Research, 12(1), 77-94.
Haith, D.A., Mandel, R., & Wu, R.S. (1992). GWLF: Generalized Wa-tershed Loading Functions, Version 2.0, User’s Manual. Ithaca, New York: Department of Agricultural and Biological Engineering, Cornell University.
International Countryside Stewardship Exchange Steering Committee. (1996a). Spring Creek Watershed Community International Ex-change Briefing Materials. State College, Pennsylvania: Clearwater Conservancy.
International Countryside Stewardship Exchange Steering Committee. (1996b). Spring Creek Watershed Community International Ex-change Final Report. State College, Pennsylvania: Clearwater Con-servancy.
InternetGIS.com. (1998). ActiveMaps Version 2.0. Oakton, Virginia: InternetGIS.com.
Khan, B.H. (1997). Web-Based Instruction (WBI): What is it and why is it? In Web-Based Instruction, ed. B.H. Khan, 5-18. Englewood Cliffs, New Jersey: Educational Technology Publications.
Liukkonen, B. & Hagley, C. (1998). Shoreland education – Involving shoreland owners.In Proceedings of the Water Environment Fed-eration 1998 Watershed Management Specialty Conference, 353-360, Denver, Colorado, 3-6 May. Alexandria, Virginia: Water En-vironment Federation.
McLoughlin, C. (1999). The implications of the research literature on learning styles for the design of instructional material. Australian Journal of Educational Technology, 15(3), 222-241.
Raleigh, R.F., Zuckerman, L.D., & Nelson, P.C. (1986). Habitat Suit-ability Models and Instream Flow SuitSuit-ability Curves: Brown Trout. U.S. Department of the Interior, Biological Report 82(10.124). Washington, D.C.: Fish and Wildlife Service.
Roth, W.-M., Woszczyna, C., & Smith, G. (1996). Affordances and constraints of computers in science education. Journal of Research in Science Teaching, 33(9), 995-1017.
Schmalz, R. F. (1996). Water Resources and Hydrogeology of the Cen-tre Region. Prepared for Board Members of the State College Wa-ter Authority with revisions and additions for Centre Region Coun-cil of Governments. Bellefonte, Pennsylvania: Centre County Gov-ernment.
Sims, R. (2000). An interactive conundrum: Constructs of interactivity and learning theory. Australian Journal of Educational Technology, 16(1), 45-57.
Spink, A. (2000). Toward a Theoretical Framework for Information Science. Informing Science, 3(2), 73-75.
U.S. Department of Agriculture - Soil Conservation Service (USDA-SCS). (1986). Urban Hydrology for Small Watersheds. USDA, Technical Release No. 55. Washington, D.C.: U.S. GPO.
U.S. Environmental Protection Agency (U.S. EPA) (1998). STORET.
Accessed May 1, 2000 at http://www.epa.gov/OWOW/STORET/
Water Environment Federation (WEF) Watershed Management Spe-cialty Conference. (1998). Preconference Interactive Watershed Management Workshop. Water Environment Federation 1998 Wa-tershed Management Specialty Conference, Denver, Colorado, 3-6 May. Alexandria, Virginia: Water Environment Federation.
Wischmeier, W.H. & Smith, D.D. (1978). Predicting Rainfall Erosion Losses - A Guide to Conservation Planning. USDA Handbook 537. Washington, D.C.: U.S. GPO.