ISSN 0104-6632 Printed in Brazil
www.abeq.org.br/bjche
Vol. 31, No. 03, pp. 613 - 623, July - September, 2014 dx.doi.org/10.1590/0104-6632.20140313s00002766
Brazilian Journal
of Chemical
Engineering
PERFORMANCE OF A BIOSURFACTANT
PRODUCED BY
Bacillus subtilis
LAMI005 ON THE
FORMATION OF OIL / BIOSURFACTANT /
WATER EMULSION: STUDY OF THE PHASE
BEHAVIOUR OF EMULSIFIED SYSTEMS
M. Sousa
1, I. T. Dantas
1, F. X. Feitosa
1, A. E. V. Alencar
2, S. A. Soares
2,
V. M. M. Melo
3, L. R. B. Gonçalves
1*and H. B. Sant’ana
11
Universidade Federal do Ceará, Departamento de Engenharia Química, Bloco 709, Campus do Pici, CEP: 60455-760, Fortaleza - CE, Brasil.
Phone +55 85 3366-9611, Fax: +55 85 3366-9610; E-mail: [email protected]; [email protected]
2Universidade Federal do Ceará, Departamento de Química Orgânica e Inorgânica,
Campus do Pici, Fortaleza - CE, Brasil.
3
Universidade Federal do Ceará, Departamento de Biologia, Campus do Pici, Fortaleza - CE, Brasil.
(Submitted: June 13, 2013 ; Revised: September 30, 2013 ; Accepted: October 3, 2013)
Abstract - In this study, the phase behaviour of emulsified systems (oil + biosurfactant + water) was analyzed. The biosurfactant was produced in a 4-L batch bioreactor by Bacillus subtilis LAMI005, using residual glycerine from biodiesel production as a carbon source. Fourier Transform Infrared Spectroscopy (FT-IR), Nuclear Magnetic Resonance (NMR), and High Performance Liquid Chromatography (HPLC) analyses demonstrated that the biosurfactant produced by Bacillus subtilis (LAMI005) consists of a lipopeptide similar to surfactin. The influences of temperature and the composition of oil + biosurfactant + water were determined by using phase diagrams. Three types of oil were used, namely: motor oil, hydrogenated naphthenic oil (NH140) and castor bean oil. The emulsified systems were analyzed using optical micrography. The results presented here indicated that the biosurfactant produced in this work presents a potential use as stabilizing agent for oil-in-water emulsions.
Keywords:Biosurfactants; Emulsions; Phase diagrams; Residual glycerol; Bacillus subtilis.
INTRODUCTION
Biosurfactants, one of the main classes of natural surfactants, are metabolic products of microbial origin (bacteria, fungi and yeasts) and exhibit surfactant properties, i.e., reduction of surface tension (Fiechter, 1992). Surfactin is produced by several strains of
Bacillus subtilis (Nitschke and Pastore, 2002; Arima
et al., 1968; Kowall et al., 1998). It is a cyclic peptide, with seven amino acids bound to a β-hydroxy fatty acid chain (which can contain from 13 to 15 carbon
atoms). This structural variability allows for different homologous compounds and isomers to occur (Kowall et al., 1998; Lang, 2002; Kluge et al., 1988; Barros et al., 2007).
614 M. Sousa, I. T. Dantas, F. X. Feitosa, A. E. V. Alencar, S. A. Soares, V. M. M. Melo, L. R. B. Gonçalves and H. B. Sant’ana
Attwood and Florence (1983) define emulsions as heterogeneous systems of a liquid dispersed with another in the form of droplets that are generally larger than 0.1 µm in diameter. The occurrence of the following fundamental requirements is necessary in order for an emulsion to form: the coexistence of two immiscible liquids, sufficient agitation to allow one of the liquids to disperse, and an emulsifying agent (Arnold and Smith, 1992). Temperature is an important factor in stabilizing emulsions, since a higher temperature reduces the viscosity of oil and promotes a difference in density between the aque-ous and oil phases. It also helps to increase the Brownian motion of droplets during the dispersal phase, and aids in the dissolution of emulsifying agents (Arnold and Smith, 1992). Another important factor in emulsion stabilization is the droplet size distribution, which has a direct impact on the viscos-ity of emulsions (Kokal, 2006). The destabilization of emulsions is governed by three main mechanisms, namely: creaming or sedimentation, flocculation, and coalescence. The first two phenomena are charac-terized by the effect of gravity, when the density of droplets and the density of the medium are unequal. Here, the emulsion separates into two distinct layers, with the droplets forming a cream or sediments, and leaving behind a liquid supernatant. The collision of particles can provoke flocculation, which can, in turn, lead to coalescence and the formation of larger globules. Flocculation is characterized by the sepa-ration of droplets. In the case of coalescence, the interfacial film must be interrupted, resulting in eventual rupture (Tadros, 2005).
In the literature, there are studies on the structure and properties of oil-in-water and water-in-oil emul-sions using synthetic surfactants (Friberg et al., 2009; Binks and Rodrigues, 2009; Pichot et al., 2010). However, there is little research on the phase be-haviour of oil-to-water systems emulsified by biosur-factants, notably with the use of surfactin. Therefore, phase diagrams of oil-in-water-in-biosurfactant (sur-factin) were determined, varying the proportion of water/oil. For that, a microscopic technique has been used in order to determine the droplet size in the various systems studied.
MATERIALS AND METHODS
Microorganisms and Conditions of Maintenance
The strain Bacillus subtilis LAMI005, identified by the rRNA 16S sequence and deposited in the Genbank database with the following access number:
FJ413046, was maintained in APGE medium (con-taining: peptone 5.0 g/L, glucose 5.0 g/L, yeast ex-tract 2.5 g/L and Agar 15.0 g/L). The culture was kept on slants, refrigerated at 4 °C and replicated every 60 days.
Experimental Conditions for the Production of Biosurfactants
Culture Medium
The culture medium was prepared according to Móran et al. (2000), with slight modifications. The composition (in g/L) of the medium was: (NH4)2SO4 (1.0); Na2HPO4. 7H2O (7.2); KH2PO4 (3.0); NaCl (2.7); MgSO4. 7H2O (0.6); glycerol (20.0). The me-dium was sterilized in an autoclave at 110 °C for 10 minutes. After sterilization, 0.1% (v/v) of a micro-nutrient solution, previously sterilized by filtration (0.45 µm, Millipore, USA), was added. The compo-sition of the micronutrient solution was also de-scribed by Móran et al. (2000), as follows (in g/L): ZnSO4.7H2O (10.9); FeSO4.7H2O (5.0); MnSO4.H2O (1.54); CuSO4.5H2O (0.39); Co(NO3)2.6H2O (0.25); NaB4O7.10H2O (0.17); EDTA (2.50).
Propagation of the Inoculum
The microorganism was replicated in a Petri plate containing (in g/L): (NH4)2SO4 (1.0); Na2HPO4. 7H2O (7.2); KH2PO4 (3.0); NaCl (2.7); MgSO4. 7H2O (0.6); glycerol (20.0); Agar (15.0), and incubated at 30 °C for 48 hours. After this, three loopfuls of microor-ganisms were transferred to 500 mL Erlenmeyer flasks containing 300 mL of the culture medium to propagate the inoculum. The flasks were incubated in a rotary shaker (Tecnal – TE240, São Paulo, Brazil) at 180 rpm and at 30 °C for 24 - 48 hours.
Production of Biosurfactants in a Continuous Stirred Tank Bioreactor
studied in terms of yield factors, specific substrate uptake rate (qs) and specific product yield (qp), ac-cording to Doran et al. (1995).
Extraction and Purification of the Produced Biosurfactant
The extraction of the biosurfactant from the cul-ture medium was carried out according to Rocha et al. (2009). The cell-free broth was submitted to an acid precipitation procedure, at pH adjusted to 2.0 by the addition of HCl 3 M. The resulting solution was left to rest for 12 hours (overnight) at 4 °C, to allow the precipitation of surfactin, which was collected by centrifugation at 10.000 g for 20 minutes at 4 °C. The precipitate (crude biosurfactant) was re-suspended in 8 mL of distilled water at pH 8.0. Liquid-liquid ex-traction was carried out using equal volumes of sam-ple and dichloromethane (Vetec, São Paulo, Brazil). It was agitated for 5 minutes and left to rest for 1 hour in a funnel to allow phase settling to occur. All of the phases of the solvent were collected in beckers and evaporated at room temperature. The product was re-suspended in 2 mL of methanol (Vetec, São Paulo, Brazil) for later analysis. After filtration by membrane (0.45 μm, Millipore, USA), a purified biosurfactant was finally produced.
Phase Behaviour of Emulsified Systems
The influence of oil and water, and temperature on the stability of the oil + biosurfactant + water emulsion was evaluated by means of pseudo-binary phase diagrams. A solution of biosurfactant in water at pH 8.0 (0.8 g/L), here named the aqueous-phase, was mixed with hydrophobic compounds (motor oil, castor bean oil and NH140 oil) in screw cap test tubes, in different proportions of aqueous solution (ranging from 10 to 50%). These systems were ho-mogenized by using a vortex apparatus for 2 minutes. The screw cap test tubes were exposed to tempera-tures ranging from 30 to 85 °C in a thermostatic bath (Tecnal, model TE-184), and each 10 minutes, the phase behaviour was verified to better observe the phase transitions.
Analytical Methods
Cellular Concentration
Cellular growth was indirectly determined through turbidimetry, using a spectrophotometer (Genesys 20 series) at 600 nm, where biomass (g/L) was deter-mined using a calibration curve of biomass against
optical density (Giro et al., 2009).
Glycerol Concentration
Glycerol was determined by a colorimetric method in order to quantify triglycerides, using an enzymatic kit (Katal Biotecnológica Indústria e Comércio Ltda/ Minas Gerais). This method consisted of adding 2 mL of a colour reagent and 0.02 mL of the cell-free me-tabolite broth sample to a test tube, which was ho-mogenized and placed in a thermostatic bath (Tecnal, model TE - 0541/1) at 37 °C for 10 minutes. Later, the absorbance of the mixture was determined at 500 nm in a spectrophotometer (Spectronic ® 20 Genesys).
Stability of the Emulsion
The stability of the emulsion was determined with a modification of the method proposed by Cooper and Goldenberg (1987). In this analysis, 2 mL of biosurfactant solution in water at pH 8.0 (0.8 g/L) was added to a test tube, containing 2 mL of a hy-drophobic source. This mixture was agitated by vor-tex for 2 minutes and left to rest for 24 hours at 28 °C. After this period, the stability of the emulsion was ascertained visually. In this work, stability was evaluated against different hydrophobic sources, such as: castor oil, motor oil, soy bean oil, gasoline, diesel, hydrogenated naphthenic oils (NH 20 and NH 140), N-hexadecane and kerosene.
Biosurfactant Concentration
The concentration of biosurfactant was deter-mined by High Performance Liquid Chromatogra-phy, coupled with a UV detector (Waters, model 2487) at 205 nm and equipped with a Symmetry C18 reversed phase column (150 x 4.6 mm, 5 μm, Waters, Ireland). The composition of the mobile phase was 20% of trifluoroacetic acid (3.8 mM) and 80% of acetonitrile. The flow rate was 1 mL/min at 30 °C and the volume of sample injections was 20 μL. The samples were quantified using a calibration curve prepared with standard surfactin (95% pure) from Sigma-Aldrich (Yeh et al., 2005). The concentration of biosurfactant was calculated from the chroma-tographic peaks, according to Wei and Chu (1998).
Spectroscopy in the Infrared Region (FT-IR)
616 M. Sousa, I. T. Dantas, F. X. Feitosa, A. E. V. Alencar, S. A. Soares, V. M. M. Melo, L. R. B. Gonçalves and H. B. Sant’ana
and 4000 cm-1, using potassium bromide (KBr) as a support.
Nuclear Magnetic Resonance (NMR) Spectroscopy
The biosurfactant samples, purified by extraction, were analyzed by 1H NMR spectroscopy in a solu-tion of deuterated methanol. The nuclear magnetic resonance spectra were obtained with a Brucker DRX-500 spectrometer operating at a frequency of 500 MHz for 1H.
Optical Micrographs of the Emulsions
Optical micrographs were produced using an
Olympus CH31 microscope (Southall, UK) with an
attached camera and objective lens of 200 X with a resolution of 1024 x 720. Different photographs were taken of each lamina for statistical analysis. Image
Pro 6.0 software (Media Cybernetics) was used to
measure the droplet size distribution (DSD).
RESULTS AND DISCUSSION
Production of Biosurfactant by Bacillus subtilis
LAMI005 in a Bioreactor
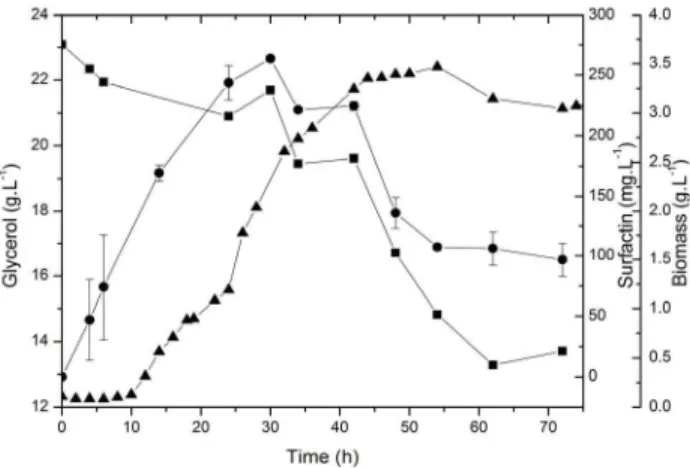
Figure 1 shows profiles of cellular growth (X), biosurfactant production and substrate consumption. From 1n(X) versus time (data not shown), it was observed that the culture reached the stationary phase after 44 hours of cultivation, with a maximum concentration of 3.47 g/L in 54 hours. It should be noted that the exponential phase lasted approxi-mately 8 hours. Thus, a maximum specific cell growth rate (µXmáx) of 0.10 h-1 was found, see Table 1. When studying surfactin production by Bacillus subtilis
MUV4 from glucose, other authors (Suwansukho et al., 2008) obtained the specific growth rate (μXmáx) of 0.14 h-1, which is similar to the value achieved in this work. Observing the production of biosurfactant in Fig. 1, it can be seen that the concentration of biosur-factant increased during the microorganism’s expo-nential phase. In addition, in comparing cellular growth with biosurfactant production using the spe-cific growth rates µX and µP (data not shown), one can conclude that the production of biosurfactant occurred in association with cellular growth. The production of biosurfactant by Bacillus subtilis
LAMI005 reached a maximum value of 263.64 mg/L in 30 hours of cultivation, while a decline in product formation after 72 hours of fermentation was ob-served. In a previous work (Sousa et al., 2012),
Ba-cillus subtilis LAMI005 was cultivated in shake
flasks and a higher concentration of biosurfactant (441.06 mg/L) was achieved after 72 h, using the same glycerin concentration. Due to the agitation rate in comparison with the air flow rate, the system is completely flooded and the oxygen transfer rate is certainly limited during the cultivation process. It is important to mention that, during this process, an important amount of foam is produced. Nevertheless, a by-pass arrangement can be used in order to deal with foam formation by means of a foam collector that guarantees the recirculation of the liquid culture (Giro et al., 2009). These authors (Giro et al., 2009) achieved a maximum concentration of biosurfactant of 232 mg/L in 48 hours, which remained constant until 72 hours, using a mineral medium supple-mented with glucose and fructose. Compared with these results from the literature, the production of biosurfactant by Bacillus subtilis LAMI005 using glycerine was more efficient, since higher concen-trations of biosurfactant were obtained. Kim et al. (1997) studied the production of biosurfactant by
Bacillus subtilis C9 in a mineral and glucose medium and reported that the formation of product was asso-ciated with cellular growth. Neves et al. (2007) also observed the connection between the specific growth rate (μx), the rate of substrate consumption (μs) and the rate of biosurfactant formation (μp) during the cultivation of Bacillus atrophaeus ATCC 9372 in 2.5 g/L of glucose and 10.0 g/L of casein. Desai and Banat (1997) used Bacillus sp. IAF-343 to produce biodispersan and also considered the formation of the product to be associated with cellular growth.
Figure 1: Profiles of cellular growth, production of
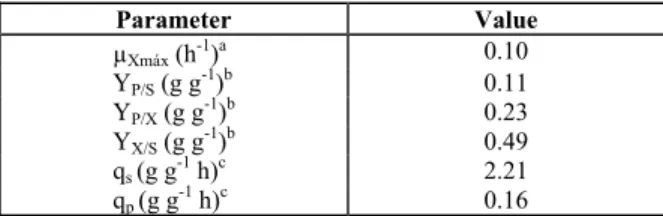
Table 1: Product formation related to substrate
consumption (YP/S) and dry cell biomass (YP/X),
bacterial growth related to substrate consumption (YX/S), specific substrate utilization rate (qs) and
specific product yield (qp) during growth of
Bacil-lus subtilis LAMI005 in a 4-L batch bioreactor at
30 °C, 200 rpm and with 1 L.min-1 aeration.
Parameter Value
µXmáx (h-1)a 0.10
YP/S (g g-1)b 0.11
YP/X (g g-1)b 0.23
YX/S (g g-1)b 0.49
qs (g g-1 h)c 2.21
qp (g g-1 h)c 0.16
a
Calculated at the stationary phase; b
Calculated at 24 h of fermentation;
c
Calculated at 6 h of fermentation
The cultivated strain consumed only 40% of the glycerol present in the culture medium, indicating that the carbon source does not appear to be a limit-ing substrate. A similar result was found by Davis et al. (1999) when they studied the production of sur-factin by Bacillus subtilis ATCC 21332 in a biore-actor. These authors observed a large quantity of residual substrate when they used 30.0 g/Lof glucose as the carbon source. They reported that production was not limited by the carbon source, since the pro-duction of surfactin grew until the end of the fer-menting process, with a maximum concentration of 45.3 mg/L. Table 1 shows the product formation related to substrate consumption (YP/S) and cell bio-mass (YP/X), bacterial growth related to substrate consumption (YX/S), the specific substrate utilization rate (qs) and specific product yield (qp) during growth of Bacillus subtilis LAMI005. The kinetics of biosur-factant production by Bacillus subtilis LAMI005 showed a yield of biomass to substrate (YX/S) of 0.49, a yield of product to substrate (YP/S) of 0.11 and a yield of product to biomass (YP/X) of 0.23. Other au-thors (Suwansukho et al., 2008), studying surfactin production by Bacillus subtilis MUV4 from glucose, obtained similar values to YX/S, YP/S and YP/X of 0.713, 0.072 and 0.101, respectively. Vedaraman and Venkatesh (2011), who studied surfactin production
by Bacillus subtilis MTCC 2423 from glucose and
waste frying oils, determined the yield of biomass based on glucose (g biomass/g substrate) of 0.091, the yield of surfactin based on biomass (g surfactin/g biomass) of 0.23 and the yield of surfactin based on glucose (g of surfactin/g glucose) of 0.021. Accord-ing to Davis et al. (1999), the kinetic parameters of surfactin production by B. subtilis ATCC 21332 may differ depending on the nutritional condition evalu-ated. They observed that YP/X, for instance, ranged from 0.0068 to 0.075 g/g.
Regarding the specific substrate utilization rate (qS) and specific product yield (qP), there are few data reported in the literature. For instance, Raza et al. (2007) studied the production of biosurfactant by a
Pseudomonas aeruginosa mutant using vegetable oil
refinery wastes and obtained qS ranging from 1.20 to 1.26 g g-1 h and qP ranging from 0.42 to 0.60 g g
-1 h.
Structural Characteristics of the Biosurfactant Produced in the Bioreactor
Biosurfactant Concentration
Lipopeptides of Bacillus are classified into three families of cyclic compounds: iturin, surfactin, and fengycin. It is well known that these molecules can strongly affect the surface active properties of the solution (Raaijmakers et al., 2010). At this point our main goal was the use of different techniques (HPLC, FT-IR and NMR) to certify that Bacillus subtilis LAMI005 produced surfactin.
From HPLC analysis, it can be observed that the chromatogram of the biosurfactant sample produced
by Bacillus subtilis LAMI005 showed similar
reten-tion peaks (A, B, C, D, E and F) to those observed with commercial surfactin (Sigma-Aldrich), see Fig. 2.
Infrared Spectroscopy (FT-IR)
Figure 3 shows the FT-IR spectra obtained from commercial surfactin (Sigma-Aldrich standard) com-pared with the biosurfactant produced by using Bacil-lus subtilis LAMI005. This analysis reveals that the biosurfactant produced presents the main characteristic groups of a surfactin molecule, indicating the presence of aliphatic hydrocarbon, as well as a peptide fraction. The most important absorption bands were assigned by comparison with spectra obtained from the literature (Joshi et al., 2008; Lin et al., 1994). In the spectrum shown in Fig. 3, seven main bands can be observed. The absorption band with a maximum of 3307 cm-1 corresponding to the N-H stretch can attributed to peptide residues. Another intense band with maxima of 2958 cm-1 and 2927 cm-1, corresponding to the C–H (CH3) and (CH2) stretch, can be associated with the lipopeptide portion of the molecule. At 1726 cm-1, a medium intensity band is observed that can be re-lated to the absorption of C=O groups from lactoni-zation. At 1651 cm-1, a CO–N stretch points to the amide group. The bands at 1466 cm-1 and 1388 cm-1 indicate aliphatic chains (-CH3,-CH2). These results suggest that the biosurfactant produced by Bacillus
subtilis LAMI005 in a medium containing glycerine
618 M. Sousa, I. T. Dantas, F. X. Feitosa, A. E. V. Alencar, S. A. Soares, V. M. M. Melo, L. R. B. Gonçalves and H. B. Sant’ana
Figure 2: HPLC chromatogram of Sigma-Aldrich surfactin and of extracted biosurfactant sample, respectively.
The final concentration of biosurfactant is equal to the sum of peaks A, B, C, D, E, F.
4 0 0 8 0 0 1 2 0 0 1 6 0 0 2 0 0 0 2 4 0 0 2 8 0 0 3 2 0 0 3 6 0 0 4 0 0 0 0
2 0 4 0 6 0 8 0 1 0 0
138
8
138
8
14
66
146
9
154
1
1541
30
68
3
070
330
7
295
8
2
927
17
26
16
51
104
4
61
9.
9
T
rans
mit
tanc
e (
%
)
W a v e n u m b e r s ( c m- 1)
3
313
2959
2
929
1
729
1652
6
57.
3
1129
Figure 3: Infrared spectra of the Sigma-Aldrich standard surfactin molecule
(dashed line) and of the extracted biosurfactant (line), respectively.
Nuclear Magnetic Resonance (NMR) Spectroscopy
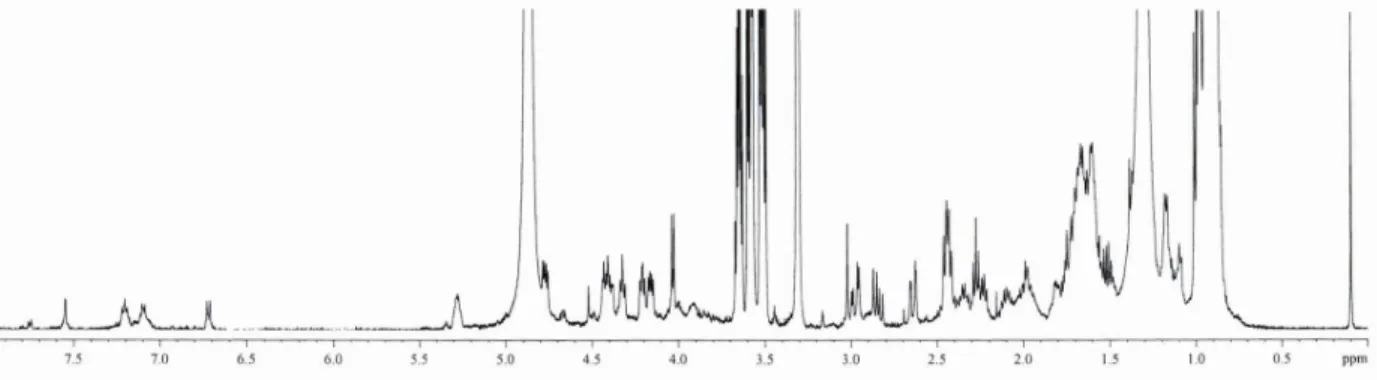
The 1H-NMR spectrum of the biosurfactant iso-lated in this study is shown in Fig. 4. A comparative analysis between the standard sample of commercial surfactin from Sigma-Aldrich (Yeh et al., 2005) and other biosurfactants found in the literature (Lin et al., 1994; Liu et al., 2009) reveals that the main struc-tural characteristics were detected in the isolated bio-surfactant sample, meaning that the structure of the
Figure 4: 1H-NMR spectra of the extracted biosurfactant.
Behaviour of Phase Diagrams
Initially, emulsion stability of the biosurfactant produced by Bacillus subtilis LAMI005 against di-verse hydrophobic sources was evaluated, using as reference the formation of an emulsion with sta-bility during 24 hours at 28 °C. The best results were found by using motor oil, hydrogenated naphthenic oil (NH140) and castor bean oil. It is interesting to note that the biosurfactant presents an effective ac-tivity as an emulsifier agent for oils that show higher viscosity. Furthermore, it is interesting to mention that a shelf life analysis was performed for all oil + water + biosurfactant samples for at least two months. During this period the growth of microorganisms was not observed. This result can be attributed to the lipopeptides that present antimicrobial properties (Fernandes et al., 2007). This find can also be impor-tant for industrial applications, since, in the present case, a unique compound seems to have two impor-tant roles, as emulsifier, as well as antimicrobial agent.
Figure 5 shows the final result of the phase diagram analyses for (biosurfactant–motor oil), (biosurfac-tant–castor bean oil) and (biosurfactant–NH140 oil). The studied systems were formed from an aque-ous-phase (water at pH 8.0 and 0.8 g/L of biosurfac-tant) and an oil phase (motor oil, NH140 oil or castor bean oil). The diagram obtained for motor oil + biosurfactant + water system presents an aqueous-phase for a water cut above 30%. The diagram pre-sents four specific regions, as follow: emulsion + oil (E + O), emulsion (E), emulsion + water + oil (E + W + O), and emulsion + water (E + W). The distribution of these regions depends on temperature and compo-sition of surfactin. It is interesting to note that a sole emulsionated phase is formed at temperatures below 40 °C and surfactin composition until 0.3 v/v. For industrial applications, it could be interesting to work in this region, since phase separation is not observed. The castor oil + biosurfactant + water and NH140 oil
+ biosurfactant + water systems show similar results, with the presence of only two regions (E + W + O and E + W). In these cases, a unique emulsion phase region has not been observed. It can be seen that the separation region between E + W + O and E + W also depends on temperature and surfactin concentration, with an important dependence on temperature. The E + W + O region is larger for castor oil than for NH140 oil. For castor oil + biosurfactant + water the transi-tion phase occurs at a temperature of 70 °C, except for 20% of surfactin. For NH140 oil + biosurfactant + water the temperature transition is reached at T = 80 °C, for surfactin concentration below 0.3 (above 0.4 the transition temperature decreases to 75 °C). This was also observed by Uddin et al. (2001) in a phase diagram for a water-in-surfactant binary sys-tem (Si25C3EO15,8).
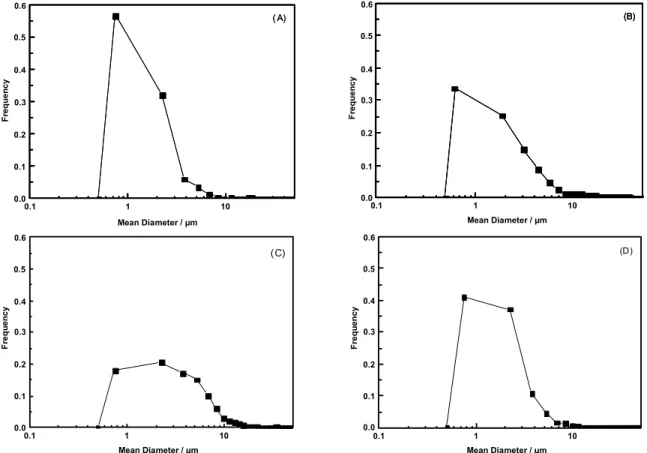
Microscopic measurements were carried out to observe the aspect and size of emulsion particles in phase transition regions for all oil + water + biosur-factant systems. Droplet size was measured immedi-ately after the emulsification process. The droplet size distribution is shown in Fig. 6.
620 M. Sousa, I. T. Dantas, F. X. Feitosa, A. E. V. Alencar, S. A. Soares, V. M. M. Melo, L. R. B. Gonçalves and H. B. Sant’ana
droplets, it is more difficult for coalescence to occur when compared to sedimentation, as the droplets are too small and uniform (Kokal, 2006). In Fig. 6 B, a micrograph of the emulsion produced by the castor bean oil + water + biosurfactant system at 75 °C re-veals more dispersed particles that have larger drop-let diameters between 1 and 3 µm, with a frequency
of 0.2 (20%). For NH140 oil + water + biosurfactant, droplets dispersed in a continuous medium could be observed with a diameter of between 1 and 3 µm at a frequency of 0.4 (Figures 5 C and 6 D). Neverthe-less, it should be noted that in order to determine the dominat destabilization mechanism it would be nec-essary to carry out a kinetic analysis of droplet size.
Figure5: Phase diagrams: effect of temperature and of dispersal of biosurfactant solution with different
0,1 1 10 0,0 0,1 0,2 0,3 0,4 0,5 0,6 F requ enc y
Mean Diameter / μm
( A)
0.1 1 10
Mean Diameter / μm
F re q ue nc y 0.0 0.1 0.2 0.5 0.3 0.6 0.4
0,1 1 10
0,0 0,1 0,2 0,3 0,4 0,5 0,6 F requ enc y
Mean Diameter / μm
( A)
0.1 1 10
Mean Diameter / μm
F re q ue nc y 0.0 0.1 0.2 0.5 0.3 0.6 0.4
0.1 1 10
Mean Diameter / μm
0.1 1 10
0.1 1 10
Mean Diameter / μm
F re q ue nc y 0.0 0.1 0.2 0.5 0.3 0.6 0.4 F re q ue nc y 0.0 0.1 0.2 0.5 0.3 0.6 0.4
0, 1 1 10
0,0 0,1 0,2 0,3 0,4 0,5 0,6 F req u enc y
Mean Di am ete r / μm
(B)
0.1 1 10
Mean Diameter / μm
Fr e q u e n c y 0.0 0.1 0.2 0.5 0.3 0.6 0.4
0, 1 1 10
0,0 0,1 0,2 0,3 0,4 0,5 0,6 F req u enc y
Mean Di am ete r / μm
(B)
0, 1 1 10
0,0 0,1 0,2 0,3 0,4 0,5 0,6 F req u enc y
Mean Di am ete r / μm
(B)
0.1 1 10
Mean Diameter / μm
Fr e q u e n c y 0.0 0.1 0.2 0.5 0.3 0.6 0.4
0.1 1 10
Mean Diameter / μm
0.1 1 10
Mean Diameter / μm
Fr e q u e n c y 0.0 0.1 0.2 0.5 0.3 0.6 0.4 Fr e q u e n c y 0.0 0.1 0.2 0.5 0.3 0.6 0.4
0,1 1 10
0,0 0,1 0,2 0,3 0,4 0,5 0,6 F reque nc y
Mean Diameter / μm
(C)
0.1 1 10
Mean Diameter / μm
F re q ue nc y 0.0 0.1 0.2 0.5 0.3 0.6 0.4
0,1 1 10
0,0 0,1 0,2 0,3 0,4 0,5 0,6 F reque nc y
Mean Diameter / μm
(C)
0.1 1 10
Mean Diameter / μm
F re q ue nc y 0.0 0.1 0.2 0.5 0.3 0.6 0.4
0,1 1 10
0,0 0,1 0,2 0,3 0,4 0,5 0,6 F requ enc y
M ean Diam eter / μm
(D)
0.1 1 10
Mean Diameter / μm
Fr equ e n c y 0.0 0.1 0.2 0.5 0.3 0.6 0.4
0,1 1 10
0,0 0,1 0,2 0,3 0,4 0,5 0,6 F requ enc y
M ean Diam eter / μm
(D)
0.1 1 10
Mean Diameter / μm
Fr equ e n c y 0.0 0.1 0.2 0.5 0.3 0.6 0.4 0.0 0.1 0.2 0.5 0.3 0.6 0.4
Figure 6: Droplet size distributions (DSD). (A) 20% (v/v) of aqueous phase in motor oil emulsion at 40 °C.
(B) 50% (v/v) aqueous phase in motor oil emulsion at 55 °C. (C) 20% (v/v) aqueous phase in castor beans oil emulsion at 75 °C. (D) 30% (v/v) aqueous phase in NH 140 oil emulsion at 82 °C.
CONCLUSION
With respect to the experiments conducted in the 4-L bioreactor, an expressive production of biosur-factant (263.64 mg/L) was observed when compared to the data reported in the literature. Analyses carried out with High Performance Liquid Chromatography (HPLC) showed that surfactin was produced. FTIR and NMR spectra indicated the presence of aliphatic and carbonyl groups, amide bands and –OH/ –NH groups, characteristic of surfactin molecules. It can be concluded that the surfactant produced by Bacil-lus subtilis is a cyclic lipopeptide that is comparable to the commercially available surfactin. These results show a potential application of biosurfactant pro-duced in this work in several industrial sectors, such as bioremediation, waste treatment, and microbial activity. Phase diagrams were determined for the biosurfactant-motor oil, biosurfactant-castor bean oil, and biosurfactant-NH140 systems, which were ob-served using microscopic images of the formed emulsions.
ACKNOWLEDGEMENTS
The authors thank to the Brazilian agencies CNPq, FUNCAP, CAPES for fellowships and financial sup-port, and to CENAUREN-UFC for FT-IR and NMR data.
REFERENCES
Arima, K., Kakinima, A. and Tamura, G., Surfactin, a crystalline peptide lipid surfactant produced by
Bacillus subtilis isolation, characterization and its inhibition of fibrin clot formation. Biochem. Bio-phys. Res. Commun., 31, 488-494 (1968). Arnold, K. E. and Smith, H. V., Crude Oil Emulsion.
In: Bradley, H. B., (Ed.), Petroleum Engineering Handbook, Third Ed. Society of Petroleum Engi-neers, Richardson, 9-12 (1992).
622 M. Sousa, I. T. Dantas, F. X. Feitosa, A. E. V. Alencar, S. A. Soares, V. M. M. Melo, L. R. B. Gonçalves and H. B. Sant’ana
Barros, F. F. C., Quadros, C. P., Júnior, M. R. M. and Pastore, G. M., Surfactina: propriedades químicas, tecnológicas e funcionais para aplicações em alimentos, Quím. Nova, 30, 409-414 (2007). (In Portuguese).
Binks, B. P. and Rodrigues, J. A., Influence of sur-factant structure on the double inversion of emul-sions in the presence of nanoparticles. Colloids Surf. A, 345, 195-201 (2009).
Cooper, D. G. and Goldenberg, B. G., Surface-ative agents from two Bacillus species. Appl. Environ. Microbiol., 53, 224-229 (1987).
Davis, D. A., Lynch, H. C. and Varley, J., The pro-duction of surfactin in batch culture by Bacillus
subtilis ATCC 21332 is strongly influenced by
the conditions of nitrogen metabolism. Enzyme Microb. Technol., 25, 322-329 (1999).
Desai, J. D. and Banat, I. M., Microbial production of surfactants and their commercial potencial. Microbiol. Mol. Biol. Rev., 61, 47-64 (1997). Doran, P. M., Bioprocess Engineering Principles.
Elsevier, 257-296 (1995).
Fernandes, P. A. V., Arruda, I. R., Santos, A. F. A. B., Araújo, A. A., Souto Maior, A. M. and Ximenes, E. A., Antimicrobial activity of surfactants pro-duced by Bacillus subtilis r14 against multidrug-resistant bacteria. Braz. J. Microbiol., 38, 704-709 (2007).
Fiechter, A., Biosurfactants: Moving towards indus-trial applications. Trends Biotechnol., 10, 208-217 (1992).
Friberg, S. E., Al-Bawab, A., Bozeya, A. and Aikens, P. A., Geranyl acetate emulsions: Surfactant as-sociation structures and emulsion inversion. J. Colloid Interface Sci., 336, 345-351 (2009). Giro, M. E. A., Martins, J. J. L., Rocha, M. V. P.,
Melo, V. M. M. and Gonçalves, L. R. B., Clari-fied cashew apple juice as alternative raw mate-rial for biosurfactant production by Bacillus sub-tilis in a batch bioreactor. Biotechnol. J., 4, 738-747 (2009).
Joshi, S., Bharucha, C. and Desai. A. J., Production of biosurfactant and antifungal compound by fer-mented food isolate Bacillus subtilis 20B. Bio-resour. Technol., 99, 4603-4608 (2008).
Kim, H. S., Yoon, B. D., Lee, C. H., Suh, H. H., Oh, H. M., Katsuragi, T. and Tani, Y., Production and properties of a lipopeptide biosurfactant from
Ba-cillus subtilis C9. J. Fermentation Bioeng., 84,
41-46 (1997).
Kluge, B., Vater, J., Salnikow, J. and Eckart, K., Studies on the biosynthesis of surfactant, a lipo-peptide antibiotic from Bacillus subtilis ATCC 21332. FEBS Lett., 231, 107-110 (1988).
Kokal, S. L. Crude Oil Emulsion. In: Lake, L. W., Petroleum Engineering Handbook, Society of Pe-troleum Engineers, Richardson, 533-570 (2006). Kowall, M., Vater, J., Kluge, B., Stein, T., Franke, P.
and Ziessow, D., Separation and characterization of surfactin isoforms produced by Bacillus sub-tilis OKB 105. J. Colloid Interface Sci., 204, 1-8 (1998).
Lang, S., Biological amphiphiles (microbial biosur-factants). Curr. Opin. Colloid Interface Sci., 7, 12-20 (2002).
Lin, S. C., Miton, M. A., Sharma, M. M. and Georgiou, G., Structural and immunological characterization of a biosurfactant produced by Bacillus licheni-formis JF-2. Appl. Environ. Microbiol., 60, 31-38 (1994).
Liu, Y. X., Yang, S. Z. and Mu, B. Z., Production and characterization of a C15-surfactin-O-methyl ester by a lipopeptide producing strain Bacillus
subtilis HSO121. Process Biochem., 44, 1144-1151
(2009).
Morán, A. C., Martínez, A. M. and Siñeriz, F., Quan-tification of surfactin in culture supernatants by hemolytic activity. Biotechnol. Lett., 24, 177-180 (2000).
Neves, L. C. M., Oliveira, K. S., Kobayashi, M. J., Penna, T. C. V. and Converti, A., Biosurfactant production by cultivation of Bacillus atrophaeus
ATCC 9372 in semidefined glucose/casein-based media. Appl. Biochem. Biotechnol., 137, 539-554 (2007).
Nitschke, M. and Pastore, G. M., Biosurfactantes: Propriedades e Aplicações. Quím. Nova, 25, 772-776 (2002). (In Portuguese).
Pichot, R., Spyropoulos, F. and Norton. I. T., O/W emulsions stabilised by both low molecular weight surfactants and colloidal particles: The ef-fect of surfactant type and concentration. J. Col-loid Interface Sci., 352, 128-135 (2010).
Raaijmakers, J. M., Bruijn, I., Nybroe, O. and Ongena, M., Natural functions of lipopeptides from Ba-cillus and Pseudomonas: More than surfactants and antibiotics. FEMS Microbiol. Rev., 34, 1037-1062 (2010).
Rocha, M. V. P., Gomes Barreto, R. V., Melo, V. M. M. and Gonçalves, L. R. B., Evaluation of cashew apple juice for surfactin production by
Bacillus subtilis LAMI008. Appl. Biochem.
Bio-technol., 155, 63-75 (2009).
Suwansukho, P., Rukachisirikul, V., Kawai, F. and H-Kittikun, A., Production and applications of biosurfactant from Bacillus subtilis MUV4. Songklanakarin J. Sci. Technol., 30, 87-93 (2008). Tadros, T. F., Applied Surfactants: Principles and
Applications. First Ed. Wiley-VCH, New York (2005).
Uddin, H. M. D., Rodríguez, C., Watanabe, K., Lopez-Quintela, A., Kato, T., Furukawa, H., Harashima, A. and Kunieda, H., Phase behavior and forma-tion of reverse cubic phase based emulsion in water/poly(oxyethylene) poly(dimethylsiloxane) surfactants/silicone oil systems. Langmuir, 17,
5169-5175 (2001).
Vedaraman, N. and Venkatesh, N., Production of surfactin by Bacillus subtilis MTCC 2423 from waste frying oils. Braz. J. Chem. Eng., 28, 175-180 (2011).
Wei, Y. H. and Chu, I. M. Enhancement of surfactin production in iron-eriched media by Bacillus
subtilis ATCC 21332. Enzyme Microb. Technol.,
22, 724-728 (1998).