*e-mail: [email protected]
Received: 13 August 2013 / Accepted: 10 March 2014
Continuous positive airway pressure setups evaluated at simulated
exercise conditions
Marcelo Vieira Leão Nunes*, Antonio Giannella-Neto, Frederico Caetano Jandre de Assis Tavares
Abstract Introduction: Studies have shown increases in airway opening pressure (Pao) swings and work of breathing (WOB) by different continuous positive airway pressure (CPAP) devices at rest, but few address this issue during exercise. The aim of the present work was to analyze the imposed WOB (WOBi), the apparent resistance (Rapp) and swings of Pao (deltaP) of 3 CPAP assemblies at simulated exercise conditions. Methods: The CPAP measures were obtained from: a commercial CPAP (Assembly 1), a high low CPAP (Assembly 2) and the parallel association of these devices (Assembly 3). In each assembly the spring-loaded positive end-expiratory pressure (PEEP) valve was set to fully opened (mode A) or at the same CPAP pressure (mode B). The exercise protocol simulation, performed manually by a calibrated syringe and a metronome, employed a respiratory frequency of 30 bpm, tidal volume of 2.7 L and inspiratory-to-expiratory ratio of 1. The setups were evaluated at CPAP settings of 5, 10 and 15 cmH2O. Results: The lowest deltaP as well as Rapp and WOBi were obtained with Assembly 3 in mode A with an adjusted CPAP of 10 cmH2O (deltaP=8.1 (0.5) cmH2O, WOBi=1.4 (0.14) cmH2O/L/s, Rapp= 1.3 (0.07) J/s) showed as median (interquartile range). Conclusion: For the conditions studied, the best CPAP setup was obtained with mode A.
Keywords CPAP, Exercise, Imposed work of breathing, PEEP valve.
Introduction
The Continuous Positive Airway Pressure (CPAP) is a ventilatory intervention employed in exercise rehabilitation for patients suffering from chronic obstructive pulmonary diseases or congestive heart failure, as a tool to unload the respiratory muscles and consequently leading to a reduced physiological work of breathing (WOB) (Ambrosino and Strambi, 2004; Keilty et al., 1994; Wittmer et al., 2006).
Among the beneits ascribed to CPAP are the
improvement in oxygenation, the reduction in WOB and also the reduction in left ventricular preload and afterload (Wittmer et al., 2006). Nevertheless, the reduction of WOB decreases as the CPAP swings increase (Gherini et al., 1979).
In theory, during a CPAP intervention, the airway
opening pressure (Pao) should be kept constant
throughout the entire respiratory cycle. However, in practice, usually the Pao decreases during inspiration and increases during expiration, due to the impedance of the device and respiratory circuits (Gherini et al., 1979; Katz et al., 1985). Thus, despite the CPAP intervention may decrease the physiological WOB, it imposes an additional work of breathing (WOBi) spent by the patient to overcome this impedance (Banner et al., 1996). Previous studies have shown that, at rest, Pao swings and WOB depends on the device employed
(Gherini et al., 1979; Katz et al., 1985; Louis et al., 2010). However, few works addressed this issue at exercise conditions.
The aim of the this work is to analyze the load imposed by 3 CPAP assemblies, represented by the WOBi, Rapp and the swings of Pao (deltaP), during exercise simulations.
Methods
The 3 assemblies evaluated for the generation of CPAP comprise a commercial CPAP device, RemRest C1001 (Medical Industries America Inc., USA), named
Assembly 1; a high-low device, Oxy-PEEP (Comercial
Médica, Brazil), named Assembly 2; and the third, the parallel association of the aforementioned devices, through a y-piece, named Assembly 3. The Oxy-PEEP device has a dial to adjust the inspired fraction of O2 (FiO2), which was kept at 95% throughout the experiments.
attached to a mouthpiece, which was connected to a calibrated syringe adjusted to a stroke volume of 2.7 L. A bypass circuit, parallel to the pneumotachograph and intended for in vivo capnometry (not performed in the present work), was also present.
The low rate ( V ) was measured by a differential . pressure transducer 176PC07HD2 (Honeywell, USA)
with an operating range of ±2 cmH2O, connected
to the PTC. The Pao was measured with a pressure
transducer, model 163PC01B48 (Honeywell, USA,
range of –20 to 120 cmH2O). These signals were
ampliied and iltered by a low-pass, 4th order
analog Butterworth ilter with cutoff frequency of
33 Hz by a purpose-built respiratory mechanics module, assembled in the lab especially for research in respiratory mechanics (Pino et al., 2004b). An analog-to-digital data acquisition board USB-6008 (National Instruments, USA), installed on a personal computer, acquired the signals at a sampling rate of 200 Hz through the software DAS (Pino et al., 2004a) running in LabView® 7.1 (National Instruments, USA).
The flow rate was calibrated according to the technique described by Giannella-Neto et al. (1998), and the Pao was calibrated against a reference manometer RT-200 (Timeter Instrument, USA). In all cases, the baselines of the signals were measured prior to the experiments and were subtracted from the signals during off-line processing.
The CPAP pressures were previously adjusted at
zero low. For Assembly 3, the pressure generated
by each device was set independently, also at zero
low. The spring-loaded PEEP valve was employed
in either of two modes: fully opened (Mode A) or adjusted through its built-in dial to the same pressure of the CPAP (Mode B).
The breathing simulation protocol consisted in applying, for each of the 6 combinations of assemblies and modes, a respiratory rate of 30 bpm (respiratory period (RP) of 2.0 s), representing the upper bound expected during exercise (Haverkamp et al., 2005), at an inspiratory-to-expiratory time ratio (TI:TE) of 1. Experimental runs were performed at CPAP pressures of 5, 10 and 15 cmH2O. In each run, 3 trials comprising 30 breathing cycles were performed and the one showing the least mean squared error in tidal volume was chosen for analysis. The breathing cycles were performed without pauses between semi-cycles
(inspirations and expirations). The irst and the last
respiratory cycles of each trial were excluded to avoid artifacts due to cycle detection. The experiments were performed at the sea level, room temperature of about 22 °C.
The signals were processed with routines written in MatLab®, using version 7.5 (R2007b) (Mathworks, USA). In brief, the beginnings of inspirations and
expirations were identiied by zero-crossing of the low signal. The volume was computed by numerical integration of the low rate. The deltaP for each cycle
was calculated as the difference between the mean expiratory Pao and the mean inspiratory Pao:
exp
exp 1
∫ ∫
−
ins
ao ao
I I
ins (k)
I (k + ) I (k)
P (t)dt P (t)dt
(k) (k)
deltaP =
TE TI
(1)
where:
exp − ins
TI = I (k) I (k) (2)
exp 1 − ins
TE = I (k + ) I (k) (3)
and Iins(k) and Iexp(k)are the instants of the beginning k-th inspiration and expiration, respectively. TI and TE are the inspiratory and expiratory periods, respectively.
The WOBi was obtained as:
⋅
⋅ ∫ ao
WOBi(k)= P (t) V (t)dt (4)
A further parameter, the apparent resistance (Rapp), is proposed in this study as an alternative
igure of performance to evaluate the load imposed
by the CPAP setup. The Rapp was estimated as the work of breathing divided by the numerical integral
of low squared: ⋅
⋅ ⋅
⋅ ∫
⋅ ∫
ao
P (t) V (t)dt Rapp(k)=
V (t) V (t)dt
(5)
The inspiratory resistance (Rins) and expiratory resistance (Rexp) were separately calculated as in equations 6 and 7:
⋅
⋅ ⋅
− ⋅
∫
⋅ ∫
ao adjust ins
(P (t) P ) V (t)dt
R (k)=
V (t) V (t)dt
(6)
exp
⋅
⋅ ⋅
− ⋅
∫
⋅ ∫
ao adjust
(P (t) P ) V (t)dt
R (k)=
V (t) V (t)dt
(7)
where:
200
200
−
∫
end ao Iend adjust
I
P (t)dt
P = (8)
and where Iend is the time corresponding the end of the signal and Iend-200 is the time corresponding to one second before the end of the signal during zero
low signal. In the cases of Rins and Rexp, the formulae
include Padjust, which represents the adjusted CPAP pressure and has to be subtracted in the semi-cycle so as to account only for the variations of the pressure
due to low.
All integrals were calculated numerically with the trapezoidal method.
Statistical Analysis
In all statistical tests, the igures of performance
Rapp, WOBi and deltaP were analyzed to evaluate the null hypothesis of equal values. The
Kolmogorov-Smirnov test showed that the igures of performance
did not belong to a normal distribution. They are thus expressed as median (interquartile range), and the medians were employed in the non-parametric statistical tests, where applicable. The median values
of the igures of performance were compared by the
non-parametric one-way analysis of variance (Kruskal-Wallis test) followed by the post-hoc Dunn’s test. Mann-Whitney tests compared Mode A with Mode B at the same pressure and assembly. For each trial, the
igures of performance from the cycles in which VT,
TI or TE were more than 1.5 times the interquartile range distant from the median were excluded from the
statistical analysis. The trials are identiied according
to the assembly, mode and CPAP pressure, e.g. T1B05 meaning the trials performed with Assembly 1, mode
B and CPAP of 5 cmH2O.
Results
Tables 1 and 2 shows the igures of performance for
the trial selected for each test. Considering all groups, the VT error and the RP deviation were less than ± 2%.
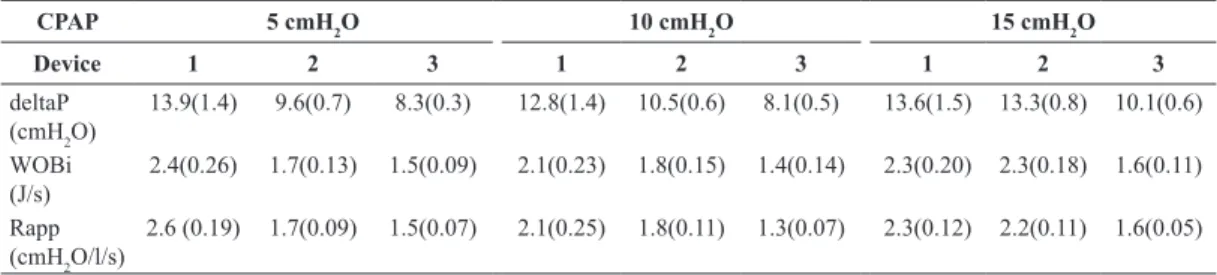
Tables 3 and 4 show the igures of performance
estimated for each device. The highest deltaP was obtained in trial T1B10 (deltaP = 17.4 (1.5 cmH2O)) and the lowest in the trial T3A10 (deltaP = 8.1 (0.5) cmH2O), for which the WOBi as well as the Rapp were also the least.
The statistical analysis suggested the rejection of the null hypothesis of comparison among the 3 Assemblies for each pressure selected to the same mode, as well as of comparison among the 3 pressures for the same assembly in the same mode (p < 0.001)
for all igures of performance analyzed (deltaP, WOBi,
and Rapp). However, the Dunn’s test did not show statistical differences between trials T1A15 and T2A15. Mode A presented better performance than
Mode B, with statistically signiicant differences
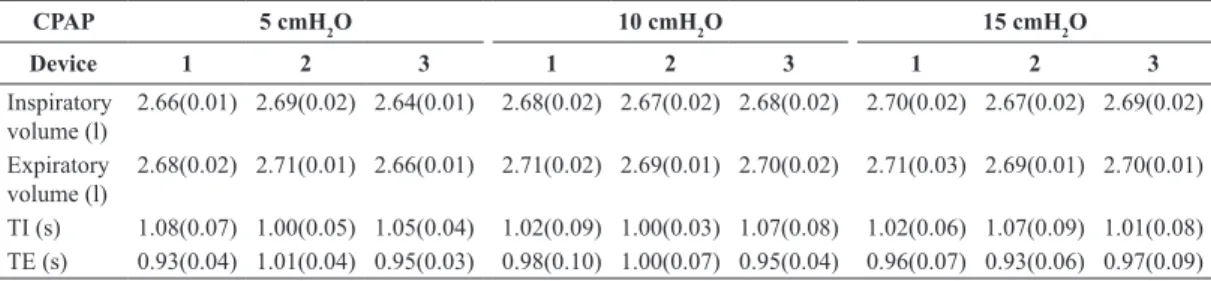
Table 1. Median and interquatile range of the igures of performanceobtained from the trials with PEEP-valve fully opened.
CPAP 5 cmH2O 10 cmH2O 15 cmH2O
Device 1 2 3 1 2 3 1 2 3
Inspiratory volume (l)
2.66(0.01) 2.69(0.02) 2.64(0.01) 2.68(0.02) 2.67(0.02) 2.68(0.02) 2.70(0.02) 2.67(0.02) 2.69(0.02)
Expiratory volume (l)
2.68(0.02) 2.71(0.01) 2.66(0.01) 2.71(0.02) 2.69(0.01) 2.70(0.02) 2.71(0.03) 2.69(0.01) 2.70(0.01)
TI (s) 1.08(0.07) 1.00(0.05) 1.05(0.04) 1.02(0.09) 1.00(0.03) 1.07(0.08) 1.02(0.06) 1.07(0.09) 1.01(0.08) TE (s) 0.93(0.04) 1.01(0.04) 0.95(0.03) 0.98(0.10) 1.00(0.07) 0.95(0.04) 0.96(0.07) 0.93(0.06) 0.97(0.09)
Table 2. Median and interquatile range of the igures of performance obtained from the trials with PEEP-valve set as the same value of
CPAP pressure.
CPAP 5 cmH2O 10 cmH2O 15 cmH2O
Device 1 2 3 1 2 3 1 2 3
Inspiratory volume (l)
2.64(0.02) 2.65(0.03) 2.67(0.02) 2.67(0.02) 2.69(0.04) 2.71(0.02) 2.66(0.01) 2.69(0.02) 2.66(0.02)
Expiratory volume (l)
2.66(0.02) 2.67(0.03) 2.69(0.02) 2.69(0.02) 2.70(0.04) 2.72(0.02) 2.68(0.01) 2.70(0.03) 2.68(0.02)
for all igures of performance, except for deltaP for
Assembly 3 at 15 cmH2O and WOBi for Assembly 2
at 15 cmH2O.
Figure 2 shows the Box-whisker-plot of WOBi for all trials. It is evident from this plot that the WOBi was minimal for Assembly 3 for all groups (p < 0.001, compared to Assembly 1 and Assembly 2). The other
2 igures of performance, deltaP and Rapp, presented
the same pattern.
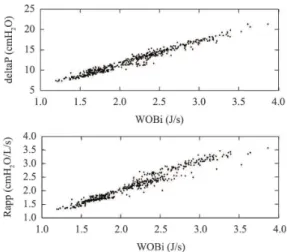
Figure 3 presents the scatter plot of WOBi versus deltaP (upper panel) and WOBi versus Rapp (lower panel). A high degree of correlation was found, ranging from 0.69 to 0.97 for WOBi versus deltaP, except for Assembly 2 in Group5B (r = 0.47) and from 0.80 to 0.94 for WOBi versus Rapp, with the same exception (r = 0.45).
A high degree of correlation was found between
WOBi and TI for most of the trials, (median and
interquartile range of (-0.70 (0.30)), whilst the same did not occurs for WOBi and TE (–0.042 < r < 0.03). Figure 4 shows that Rins was higher than Rexp in all cases. The resistances seen in Mode A were lower
than in Mode B, except at 15 cmH2O.
Discussion
The main results of this study were: in simulated exercise conditions, the WOBi is reduced when the the spring-loaded PEEP valve is fully opened (mode A); there is a high correlation among WOBi, deltaP and Rapp, possibly allowing for an indirect estimation of WOBi by monitoring only deltaP.
The results showed Pao swingswith amplitudes
in the order of magnitude of the CPAP level
during exercise simulations and the presence of
a subatmospheric inspiratory Pao was usual (see
Tables 3 and 4). This characteristic must be considered and avoided since it has been reported by Gherini et al.
(1979) that the luctuations of Pao impacts directly
into WOB.
The assemblies in Mode A presented a reduction in Pao swings, possibly due to the decreased spring-loaded PEEP valve resistance. In fact, according to Banner et al. (1988), the best valves for CPAP applications are the threshold resistor valves with Table 3. Median and interquatile range of the igures of performance evaluated with the PEEP-valve fully opened.
CPAP 5 cmH2O 10 cmH2O 15 cmH2O
Device 1 2 3 1 2 3 1 2 3
deltaP (cmH2O)
13.9(1.4) 9.6(0.7) 8.3(0.3) 12.8(1.4) 10.5(0.6) 8.1(0.5) 13.6(1.5) 13.3(0.8) 10.1(0.6)
WOBi (J/s)
2.4(0.26) 1.7(0.13) 1.5(0.09) 2.1(0.23) 1.8(0.15) 1.4(0.14) 2.3(0.20) 2.3(0.18) 1.6(0.11)
Rapp (cmH2O/l/s)
2.6 (0.19) 1.7(0.09) 1.5(0.07) 2.1(0.25) 1.8(0.11) 1.3(0.07) 2.3(0.12) 2.2(0.11) 1.6(0.05)
Table 4. Median and interquatile range of the igures of performance evaluated with the PEEP-valve set as the same value of CPAP pressure.
CPAP 5 cmH2O 10 cmH2O 15 cmH2O
Device 1 2 3 1 2 3 1 2 3
deltaP (cmH2O)
17.0(1.3) 11.4(0.3) 9.4(0.9) 17.4(1.5) 13.7(1.1) 9.8(0.5) 16.7(1.2) 14.1(1.2) 10.3(0.8)
WOBi (J/s)
3.0(0.30) 2.2(0.12) 1.7(0.25) 3.0(0.35) 2.3(0.22) 1.7(0.08) 2.8(0.21) 2.4(0.30) 1.7(0.19)
Rapp (cmH2O/l/s)
3.1(0.21) 2.1(0.08) 1.6(0.12) 3.1(0.27) 2.3(0.14) 1.6(0.16) 2.9(0.14) 2.4(0.23) 1.8(0.09)
low low resistance. However, Mode A setup may
not constitute a general solution since some CPAP generators may not deliver high CPAP pressures with the spring-loaded PEEP valve fully opened. For each assembly considered, the WOBi in Mode A was dependent on the applied CPAP and this effect was less prominent in Mode B.
Katz et al. (1985) described a substantial variation in WOBi dependent on the CPAP device. They examined 8 different CPAP generators at 0, 10 and
20 cmH2O with sinusoidal low rates set to 20, 40
and 60 L/min and a VT of 500 mL. In the presence
of delivered gas low rates higher than the patient’s inspiratory low rate, the circuit resistance during
inspiration was negligible. They also described that the clinical implications for the wide WOBi changes, seen in different CPAP systems, may be relevant only for patients with compromised respiratory mechanics
or high inspiratory low demand. Indeed, the Assembly
3, consisting in the parallel association of two devices, presented the minimal Rins (see Figure 4). Since the
present protocol ixed the ventilatory demand in all
cases, possibly the Assembly 2 in Mode A had a
reduction in delivered gas lowat increased CPAP
levels (see WOBi changes in Figure 2).
The WOBi ranged roughly from 25 to 50 % of the magnitude of corresponding physiologic WOB, as reported by Guenette and Sheel (2007) for normal subjects at 70% of VO2máx. This suggests that the burden of the CPAP device may represent a large portion of the total WOB.
Taking into account that VT was ixed in the
present study, the cycle-by-cycle variations of TI
or TE changed the corresponding mean low rate. Changes in inspiratory low demand, related to TI,
could have led variations in Rins, whereas changes in TE did not produce equivalent variations in Rexp (see Figure 4). In our experimental setup, the variations
in deltaP, Rapp and WOBi presented a signiicant
correlation with TI, not with TE, possibly because Rins was greater than Rexp in all cases, and due to the large variation of Rins, as mentioned previously.
The strong degree of correlation among WOBi, Rapp and deltaP may allow the use of deltaP as an estimator of WOBi. The continuous acquisition of the deltaP signal is straightforward and the beginning
of inspirations and expirations may be identiied by
the intercept of the pressure signal with the CPAP
present for zero low rate condition, available with
a pause maneuver.
It is important to comment that many studies employing prescribed CPAP in exercise protocols did not refer to the measurement of Pao (Keilty et al., 1994; Wittmer et al. 2006), and the level and stability of the applied CPAP may rest unknown. On the other side, the work of Petrof et al. (1990) reported the range of the swings of the applied CPAP, certainly a more realistic and quantitative description of the procedure. As seen in this study and in the literature, the Pao swings are directly related to the CPAP device system as well as to the demand of the subject. Thus, comparisons of functional or clinical CPAP prescriptions must consider the actual conditions of
use and it is not appropriate and suficient to report
only the ideal CPAP level.
An alternative solution to decrease the Pao swings, described by Favre et al. (2003), is a closed-loop control of Pao by employing a proportional valve
regulating the low rate demand.
Figure 3. Scatterplot between WOBi and deltaP (Upper panel) or Rapp (Lower panel) for all trials performed by the six groups.
Some sources of uncertainty of the present study, like the calibration performed in absence of a positive pressure, the changes in VT, TI and TE resulting from the manual strokes of the syringe and the method to estimate Padjust, do notseem to invalidate the main
indings of the present work; nevertheless, they may
be evaluated in further studies, for instance by using an automated syringe.
In conclusion, as expected, Assembly 3 presented the best performance in terms of WOBi and deltaP. Mode A (spring-loaded PEEP valve fully opened) showed better performance than Mode B (spring-loaded valve adjusted for the desired pressure) for
all assemblies. The quantiication of CPAP swings
may be useful to estimate the WOBi. In vivo studies
are required to conirm the present results.
Acknowledgements
Authors wish to thank the technician Luciano T. Kagami for the support in this study. CNPq, CAPES
and FAPERJ provided partial inancial support.
References
Ambrosino N, Strambi S. New strategies to improve exercise tolerance in chronic obstructive pulmonary disease. European Respiratory Journal. 2004; 24(2):313-22. http://dx.doi.org/ 10.1183/09031936.04.00002904
Banner MJ, Downs JB, Kirby RR, Smith RA, Boysen PG, Lampotang S. Effects of expiratory low resistance on inspiratory work of breathing. Chest. 1988; 93(4):795-9. PMid:3280260. http://dx.doi.org/10.1378/chest.93.4.795
Banner MJ, Kirby RR, Blanch PB. Differentiating total work of breathing into its component parts: Essential for appropriate interpretation. Chest. 1996; 109(5):1141-3. PMid:8625657. http://dx.doi.org/10.1378/chest.109.5.1141
Favre AS, Jandre FC, Giannella-Neto A. Closed-Loop Control of a Continuous Positive Airway Pressure Device.In: Annual International Conference of the IEEE Engineering in Medicine and Biology Society: Proceedings of the 25th Annual International Conference of the IEEE Engineering in Medicine and Biology Society; 2003; Cancun. IEEE Engineering in Medicine and Biology Society; 2003. p. 141. PMid:12767802. http://dx.doi.org/10.1109/IEMBS.2003.1279696
Gherini S, Peters RM, Virgilio RW. Mechanical work on the lungs and work of breathing with positive end-expiratory pressure and continuous positive airway pressure.
Chest. 1979; 76(3):251-6. http://dx.doi.org/10.1378/ chest.76.3.251
Giannella-Neto A, Bellido C, Barbosa RB, Vidal Melo MF. Design and calibration of unicapillary pneumotachographs. Journal of Applied Physiology. 1998; 81(1):335-43.
Guenette JA, Sheel AW. Physiological consequences of a high work of breathing during heavy exercise in humans. Journal of Science and Medicine in Sport; 2007; 10(6):341-50. PMid:17418638. http://dx.doi.org/10.1016/j. jsams.2007.02.003
Haverkamp HC, Dempsey JA, Miller JD, Romer LM, Eldridge MW. Physiologic basis of respiratory disease. Hamilton: PMPH USA; 2005.
Katz JA, Kraemer RW, Gjerde GE. Inspiratory work and airway pressure with continuous positive airway pressure delivery systems. Chest. 1985; 88(4):519-26. PMid:3899530. http://dx.doi.org/10.1378/chest.88.4.519
Keilty SEJ, Ponte J, Fleming TA, Moxham J. Effect of inspiratory pressure support on exercise tolerance and breathlessness in patients with severe stable chronic obstructive pulmonary disease. Thorax; 1994; 49(10):990-4. PMid:7974316 PMCid:PMC4752349(10):990-4. http://dx.doi. org/10.1136/thx.49.10.990
Louis B, Leroux K, Boucherie M, Isabey D, Grillier-Lanoir V, Fauroux B, Lofaso F. Pressure stability with CPAP devices: A bench evaluation. Sleep Medicine. 2010; 11(1):96-9. PMid:19892594. http://dx.doi.org/10.1016/j. sleep.2009.02.011
Petrof BJ, Calderini E, Gotfried SB. Effect of CPAP on respiratory effort and dyspnea in severe COPD. Journal of Applied Physiology. 1990; 69(1):179-88. PMid:2203722.
Pino AV, Kagami LT, Jandre FC, Giannella-Neto A. DAS - Um programa de aquisição e processamento de sinais para engenharia pulmonar. In: Congresso Latino Americano de Engenharia Biomédica: Anais do III Congresso Latino Americano de Engenharia Biomédica, 2004, João Pessoa. João Pessoa: SBEB, CORAL, IFMBE; 2004a. v. 5, p. 765-8.
Pino AV, Carvalho AR, Lima F, Bozza FA, Salluh J, Ascoli F, Soares JHN, Jandre FC, Giannella-Neto A. Controle automático da ventilação mecânica para minimizar a lesão pulmonar induzida pela ventilação. Revista Brasileira de Engenharia Biomédica. 2004b; 20(2-3):89-95.
Wittmer VL, Simoes GM, Sogame LC, Vasquez EC. Effects of continuous positive airway pressure on pulmonary function and exercise tolerance in patients with congestive heart failure. Chest. 2006; 130(1):157-63. PMid:16840396. http://dx.doi.org/10.1378/chest.130.1.157
Authors
Marcelo Vieira Leão Nunes*, Antonio Giannella-Neto, Frederico Caetano Jandre de Assis Tavares