The inluence of grouting and reinforcement ratio in
the concrete block masonry compressive behavior
Inluência do graute e da taxa de armadura no
comportamento à compressão da alvenaria de blocos
de concreto
a Universidade Estadual Paulista “Júlio de Mesquita Filho” - UNESP, Faculdade de Engenharia de Ilha Solteira, Departamento de Engenharia Civil, Ilha Solteira-SP, Brasil; b Universidade Federal de São Carlos – UFSCar, Departamento de Engenharia Civil, São Carlos-SP, Brasil.
Abstract
Resumo
This paper presents an experimental investigation on the compressive strength and stress-strain curves of concrete block masonry with varying block and grout strengths and reinforcement ratio. The three-block prisms, built with 8.5 and 15.0 MPa blocks, were tested hollow and illed with 17.0 and 30.0 MPa compressive strength grouts. In addition, prisms and walls with reinforcement rates of 0.15%, 0.40% and 1.0 % were also tested. With the results, it was possible to measure the compressive strength and stress-strain behavior of masonry with inclusion of different grout and reinforcement components, giving parameters for better evaluation of their performance and design. Among the conclusions, it was observed that increasing the compressive strength of masonry is not proportional to the increase of the grouting area and the eficiency of reinforcement to increase compressive strength is low. Stress-strain curves for the several materials combinations are made available.
Keywords: concrete blocks, reinforcement, masonry, compressive strength, stress-strain curve.
Este trabalho apresenta uma investigação experimental do comportamento estrutural, resistência à compressão axial e deformabilidade, da alve-naria de bloco de concreto em função da variação da resistência dos blocos e graute e da taxa de armadura. Os prismas de três iadas de altura, construídos com blocos de 8,5 e 15,0 MPa, foram ensaiados ocos e preenchidos com grautes de 17,0 e 30,0 MPa. Além destes, também foram ensaiados prismas e paredes armadas com taxas de 0,15%, 0,40% e 1,0%. Com os resultados foi possível mensurar a variação da resistência e os diagramas tensão-deformação da alvenaria com a inserção destes componentes (graute e armadura), fornecendo parâmetros para melhor avaliação de seu desempenho para projeto. Entre as conclusões, pode-se airmar que o aumento da resistência à compressão das alvenarias não é proporcional ao aumento de área pelo grauteamento e que é baixa a eiciência da presença de armaduras para aumento da resistência a compressão. São disponibilizados os diagramas tensão-deformação para as várias combinações de materiais.
Palavras-chave: blocos de concreto, armadura, alvenaria estrutural, resistência a compressão, curva tensão-deformação.
J. S. CAMACHO a
B. G. LOGULLO a
G. A. PARSEKIAN b
P. R. N. SOUDAIS a
1. Introduction
Everyday, the construction of high structural masonry buildings, with greater spans and higher load, becomes more frequent. Ma-sonry elements are then subject to high load with high load resis-tance demand in walls and columns.
However, many important issues in the masonry research remains unanswered. The theoretical analysis of the masonry structural system yields a large number of variables, given that it is a system with plates and shells composed of non-homogeneous materials and nonlinear behavior [1].
In reinforced masonry, the interference between different materials are even greater. The insertion of grout and rebar increases the num-ber of variables uncertain. At a certain point, the unknowns on the masonry structural behavior cause some insecurity and inhibit its use. The compatibility of all components involved in the production of masonry (block, mortar, grout and rebar) is paramount and essen-tial to maximize and optimize their performance, taking advantage of all the system’s potential. This compatibility is only possible with knowledge of the material characteristics and the physical and me-chanical phenomena developed in the masonry under service and ultimate loadings [2].
Several reports of experimental tests on concrete and ceramic blocks ([3], [4], [5]) indicate that it is not valid to simply add a grout-ed area to the hollow ungroutgrout-ed section to determine the prism strength. According to [6] incomplete consolidation of the grout, plastic and drying shrinkage, incompatibility between block and grout deformation and geometric factors may explain this effect. Regarding the reinforcement ratio, the 1989 version of the Brazilian standard for structural concrete blocks masonry design [7], allowed a small increase in the masonry compressive strength with the re-bar presence. However, the allowable compression stress in the rebar was limited to 62 MPa. In practice this speciication resulted in very small eficiency of including rebar to increased compressive strength. The 2011 version of the same standard [8] eliminates the possibility of using rebar to increased compression resistance. The main cause of this low eficiency in walls under compression load is the lack of providing stirrups to tie laterally the longitudinal rebar [6]. The use of stirrups in walls is not the common practice.
On the masonry stress-strain curves, Eurocode [9] indicates the curve on Figure 1, with an masonry failure strain equal to 0.0035 blocks for Group 1 and 0.002 for Group 2 and 3, wherein the Group blocks 1 are the maximum void volume of 25% (perforated ma-sonry) and Group 2 blocks between 25% and 50% (includes hollow blocks). Other standards admit the following values:
n BS 5628-part 2 – 1995 [10] = 0.0035 (all masonry types). n MSJC (2011) [11] = 0.0035 (clay masonry) ou 0.0025 (concrete
masonry).
n S304. 1-04 [12] = 0.0030 (all masonry types). n AS 3700-1998 [13] = 0.0035 (all masonry types).
Tests reported in [14] indicates the stress-strain diagram of Figure 2, with failure strain equal to 0.002 for concrete blocks.
According to [6] “from the observation that the maximum failure strain varies between 0.0020 and 0.0035 for prisms with concrete and ceramic blocks, the adoption of an average value of 0.0030 for the national standards would be appropriate, as speciied in the Canadian code”.
The main objective of this paper is to present a study on the behav-ior of concrete hollow block masonry with variable grout and rebar use. Parameters are measured to assess the increase of structural masonry resistance in the presence of grout and rebar, as well as the behavior of materials at rupture, providing information to aid in the understanding of this composite material behavior and to better calibrate design models in the ultimate limit state .
1.1 Justiicative
Masonry buildings in are built in Brazil in heights and boldness conceptions not usually seen in other parts of the world. The in-crease in masonry elements strength capacity demand, in partic-ular compression strength, is noticeable. Recently, an effort was made to update the Brazilian codes regarding concrete blocks masonry design, with elements now designed within the ultimate limit state criteria. Thus, experimental studies that contribute to the
Figure 1 – Design masonry stress-strain
curve as Eurocode [9]
better understanding of elements composed by different combina-tions of blocks, mortar, grout and rebar are fully justiied.
2. Materials and experimental program
2.1 Concrete blocks
The concrete blocks have dimensions of 14 cm x 19 cm x 29 cm, regular block, and 14 cm x 19 cm x 14 cm, half block (width x height x length) with two block strength tested, designated B1 and B2. The test results indicated compression strengths of 8.64 (B1) and 15.76 (B2) MPa with their net areas shown in Table 1.
Tests were performed according to NBR 12118 [15]. The blocks were capped with gypsum plaster in the proportions 1: 0.6 (plaster : water). Dial gauges, electrical strain gauge and load cells were used to measure the stress-strain diagram. Figure 3 illustrates the test scheme and Table 1 shows the results.
2.2 Prisms
The prisms were built with three blocks and pre-mixed mortar with mix proportions in volume of 1: 0.5: 4.5 (cement: lime: sand), with
a/c ratio equal to 1.27, and following the procedures described by NBR 15961- 2 [16] for the two classes of blocks.
Two grout strengths of 17 and 30 MPa were tested, with slumps of 200 ± 30 mm, named G1 and G2, respectively, which were com-bined with each block strength. Thus, the grout and block combina-tion in prism testing are B1-G1 and B1-G2, B2-G1 and B2-G2, and also hollow prisms for each class of blocks B1 and B2.
Three reinforcement ratios were tested, r1, r2 e r3, combined with grouted prisms cited above. The rebar sizes and grouts mix pro-portions are shown in Table 2. Prism capping are the same as the blocks.
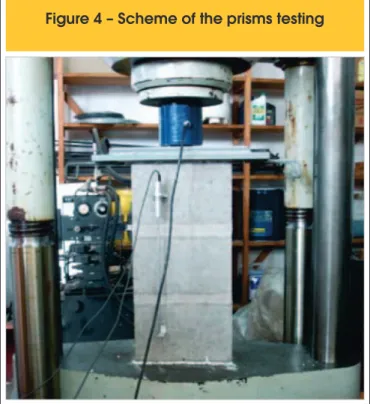
The axial compression resistance tests were also performed using dial gauges, electrical strain gauges and load cells. Table 3 sum-marize results and Figure 4 presents the prisms test scheme.
Table 1 – Results of blocks characterization testing
Block Humidity (%) Absorption (%) Net area (cm
2)
[Net/gross area]
B1 24.93 6.86 227.92 [0.57]
B2 41.34 4.79 289.67 [0.71]
Block Strength (Gross area) (MPa)
CV (%)
Strength (Net area) (MPa)
CV (%)
Failure strain (‰)
B1 8.64 7.39 15.39 7.39 3.30
B2 15.76 8.88 22.09 8.88 1.60
Table 2 – Mortar, grout and rebar
characteristics
Specimen Average strength (MPa) Mix propotions (by weitght) w/c ratioMortar 7.0 1:0.34:6.39 1.27
Grout G1 17.0 1:1.83:2.17 0.67
Grout G2 30.0 1:1.20:1.80 0.55
Reinforcement ratio
Rebar area
(cm²) # Rebar diameter
r1 = 0.15% 0.63 2 Ф 6.3 mm
r2 = 0.4% 1.60 2 Ф 10.0 mm
r3 = 1.0% 4.00 2 Ф 16.0 mm
2.3 Walls
Small walls with dimensions of 100 cm x 90 cm (height x length, three blocks long and ive courses high), were assembled and tested using the two classes of blocks. Walls were built with the two block strengths.
The mortar, grout and rebar used were the same adopted in the prisms, with the difference that in the walls only one type of grout was used, G1, as this grout showed higher eficiency in the prism testing. The walls building procedures followed NBR 8949 [17]. In-strumentation and gypsum capping were similar to the prism testing. Table 4 summarize the results and Figure 5 show the test assembling.
3. Results and discussion
3.1 Prisms
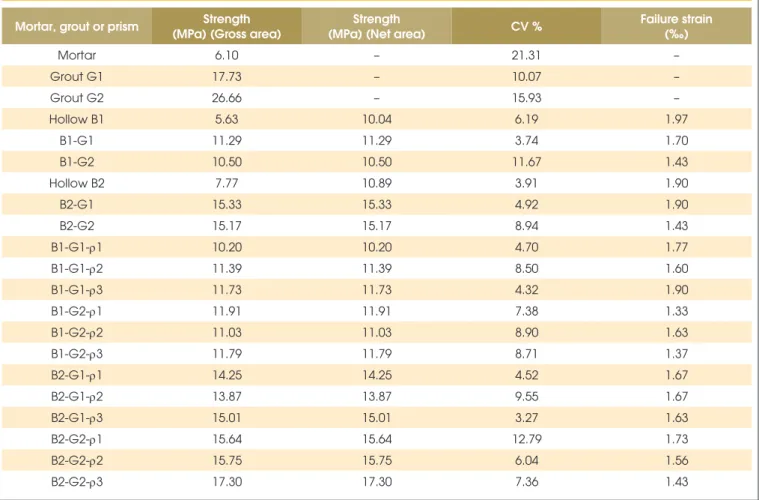
Table 4 presents the prism strength results of all combinations, which shows a signiicant increase in the grouted prisms strength when compared to the hollow prisms results (compared to gross area). However, increasing the grout strength accounted for minor variations in prism strength, a fact conirmed by other authors such as [18], [19], [20], [21].
Looking at reinforced prisms results, signiicant variations in the masonry resistance with increasing steel area are not observed. Table 3 shows the results of the prisms in the net area of un-reinforced but grouted prisms of the two block strengths. It is observed that, considering the resistance in the net area, hol-low prism B1 resistance substantially matched with the grout-ed prism, while the hollow prism B2 resistance was increasgrout-ed about 50% after grouting. This can be explained by the thicker block-wall thickness of B2 resulting in a lower area of grout. The B2 thicker block walls are more resistant to inner transverse expansion of the grout, which will also deform less because of its smaller area.
Comparing the results of the prisms with the same blocks and grout type and varying only the reinforcement ratios (Table 3), there is an average increase observed for prism with block B1 when com-pared to B2. However, comparing different reinforcement ratios for the same block and grout type did not show an increased propor-tional to the reinforcement ratio and only a very small resistance increase to the unreinforced prism is noted.
Strain-strain curves of the hollow and grouted unreinforced and reinforced prisms are plotted in Figures 6 to 11, with stressed cal-culated in the gross and net area. Figure 6 shows the B1-prisms curves, in which one veriies that grouted prisms G1 and G2 show
Table 3 – Results for mortar, grout and hollow, unreinforced and reinforced grouted prism testing
Mortar, grout or prism Strength (MPa) (Gross area)
Strength
(MPa) (Net area) CV %
Failure strain (‰)
Mortar 6.10 – 21.31 –
Grout G1 17.73 – 10.07 –
Grout G2 26.66 – 15.93 –
Hollow B1 5.63 10.04 6.19 1.97
B1-G1 11.29 11.29 3.74 1.70
B1-G2 10.50 10.50 11.67 1.43
Hollow B2 7.77 10.89 3.91 1.90
B2-G1 15.33 15.33 4.92 1.90
B2-G2 15.17 15.17 8.94 1.43
B1-G1-r1 10.20 10.20 4.70 1.77
B1-G1-r2 11.39 11.39 8.50 1.60
B1-G1-r3 11.73 11.73 4.32 1.90
B1-G2-r1 11.91 11.91 7.38 1.33
B1-G2-r2 11.03 11.03 8.90 1.63
B1-G2-r3 11.79 11.79 8.71 1.37
B2-G1-r1 14.25 14.25 4.52 1.67
B2-G1-r2 13.87 13.87 9.55 1.67
B2-G1-r3 15.01 15.01 3.27 1.63
B2-G2-r1 15.64 15.64 12.79 1.73
B2-G2-r2 15.75 15.75 6.04 1.56
a close behavior with each other and with hollow prisms with re-spect to its net areas.
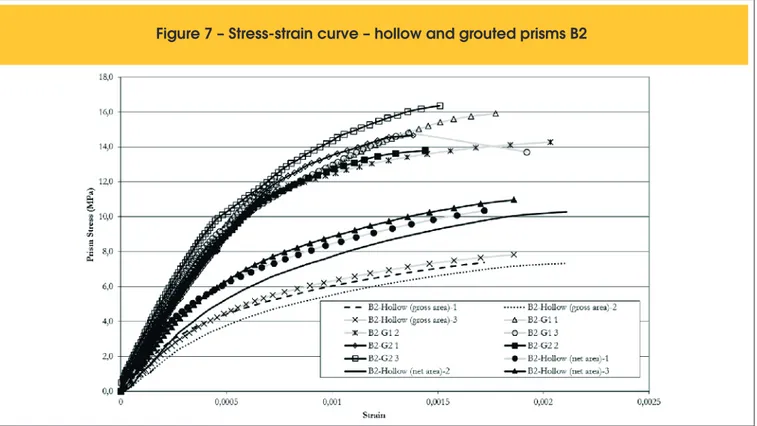
Figure 7 shows the B2-prisms curves. Grouted prisms G1 and G2 show initial deformation similar to the ungrouted prism. The failure
strain is also similar although at higher stresses.
Figures 8 to 11 show the reinforced prisms curves including the four combinations of block and grout. The curves are similar re-gardless the reinforcement ratios.
3.2 Walls
Table 4 shows the mean strength of the hollow ungrouted and the unreinforced and reinforced grouted walls. armed and grouted. The
Figure 4 – Scheme of the prisms testing
Table 4 – Results hollow, unreinforced
and reinforced grouted wall testing
Wall
Resistance (MPa) (Gross area)
CV % Failure strain (‰)
Hollow B1 4.39 2.58 1.35
B1-G1 7.86 4.52 1.35
Hollow B2 8.19 0.09 1.80
B2-G1 15.17 4.88 1.00
B1-G1-r1 9.32 11.61 1.25
B1-G1-r2 9.50 13.55 1.25
B1-G1-r3 9.11 5.51 1.05
B2-G1-r1 13.93 3.27 0.95
B2-G1-r2 15.86 0.72 0.90
B2-G1r3 17.31 16.44 0.70
hollow and the unreinforced grouted wall with B1 blocks resulted in similar net area strength. For the B2 walls, there is an increase of 30% in the unreinforced grouted wall strength at net area.
Several authors, e.g. [22], concluded that the percentage increase
in compressive strength of grouted walls in relation to hollow un-grouted walls is inversely proportional to the increased block resistance. It should be noted here that the geometry of blocks (thickness of the block wall) are different on blocks B1 and B2, so
Figure 6 – Stress-strain curve – hollow and grouted prisms B1
direct comparison is not suitable. What can be comment is that thicker block-walls provided greater increase in resistance when fully grouted, possibly because failure occurs by lateral expansion of the blocks due to the lateral deformation of the stiffer inner grout
and thicker walls have better resistance to the lateral expansion. The variation of reinforcement ratios (r1, r2 e r3) on B1-walls did
not lead to variation in the resistance of the walls, with an in-crease of about 18% observed for all reinforcement ratios when
Figure 8 – Stress-strain curve – reinforced prisms B1-G1
compared to the unreinforced walls. In examining the wall failure strain, one can see that there is not enough deformation to yield the steel. For example, with the rebar area of 1.89 cm² area (area relative to r1), steel elastic modulus equal to 21 GPa and the wall
of the breaking strain of 1.0 ‰, one obtains a rebar force equal to 39.7 kN very small value (about 2.6%) compared with the wall failure load in the order of 1500 kN. Thus, the observed increase in reinforced B1 walls is related to the change in the failure mode
Figure 10 – Stress-strain curve – reinforced prisms B2-G1
(which occurs by lateral expansion of the block due to the expan-sion of the inner grout) than the rebar contribution on carrying part of the failure load.
In the reinforced B2-walls, results do show a strength variation
with the reinforcement ratio variation. However, for small diam-eter bars (6.3 mm, r1), wall strength was smaller than in the
un-reinforced grouted walls, with similar values for 10 mm rebar (r2).
An increase of 14% was observed only with 16 mm rebar (r3).
Figure 12 – Stress-strain curve – hollow and unreinforced walls B1-G1
Since these reabar are not laterally restrained by stirrups, it is suggested the small diameter bars, subjected to greater stresses than in the case of B1, contributing negatively possibly because of their buckling.
Results indicate that reinforcing grouted walls with longitudinal re-bars, without providing stirrups, will not contribute to increasing its compression load capacity proportionally to the reinforcement rate. Eventually, depending on the rebar diameter, the wall strength can be reduced. Results reported in [22] also indicate small changes in resistance of reinforced concrete block walls compared to their respective grouted walls.
To analyze the behavior of the stress-strain curves of combinations of hollow ungrouted and unreinforced and reinforced, graphs are presented in Figures 12 to 15. Referring to Figure 12, one can see the same deformation behavior of B1 hollow and grouted walls in re-spect to the net area. This behavior was also observed in the prism testing in which both rebar, and block gages showed similar reading. Figure 13 shows hollow and unreinforced grouted B2 walls. Grout-ing these walls increased its stiffness and ultimate strength in net area compared with the hollow walls. This behavior was also ob-served with at prisms testing.
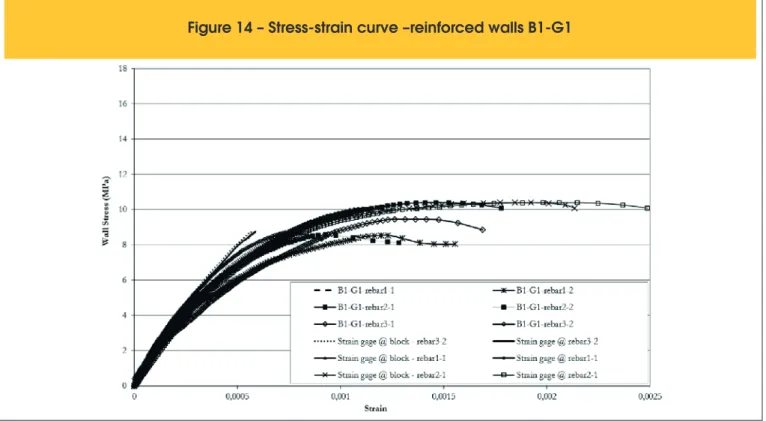
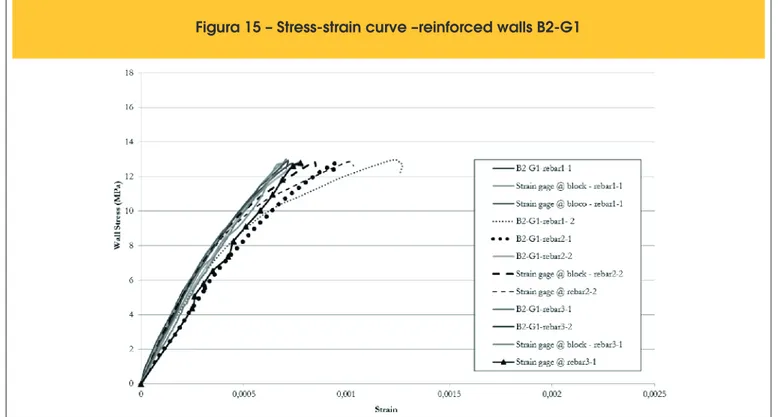
Figures 14 and 15 show the curves of the reinforced B1 and B2 walls. A very similar masonry deformation behavior is observed at the three reinforcement rates, considering both the gage readings at the block and at the rebar. This behavior is also similar to the prism testing.
4. Conclusion
Based on the observations reported here, we can conclude:
n The grouted and hollow B1 prism testing results show the same
strength in the net area, but a 50% increased in the grouted to hollow prism strength was observed with B2 blocks. Similar be-havior was observed on the walls, with lower increase (30%) for the B2 case. This behavior suggest that the greater wall thick-ness of the B2 blocks showed greater resistance to lateral ex-pansion of the inner grout, leading to the greater prism strength.
n The prism illed with the stiffer grout resulted in smaller
fail-ure strain than the one with weaker grout, although the failfail-ure strength was similar for the two grout-strengths tested.
n The insertion of grout on the walls increased by 80% the wall
average load-capacity when compared with the hollow walls. Increased masonry resistance with the grouting is not neces-sarily proportional to ungrouted/grouted net area ratio.
n The presence of reinforcement did not alter signiicantly the
structural behavior of the prisms and walls (compressive strength and deformability), being eventually observed a small resistance reduction (6.3 mm rebars and B2 blocks), little or no increase in compression resistance (other cases). It is not pos-sible to calculate the reinforced wall resistance by accounting the compatibility of strain and stresses at the block, grout and rebar areas. The lateral expansion of the grout and rebar (with-out stirrups in this study) affect the wall behavior and resistance.
n The elongation at break of masonry concrete block is close to
2.0 ‰, a smaller value than the currently adopted in Brazilian standards, speciied as 3.5 ‰, but similar to that reported in other references.
5. References
[1] CAMACHO, J. S.; RAMALHO, M. A.; ANDOLFATO, R. P. An experimental study of the interaction among walls submitted
to vertical loads. In: Australian Masonry Conference - AMC, 6th, Adelaide, 2001, Proceedings of the 6th Australian Ma-sonry Conference, Adelaide, 2001, v. 1, p. 95-104.
[2] MENDES, R. J. K. Resistência à compressão da alvenaria de blocos cerâmicos estruturais, Florianópolis, 1998, Dissertação (Mestrado) - Universidade Federal de Santa Catarina, 200 p. [3] DRYSDALE, R. G.; HAMID, A. A. Behaviour of concrete
block masonry under axial compression. ACI Journal, v. 76, n. 6, 1979, p. 707-721.
[4] CHAHINE, G. N. Behaviour Characteristic of Face Shell Mortared Block Masonry Under Axial Compression, Hamil-ton (Ontario), 1989, Master of Engineering thesis - McMaster University, 423 p.
[5] HAMID, A. A.; CHUKWUNENYE, A. The Compression Be-haviour of Concrete Masonry Prisms. Journal of the Structural Division, Proceedings of ASCE, v. 112, n. 3, 1986, p. 605-614. [6] PARSEKIAN, G. A.; HAMID, A. A.; DRYSDALE, R. G. Com-portamento e Dimensionamento de Alvenaria Estrutural, São Carlos: EdUFSCar, 2ed, 2013, 625 p.
[7] ASSOCIAÇÃO BRASILEIRA DE NORMAS TÉCNICAS. Cál-culo de alvenaria estrutural de blocos vazados de concreto. - NBR 10837, Rio de Janeiro, 1889.
[8] ASSOCIAÇÃO BRASILEIRA DE NORMAS TÉCNICAS. Al-venaria estrutural – Blocos de concreto – Parte 1: Projeto. - NBR 15961-1, Rio de Janeiro, 2011.
[9] EN 1996-1-1: EUROCODE 6: Design of Masonry Structures - Part 1-1: General rules for buildings - Rules for reinforced and unreinforced masonry, Brussels, 2013.
[10] BRITISH STANDARD INSTITUTION. Code of practice for structural use of masonry. Part 2 – Structural use of reinforced and prestressed masonry. - BS 5628-2, London, 1995.
Figura 15 – Stress-strain curve –reinforced walls B2-G1
[11] MASONRY STANDARDS JOINT COMMITTEE. Building code requirements for masonry structures (ACI 530/TMS 402/ASCE 5), 2011.
[12] CANADIAN STANDARDS ASSOCIATION. Design of ma-sonry structures. – CSA S304. 1-04, Toronto, 2004.
[13] STANDARDS ASSOCIATION OF AUSTRALIA. Masonry Structures. - AS 3700, 2ed, Sydney, 1998.
[14] PRIESTLEY, M. J. N. Seismic Design of Concrete Masonry Shear Walls. Journal of the American Concrete Institute, v. 83, 1986, p. 58-68.
[15] ASSOCIAÇÃO BRASILEIRA DE NORMAS TÉCNICAS. Blo-cos vazados de concreto simples para alvenaria - Métodos de ensaio. - NBR 12118. Rio de Janeiro, 2013.
[16] ASSOCIAÇÃO BRASILEIRA DE NORMAS TÉCNICAS. Al-venaria estrutural - Blocos de concreto – Parte 2: Execução e controle de obras. - NBR 15961-2. Rio de Janeiro, 2011. [17] ASSOCIAÇÃO BRASILEIRA DE NORMAS TÉCNICAS.
Paredes de alvenaria estrutural - Ensaio à compressão sim-ples - Método de ensaio. - NBR 8949, Rio de Janeiro, 1985. [18] ROMAGNA, R. H. Resistência à compressão de prismas
de blocos de concreto grauteados e não grauteados, Flori-anópolis, 2000, Dissertação (Mestrado) – Universidade Fed-eral de Santa Catarina, 218 p.
[19] CUNHA, E. H. Analise experimental do comportamento de prismas grauteados em alvenaria estrutural, Goiânia, 2001, Dissertação (Mestrado) – Universidade Federal de Goiás, 149 p.
[21] CALÇADA, L. M. L. Avaliação do comportamento de pris-mas grauteados e não grauteados de bloco de concreto, Florianópolis, 1998, Dissertação (Mestrado) – Universidade Federal de Santa Catarina, 188 p.
[22] ALY, V. L. C.; SABBATINI, F. H. Determinação de correla-ções de resistências mecânicas de paredes de alvenaria es-trutural de blocos de concreto. In: International Seminar on
Structural Masonry of Developing Countries, 5th,
Florianopo-lis, 1994, p 115-126.
![Figure 1 – Design masonry stress-strain curve as Eurocode [9]](https://thumb-eu.123doks.com/thumbv2/123dok_br/18860855.417908/2.892.70.835.761.1145/figure-design-masonry-stress-strain-curve-as-eurocode.webp)