Innovative procedures for monitoring experimental tests using photogrammetry and image processing have been recently proposed. This manu-script aims at providing a practical demonstration of the advantages of using these new techniques in experimental tests up to failure. In this scope, focus is given to the curvature, rotation and to the tension stiffening effect, i.e., the contribution of the concrete between cracks to increase the bending stiffness. These parameters are crucial to describe the structural behavior of reinforced concrete beams both in serviceability and in ultimate limit states. These new techniques allow monitoring a high number of points, enhancing the traditional monitoring methods and providing more information which would be impossible to obtain using the traditional methods.
Keywords: curvature, plastic rotation, experimental tests, photogrammetry, image processing.
A monitorização de ensaios experimentais tem registado desenvolvimentos signiicativos nos últimos anos mediante o recurso à fotogrametria e
ao processamento de imagem. Neste artigo pretende-se demostrar a aplicabilidade prática destas novas técnicas na monitorização de ensaios
até à rotura. Neste trabalho é dada especial atenção à curvatura, à rotação plástica e à contribuição do betão entre fendas para o aumento da rigidez à lexão, i.e., o “tension stiffening effect”, os quais são fundamentais para caracterizar o comportamento estrutural de vigas de betão ar
-mado, tanto em serviço como em estado limite último. Veriica-se que estas novas técnicas permitem monitorizar um número muito elevado de
pontos, complementando os métodos tradicionais de monotorização, e possibilitando a determinação de informação impossível de obter através dos métodos tradicionais.
Palavras-chave: rotação plástica, ensaios experimentais, fotogrametria, processamento de imagem.
Plastic rotation and tension stiffening effect analysis
in beams using photogrammetry
Análise da rotação plástica e da contribuição do betão
entre fendas em vigas usando fotogrametria
R. N. F. do CaRmo a
J. ValeNça b
d. dias-da-Costa c
a CIEC, Instituto Superior de Engenharia de Coimbra, [email protected], Rua Pedro Nunes - Quinta da Nora. 3030-199, Coimbra, Portugal; b ICIST, Instituto Superior de Engenharia de Coimbra, [email protected], Rua Pedro Nunes - Quinta da Nora. 3030-199, Coimbra, Portugal; c INESC, University of Coimbra, [email protected], Rua Luís Reis Santos, 3030-788 Coimbra, Portugal. School of Civil Engineering,
The University of Sydney, NSW2006, Australia.
abstract
1. introduction
Monitoring experimental tests performed on structural elements is cru-cial to quantify the loading effects. Measuring forces, curvatures, dis-placements and strains in key sections allow characterizing the struc-tural behavior of the element. The observation of the failure mechanism in reinforced concrete elements is also important simultaneously with
the identiication of the crack pattern. The above quantities are usually
measured by traditional monitoring instruments, including: load cells, mechanical strain gauges, demecs, strain gauges and LVDTs. Recently, new monitoring tools using photogrammetry and image pro-cessing were developed to determine some of the above parameters [1-8]. These tools allow to assess a large amount of data which is
dif-icult, or even not possible, to measure with traditional methods. A de -tailed curvature evolution along the concrete beam axis is one example. This study aims at demonstrating how photogrammetry and image
processing can be applied to study the lexural behavior of con -crete beams and how these techniques go beyond the limitations of traditional methods. Furthermore, the analysis of the tension stiffening effect, combining the information obtained by photogram-metry and image processing, is presented.
2. Plastic rotation and tension stiffening
effect in reinforced concrete beams
The possibility of achieving plastic analysis and linear analysis with moment redistribution requires a certain amount of plastic rotation in critical sections. It is important to ensure that critical sections can reach the foreseen failure type. In uncertain situations it becomes
necessary to make an explicit veriication of this capability. Thus, it is
crucial to know the moment versus curvature relationship or, alterna-tively, plastic rotation capacity versus x/d parameter (see EC2 [9]).
The plastic rotation capacity is deined as the difference be -tween the rotation at the ultimate load and at the steel bars
yielding onset. Therefore, the plastic rotation can be deined as the integral of the curvature after steel yielding in the plastiied
area (Eq. 1).
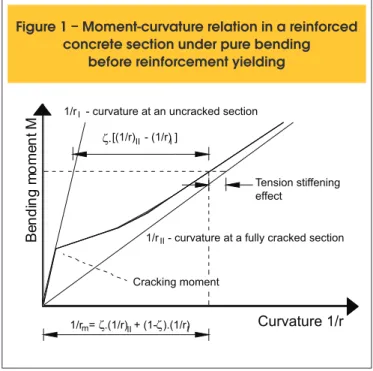
Figure 1 – Moment-curvature relation in a reinforced
concrete section under pure bending
before reinforcement yielding
Curvature 1/r
Be
nd
in
g
m
ome
nt
M
Tension stiffening
effect [(1/r) - (1/r) ]II I
1/r - curvature at an uncracked section I
1/r - curvature at a fully cracked sectionII
1/r = .(1/r) + (1- ).(1/r)m II I Cracking moment
(1/r)II - curvature at a fully cracked section
z - distribution coeficient which take into account the tension stiff -ening effect
In a reinforced concrete member, the tensile reinforcement strain is variable along the beam axis. Consequently, the plastic rotation has also a discontinuous variation, depending essentially on the curvature of the cracked sections and, in less extent, on the cur-vature of the sections between cracks. In Figure 2, the diagonally dashed area corresponds to the integral of the plastic curvature along the plastic hinge length, i.e., to the plastic rotation.
In Figure 2 it is also observed that the plastic curvature tends to localize in cracked sections. Based on this, Bachmann, 1967 [10] proposed a straightforward method for computing the rota-tion in certain regions of beams due to cracks (rotarota-tion between the two opposite surfaces of the crack). The main characteristic of this method is the fact of not obtaining the rotation from the curvature. To apply this model it is necessary to know the num-ber of cracks in the region of interest and the width and depth of the neutral axis at each crack [11-12]. In this case, photogram-metry and image processing are excellent techniques to obtain-ing all required data.
The model is based on a discrete analysis of the reinforced con-crete member, being the tangent to the deformed beam
discontinu-ous at each crack. Figure 3 exempliies this procedure for a region
with negative moments, where the total rotation is equal to the sum of the rotations in the ‘n’ existing cracks.
(3)
(4)
(1)
Ɵpl - plastic rotation capacity
lpl - length of the plastic hinge 1/r - total curvature
1/ry - yielding curvature
es - total strain of steel reinforcement
esy - yielding strain of steel reinforcement
d - effective depth of a cross-section x - neutral axis depth
Computing the rotation in critical regions can be a dificult task
since the curvature has a discontinuous development along the beam axis due to bending stiffness difference between cracked sections and uncracked sections. On the other hand, in the plastic hinge region and near failure, the assumption of plane sections is
not valid. This makes dificult determining the rotation by integrat -ing the curvature along the beam axis.
The contribution of the concrete between cracks on the tensile
strength originates a signiicant variation of the bending stiffness,
known as tension stiffening effect. Disregarding this effect may lead to unrealistic predictions, i.e., if only the curvature in a fully cracked section is considered, a value greater than the actual rota-tion would be obtained (Figure 1).
According to EC2 [9] and others codes, the mean curvature must be computed by considering both uncracked and entirely cracked states, i.e., by applying Equation 2.
(2)
(1/r)
m= .(1/r)
II+ (1 - ).(1/r)
I(1/r)m - mean curvature
(1/r)I - curvature at an uncracked section
where
ω
is a scale factor.Since only the ratio of the homography parameters is relevant, the number of unknowns to be solved is eight. Therefore, an exact so-lution is obtained using four targets. Usually, there are many more targets available and the resulting system is over determined. In this case, the solution is obtained by minimizing the norm
Ah
of Equa-tion 5 for ‘n’ points. The eigenvector corresponding to the least eigen-value of TA A
allows to directly obtaining the solution.It should be noted that the homography deine a map between
two planes, independently of their position and orientation. The ho-mography parameters can then be used to compute the real plane coordinates for all the targets and at any stage evaluated. The differences in the coordinates in relation to the reference stage
allow to directly computing the corresponding displacement ield.
Then, an auxiliary mesh is assembled by means of a Delaunay triangulation and using the reference targets [13]. Lastly, the strain
ield is directly computed by a strain-nodal displacement matrix as -sociated to the auxiliary mesh (see [3] for more details).
It should be mention that all acquired images were orientated and scaled to 1:5 using the homography parameters. This value is used since the mean resolution of the original image frames was circa 0.2mm/pixel. Later, the value is also used to measure the crack width (see Section 5.3).
3.2 Image processing
Digital image processing is a technique which allows detecting dis-continuities in the image, i.e, points where sudden changes in the in-tensity level of the pixels occur. Therefore, detecting and measuring cracks on concrete surfaces is enabled. In the most cases, the detec-tion of discontinuities in an image was performed by applying edge detectors [6-8]. This allows obtaining a binary image which enhances the crack pattern to be characterized. However, the method presents results strongly dependent on the surface conditions (other source of discontinuities). Thus, surfaces need to be carefully prepared and to adequate lighting conditions have to be assured. Therefore,
com-bined approaches have emerged, in which the strain ield is used to deine critical regions where image processing is performed [15].
In this section, a brief description of the digital image processing op-erations required to enhance and measure cracking is presented. The surface of the specimen was painted white in order to obtain a homoge-neous background, thus further enhancing cracking appearing during the experimental test. This method was developed for monitoring crack-ing by combincrack-ing digital image processcrack-ing and mathematical morphol-ogy operations, and a complete description of the procedure, includ-ing experimental examples, can be found in [7]. After orientatinclud-ing and scaling all the images according to the previous Section, the procedure comprises the following main steps: i) binarization of the images using the Otsu’s method; ii) mathematical morphology operations (cleaning,
linking and illing) in order to prevent other sources of discontinuities (e.g. surface imperfections) to be misleadingly taken as cracks; and i -nally iii) measuring any selected crack on the scaled image.
4. experimental program
4.1 Overview
The method was applied to monitoring an experimental test un-wi - i-th crack width
d - effective depth of the cross-section xi - neutral axis depth
Ɵ - rotation
3. Photogrammetry and image processing
3.1 Photogrammetry
Photogrammetry allows measuring the displacement ield at targets placed
at the surface of the specimen [1-4]. Alternatively, advanced image
corre-lation techniques can be applied to avoid the use of pre-deined targets. In both cases, after obtaining the displacement ield, the strain ield is comput
-ed applying standard inite element method (MEF) proc-edures [5]. All operations performed after image acquisition to obtain the strain ield,
are described in this section, i.e.: i) target detection, where the positions of
all targets are identiied in all images; ii) homography, which allows scaling
and orientating all images and thus obtaining the coordinates of the targets in the surface of the specimen; and iii) mesh generation, where a Delaunay
triangulation is applied to deine the post-processing mesh [13].
The irst step, target detection, is performed using the Hough trans -form [14] to identify the geometrical center of the targets, at all stag-es. In summary, the average pixel radius allows computing a para-metric transform, which results in a map of peaks coincident with the geometrical center of the targets [14, 15]. Secondly, after detecting all targets, their position is obtained in the world coordinate system. Since all displacements are expected to occur within a plane, a simple homography is established to match image coordinates with real plane coordinates. The concept is accomplished by solving the following system of equations for the reference stage:
(5)
where Xi and Yi are the real plane coordinates for each target ‘i’ provided by the reference grid size painted at the surface of the specimen (in this case 20 x 20 mm2), x
i and yi are the
correspond-ing coordinates in the image, and h1 to h9 are the homography pa-rameters. Thus, the following relation can be written, for any point belonging to the surface of the specimen [16]:
(
6)
و 2 3
4 5 6
7 8 9
1
1
X
h h
h
x
Y
h
h h
y
h
h h
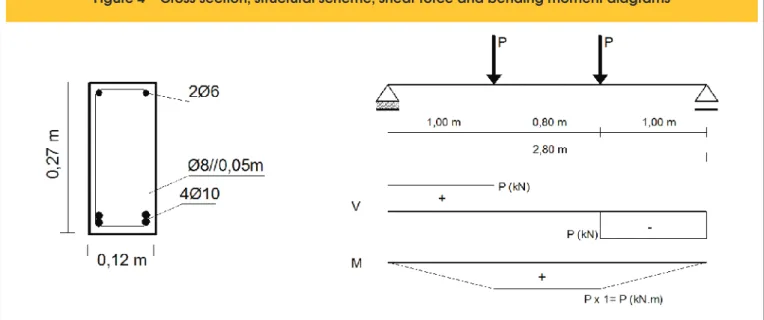
til failure of a reinforced concrete beam with 3.0 m long, 12 cm width and 27 cm height. The beam was produced with lightweight concrete with a density of 1900 kg/m3, an average compressive
strength of 51 MPa at 28 days and 54 MPa at the test day (166 days after casting) [17-18]. The concrete Young’s modulus of 24 GPa was also experimentally measured. For the longitudinal and transversal reinforcement hot rolled and ribbed steel bars of
S500NR-SD class were used. Tensile tests were performed to measure the steel yielding stress, fsym, and the tensile strength, fsum, 545 and 645 MPa, respectively.
The beam was simply supported at both edges, 2.8 m span, and was subject to symmetrical loading, one concentrated load P which was divided into two equal loads distanced 1.0 m from the supports. Thus, the central region of the beam was theoretically under pure bending
Figure 4 – Cross section, structural scheme, shear force and bending moment diagrams
(Figure 4). The main load was applied by a 300 kN capacity hydraulic servo-actuator, attached to the metallic support frame. The test was performed using displacement control at a constant rate of 0.01 mm/s. Several parameters were measured during the test to characterize the beam behavior, namely, support reactions and displacements at se-lected critical sections. The test was also monitored using the image processing methods described in Section 3 and traditional instrumenta-tion, in particular, load cells under the supports and displacement trans-ducers (LVDTs) placed in the pure bending region. Three LVDTs were used to measure vertical displacements, two placed at 1.0 m from each
support (sections where loading was applied) and the third was placed exactly at mid-span. Two LVDTs were also placed to measure the hori-zontal stretching of the beam at the pure bending region (Figure 5).
4.2 Preparation and image acquisition
Previously works using photogrammetry and image processing in structural monitoring have shown that the precision obtained in the
displacement ield is typically better than 0.050 mm. Thus, in order to measure a uniform strain ield with 0.5% precision (value suit -able for characterizing the crack formation) a minimum distance between targets of 20 mm is required (Dias-da-Costa et al. [3]). Therefore, the circular targets were painted in the surface of the specimen composing a square grid with sides of 20 mm length, op-positely to the surface used for placing the traditional instruments. All images were captured by a digital camera installed in front of the beam, at a distance of 1.75 m. A tripod and a remote shutter were used to trigger the camera without compromising the stability. The images were acquired at full resolution of 4608×3072 pixel. Before start loading, ten images were sequentially acquired and later on used for scaling and orientating all images used to moni-toring the experimental test and also for estimate the error in the results. Four stages of the test are herein analyzed (Figure 6).
4.3 Error analysis
As previously mentioned the ten images acquired before start loading were used to estimate the error of the results, namely: i) the error of the homography; and ii) the precision of the
coordi-nates at each target. In the irst case, the error was 0.236 mm and
Figure 6 – Force vs. testing time duration
0 20 40 60 80
0:00 0:28 0:57 1:26 1:55 2:24
Force P
(kN)
photogrammetry
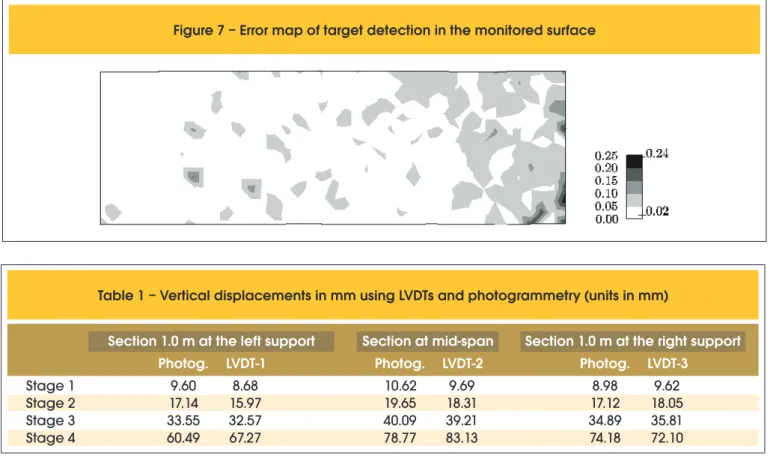
Figure 7 – Error map of target detection in the monitored surface
Table 1 – Vertical displacements in mm using LVDTs and photogrammetry (units in mm)
Section 1.0 m at the left support
Section at mid-span
Section 1.0 m at the right support
Photog.
LVDT-1
Photog.
LVDT-2
Photog.
LVDT-3
Stage 1
Stage 2
Stage 3
Stage 4
9.60
17.14
33.55
60.49
10.62
19.65
40.09
78.77
8.98
17.12
34.89
74.18
8.68
15.97
32.57
67.27
9.69
18.31
39.21
83.13
0.315 mm in average and at a 95% conidence level, respectively.
The precision in target detection was 0.031 mm and 0.046 mm in
average and at a 95% conidence level, respectively (Figure 7).
It is important to highlight that the error of the homography is a systematic error, i.e, the error on the displacement is assumed to correspond to the error in the target detection. Finally, the error in
the strain ield was circa 0.3% for the deined grid spacing.
5. Results analysis
5.1 Preliminary results
The vertical displacements obtained using photogrammetry were compared with those obtained by traditional monitoring. The
ob-tained differences were relatively small, 6% on average (Table 1).
From the displacements measured at each target it is possible to
com-pute the strain ield (see Section 3.1). In Figure 8, the irst principal strain ield at stage 3 is shown (see Section 3.2). It is highlighted that it
is consistent with the existing cracking pattern. Additionally, image pro-cessing can be used to measure the crack width at each test stage. This information is later used to determine the rotation in Section 5.3.
5.2 Curvature
The mean curvature at the pure bending region can be deined us
-ing the parabolic equation that best its the vertical displacements.
The curvature is the directly computed by the 2nd derivative of the
equation. For this purpose, photogrammetry presents a signiicant
advantage because it allows recording the displacement at a large number of cross sections which can be used to obtain a reliable approximation of the parabolic equation.
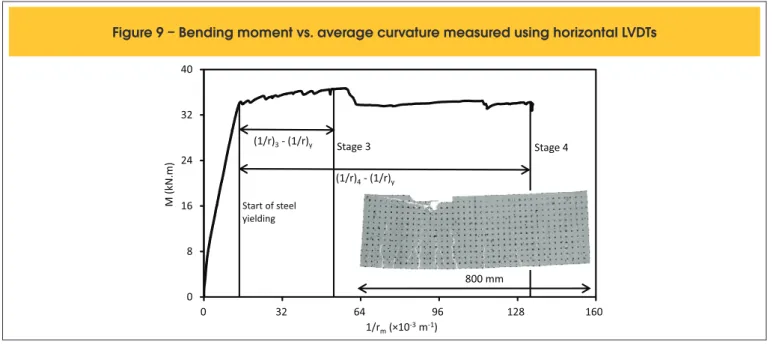
The average curvature can also be assessed by measuring the hori-zontal stretching at the pure bending region. As mentioned above, two horizontal LVDTs were used to measure these deformations. Knowing the vertical distance between the LVDTs axis and the horizontal dis-tance between reading points, the average strains and corresponding curvature, can be computed. In Figure 9, the moment versus curva-ture relation for the pure bending region (800 mm) is shown, identify-ing the onset of reinforcement yieldidentify-ing, stage 3 and stage 4.
The curvature for a speciic section and at a particular stage is deter -mined based on strains measured along the section height. Initially, it
is necessary to deine the best it straight line to the strains. Figure 10
presents the strain evolution and the corresponding curvature
comput-Figure 8 – Cracks pattern and strain map (stage 3)
Cracks pattern First principal strain map
A
B
Figure
9 – Bending moment vs. average curvature measured using horizontal LVDTs
0 8 16 24 32 40
0 32 64 96 128 160
M (kN.m)
1/rm(×10-3m-1)
(1/r)3- (1/r)y
(1/r)4- (1/r)y
800 mm
Start of steel yielding
Figure 10 – Curvature at a section placed at 50 mm of the left edge in the pure bending span
F
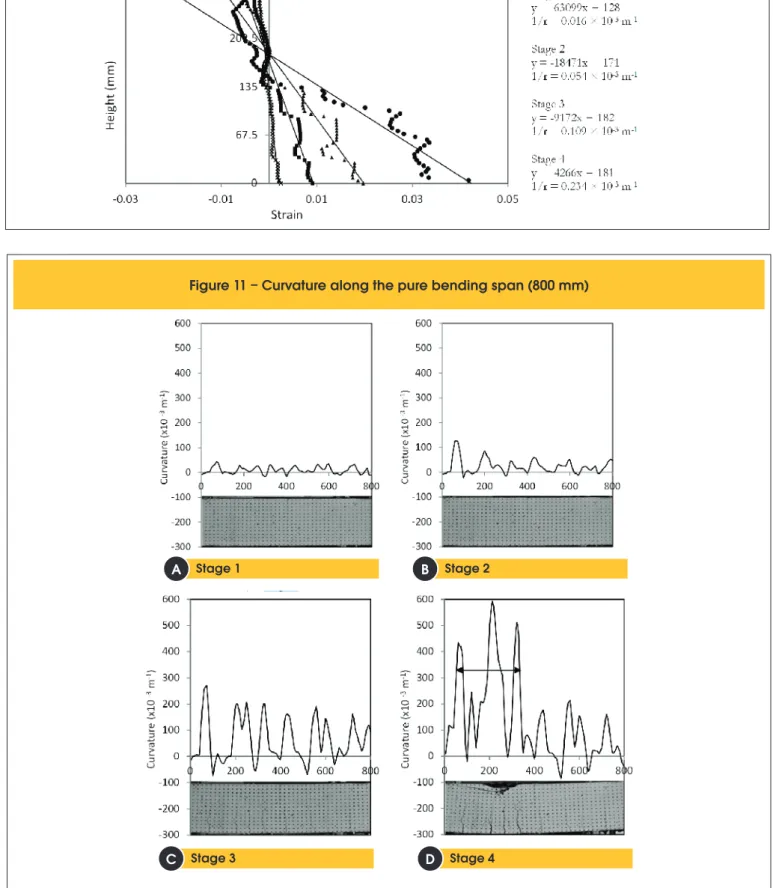
igure 11 – Curvature along the pure bending span (800 mm)
Stage 1
Stage 3
Stage 2
Stage 4
A
C
B
ed for the four stages considered in this analysis. The selected section was placed at 50 mm from the left edge of the pure bending region. A perfect linearity between strains was not found because, during the deformation, the sections do not remain plain due to concrete cracking. It is reminded that mechanical strain gauges and demcs only al-low obtaining the average curvature in lengths of 100 or 200 mm (values limited by the mechanical strain gauge length) and not
curvature in a speciic section (Carmo and Lopes [19]). Another
disadvantage of using mechanical strain gauges compared with photogrammetry is the time required to perform all readings. Photogrammetry provides a detailed curvature analysis because the
spacing between targets can be signiicantly reduced, in this case
20 mm was adopted. The detailed evolution of curvature along the
beam axis allows analyzing the inluence of the concrete between
the cracks and cracked sections in the beam deformation. Figure 11 presents the curvature evolution along the beam axis for the four analyzed stages, where it can be seen that the curvature is not constant. In stages 1 and 2, despite the cracks width not being
very signiicant, a larger curvature was already detected in cracked
sections. Between stages 2 and 3, the curvature increases in cracked sections, being approximately constant in sections between cracks. In stage 4, it can be seen that sections with maximum
cur-vatures tend to concentrate on a limited length, about 300-350 mm.
5.3 Plastic rotation
The reinforced concrete members have a nonlinear behavior when subjected to higher loads. Before reinforcement reaches the yield strength, the nonlinear behavior is caused by concrete cracking.
After reaching the steel yielding, the inluence of the nonlinearity
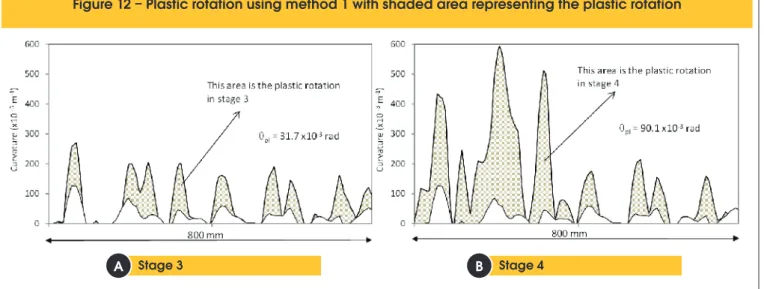
of steel stress-deformation must also be taken into account. At this moment, it is considered that a plastic hinge is formed. To quantify the ductility of the member, the evaluation of the plastic rotation capacity at certain zones of the structure is generally used [20]. The plastic rotation capacity of a beam is the maximum plastic rotation supported immediately before collapsing. To compute the plastic rotation three methods are presented: i) curvature
integra-tion after steel yielding in the plastiied area (Eq. 1 and Figure
12), ii) multiplying the difference of the average curvatures, at the steel yielding onset and at the analyzed stage, by 800 mm length (curvatures determined by the horizontal LVDTs) (Figure 9), iii) Bachmann’s method, based on the sum of rotations which occur between the two sides of the crack (Eqs. 3 and 4 and Figure 13). The latter is easily applied using photogrammetry and image
pro-Figure 12 – Plastic rotation using method 1 with shaded area representing the plastic rotation
Stage 3 Stage 4
A
B
cessing, since all required data can be easily measured after the test, thus not requiring to stop the test to perform readings (Tables 2 and 3). However, this method has a drawback: in stages before steel yielding, when cracks are relatively small, is not possible to achieve the required accuracy to measure the cracks width. Table 4 summarizes the plastic rotations in pure bending region obtained by the three methods mentioned. It is found that the val-ues obtained using methods 1 and 2 are very similar, with
differ-ences lower than 5%, and with the values smaller than those ob -tained using method 3, particularly at step 3, where the differences
can reach 40%.
5.4 Tension stiffening effect evaluation
The beam lexural stiffness (EI) decreases as the applied load in -creases, initially due to concrete cracking and, at a later stage, due
to the reinforcement yielding. Theoretically, lexural stiffness in a speciic section can be determined in state I and II: in state I the
whole cross-section of concrete and steel is considered, whereas in state II only the concrete under compression and, obviously, the
steel area are considered. The lexural stiffness experimentally
measured should be between these two limits due to the tension
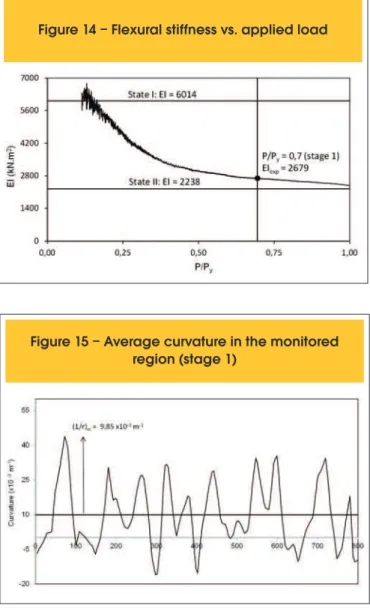
stiffening effect. Figure 14 presents the evolution of lexural stiff -ness (EI) with the applied load, P. The latter parameter is written using the dimensionless ratio P/Py (where Py is the load required to the reinforcement yielding). The stiffness was measured using the relation between bending moment applied and mean curvature, in this case measured using the horizontal LVDTs. Initially, stiffness assumes high values because the curvature is very low and there-fore very sensitive to any reading variation from the LVDTs. The tension stiffening effect is particularly important in the analysis of deformations in concrete structures under serviceability condi-tions, as recommended in design codes for concrete structures.
As mentioned in Section 2, the distribution coeficient z considers
the contribution of the tension stiffening effect. An analysis of this effect is provided below to stage 1, where the applied load is
ap-Table 2 – Rotation computed in each
identified crack
Crack
x (mm)
iΣ
Ɵ
i(×10-3 rad) =
63.2
w (mm)
i-3
Ɵ
i(×10 rad)
Stage 3
1
2
3
4
5
6
7
8
86
92
100
87
99
91
109
120
1.60
1.20
1.00
1.00
1.20
0.80
0.80
1.00
1.60
1.20
1.00
1.00
1.20
0.80
0.80
1.00
Table 3 – Total rotation obtained
by Bachmann method
Stage
Ɵ
(×10 rad)
-3 i-19.5
63.2
123.5
1
2
3
4
-3Table 4 – Plastic rotation (x 10 rad)
Stage
Method 1
Method 2
Method 3
3
4
31.7
90.1
30.8
95
43.7
104
Figure 14 – Flexural stiffness vs. applied load
proximately 70% of the maximum load, which corresponds roughly
to serviceability conditions.
Considering the lexural stiffness value experimentally obtained,
i.e. 2679 kN.m2, and applying Equation 2 is obtained a value for the distribution coeficient z of 0.883. This coeficient can also be
determined using the curvature computed by photogrammetry and image processing. At this stage the bending moment is 23.5 kN.m. Knowing the stiffness in states I and II, the curvature is: (1/r) I = 3.9 x10⁻³ m-1 and (1/r)
II = 10.5 x10
-3 m-1 . Since the average curvature,
in the analyzed region, is 9.85 x10⁻³ m-1, the distribution coeficient z is 0.902 (Figure 15). The values experimentally measured can be compared with the EC2 [9], z = 1 - b.(Mcr/M)2. In this case, b is 1
(short-term loading) and the cracking moment Mcr is 6 kN.m, con-sidering the concrete tensile strength and all homogenized section. Taking into account this data, and according the EC2, the
distribu-tion coeficient value is 0.935, very close to the values obtained
experimentally.
6. Conclusions
Recently, innovative methods for monitoring structures using pho-togrammetry and image processing have been developed. This paper presents a practical example of these techniques, namely, in the characterization of the structural behavior of reinforced con-crete beams, with particular attention in plastic rotation and tension stiffening effect.
Photogrammetry and image processing were used to monitor a large number of points on a concrete surface until failure. Four stages during the experimental test were analyzed, highlighting the interest in the developed tools, which allow the computation of the
strain ield on concrete surfaces and characterization of the crack -ing pattern. Throughout the test, similar values of the vertical dis-placements between photogrammetry and LVDTs were obtained.
The detailed information of the strain ield in the concrete surface allowed computing the curvature in speciic sections and evaluating
their progress along the beam axis. This information is extremely
dif-icult to obtain with traditional methods, since the use of mechanical
strain gauges is required. Usually, the mean curvature along regions can only be determined with 100 or 200 mm resolution due to the limitation of the equipment size. Photogrammetry allows obtaining the curvature along smaller regions, in this case with 20 mm length. The detailed evolution of the curvature along the beam axis was used to study the plastic rotation and the tension stiffening effect. The method allowed to experimentally verify that the plastic curva-ture was localized in cracked sections and in a restricted length of the beam, in this case around 350 mm. Photogrammetry was also used to determine rotation between the cracks boundaries. These values have also been used to compute the plastic rotation in the pure bending zone.
In summary, the presented study aims validating and demon-strating that photogrammetry and image processing techniques
can provide signiicant and relevant data relatively to traditional
methods of monitoring, both in serviceability and in ultimate states. Furthermore, due to the amount of data recorded, is possible to perform analyses that would otherwise be unfeasible.
7. acknowledgments
The authors would like to express their gratitude to the Department
of Civil Engineering of the Polytechnic of Coimbra for providing the conditions to carry out this study and the colleagues Hugo Costa, Tiago Simões, Cátia Lourenço and Diogo Andrade, for their col-laboration in the experimental programme.
8. References
[01] Hegger J, Sherif A, Görtz S (2004) Investigation of pre-and postcracking shear behavior of prestressed concrete beams using innovative measuring techniques. ACI Structural Journal 101 (2):183-192. [02] Lange J, Benning W, Siering K Crack detection at
concrete construction units from photogrammetric data using image processing procedures. In: ISPRS Commission VII Mid-term Symposium Remote Sensing: From Pixels to Processes, Enschede, Netherlands, 8-11 May 2006. pp 493-496.
[03] Dias-da-Costa D, Valença J, Júlio E (2011) Laboratorial
test monitoring applying photogrammetric
post-processing procedures to surface displacements. Measurement 44 (3):527-538.
doi:10.1016/j.measurement.2010.11.014.
[04] Valença J, Júlio E, Araújo H (2012) Application of
photogrammetry to structural assessment. Experimental Techniques 36 (5).
doi:10.1111/j.1747-1567.2011.00731.x.
[05] Hoffman ME, Manevitz LM, Wong EK, Geers MGG, De Borst R, Brekelmans WAM (1996) Computing
strain ields from discrete displacement ields in
2D-solids. International Journal of Solids and Structures 33 (29):4293-4307.
doi:10.1016/0020-7683(95)00240-5
[06] Abdel-Quarter I, Abudayyeh O, Kelly M (2003) Analysis
of edge detection techniques for crack identiication in
bridges. Journal of Computing in Civil Engineering 17 (3):255-263.
doi:10.1061/~ASCE!0887-3801~2003!17:4~255!
[07] Valença J, Dias-da-Costa D, Júlio ENBS (2012)
Characterisation of concrete cracking during
laboratorial tests using image processing. Construction and Building Materials 28 (1):607-615.
doi:10.1016/j.conbuildmat.2011.08.082
[08] Hutchinson TC, Chen Z (2006) Improved Image Analysis for Evaluating Concrete Damage. Journal of Computing in Civil Engineering 20 (3):210-216 [09] CEN (2004) EN 1992-1-1: Eurocode 2: Design of
Concrete Structures - Part 1-1: General Rules and Rules for Buildings, in: European Committee for Standardization (CEN).
[10] Bachmann H (1967) Zur plastizitätstheoretischen Berechnung statisch unbestimmter Stahlbetonbalken. Technische Hochschule, Zürich
[11] Park R, Paulay T (1975) Reinforced concrete structures. Wiley, New York.
[12] Buchaim R (2001) A inluência da não-linearidade física do concreto armado na rigidez à lexão e na
Transactions on Mathematical Software 22 (4):469-483. doi:10.1145/235815.235821.
[14] Ballard D (1981) Generalizing the Hough Transform to Find Arbitrary Shapes. Pattern Recognition 13:111–122
[15] Valença J, Dias-da-Costa D, Júlio E, Araújo H,
Costa H (2012) Automatic crack monitoring using photogrammetry and image processing. Measurement (in press). doi:10.1016/j.measurement.2012.07.019. [16] Criminisi A, Reid I, Zisserman A (2000) Single
view metrology. Int J Comput Vision 40 (2):123-148. doi:10.1023/a:1026598000963.
[17] Carmo RNF, Costa H, Lourenço C, Andrade D, Simões
T (2012) Inluence of both concrete strength and transverse coninement on bending behaviour of
reinforced LWAC beams. Engineering Structures (in press). doi:10.1016/j.engstruct.2012.09.030. [18] EN 12390, Testing hardened concrete (2009).
European Committee for Standardisation, Brussels, Belgium.
[19] Carmo RNF, Lopes SM (2005) Inluence of the shear
force and transverse reinforcement ratio on plastic rotation capacity. Structural Concrete, Journal of the
ib (Thomas Telford Journal) 6 (3):107-117