The intersections between beams and columns in a reinforced concrete building structure are called frame joints. It is a region with signiicant bending stiffness but subjected to large shear stresses. Appropriate modeling of the lexibility of reinforced concrete frames is essential to its design, in service limit states as well as in ultimate limit states. It has been shown, theoretically as well as experimentally, that the inluence of joint lexibility may account for 20% of total structural lateral displacement. Models using only bar elements and rotational springs are proposed to consider the joint lexibility in linear analyses of building structures. In order to validate the proposed model, comparisons with experimental results found in the literature are made. Finally, the results of second order analyses using the proposed model are compared with those obtained by inite elements.
Keywords: reinforced concrete, frame joint, building structural analysis.
A zona de interseção de vigas e pilares em estruturas de edifícios é chamada nó de pórtico. Trata-se de região com rigidez signiicativa à lexão, porém sujeita a grandes solicitações de cisalhamento. A apropriada modelação da lexibilidade de pórticos é essencial ao seu dimensionamento, tanto nos estados limites de serviço quanto nos estados limites últimos. Foi veriicado tanto teoricamente quanto experimentalmente que a inlu
-ência da lexibilidade dos nós pode alcançar 20% do deslocamento total da estrutura. Modelo utilizando apenas elementos de barras e molas é proposto para levar em consideração a lexibilidade dos nós na análise de estruturas de edifícios correntes. De forma a validar o modelo proposto, são realizadas comparações com resultados experimentais encontrados na literatura. Por im, os resultados da análise considerando os efeitos de segunda ordem utilizando o modelo proposto são comparados com aqueles obtidos por elementos initos.
Palavras-chave: concreto armado, nós de pórtico, análise estrutural de edifícios.
Flexibility modeling of reinforced concrete concentric
frame joints
Modelação da lexibilidade de nós concêntricos
de pórticos em concreto armado
S. J. P. J. MARQUES FILHO a [email protected]
B. HOROWITZ b
a Departamento de Engenharia Civil, Universidade Federal de Pernambuco, [email protected], Av. Acadêmico Hélio Ramos s/n,
50740-530, Recife-PE-Brasil.
b Departamento de Engenharia Civil, Universidade Federal de Pernambuco, [email protected], Av. Acadêmico Hélio Ramos s/n, 50740-530,
Recife-PE-Brasil.
Abstract
1. Introduction
The zone of overlapping of beams and columns in reinforced
con-crete buildings is called frame joint. This region has signiicant
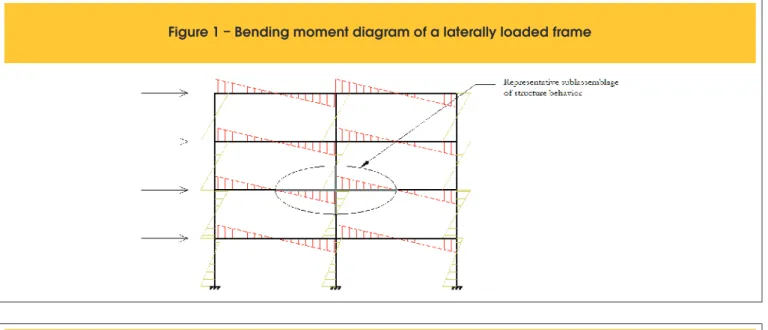
bending stiffness but is subjected to large shear stresses. In build-ing framed structures subjected to lateral loadbuild-ing, zero moment can be considered at mid-height of columns and at mid-span of beams. Thus, the subassemblage highlighted in Figure 1 can be used to represent the interaction between beams and columns of a frame.
This work studies the cases where the axes of beams intersect the axes of framed columns. Two types of joints are studied: com -plete joints, whose beams and columns have the same width, and concentric joints, where the column width is larger than the beam
width, as illustrated in Figure 3. As shown in Figure 2 the joints are
grouped according to their geometry as interior cross-type joint, T-Lateral exterior joint, T-Top exterior joint, and L-type joint.
The main objective of this study is to propose a simpliied model of ready numerical implementation that uses only bars and spring elements to take into account the lexibility of joint regions which may account for 20% of total structural lateral displacement, as demonstrated by the experimental results of Shin and LaFave [1]. To simplify the development of the proposed approximate model
the restraining effects of slabs and transverse beams are neglect-ed. This is a conservative assumption since it tends to decrease
joint stiffness. These additional effects will be the focus of the next phases of the present research. Unfortunately very few experimen -tal results are reported in the literature of joints including those restraining members.
Figure 1 – Bending moment diagram of a laterally loaded frame
al loads with all different joint types:
second order analyses incorporating the model were performed on several multistory building frames. Obtained results are com
-pared with those of second order, three-dimensional, inite element analyses.
2. Impact of joint lexibility
In order to gain an initial insight on the impact of joint lexibil
-ity on structural behavior consider the illustrative example of
Figure 3 where two interior joint subassemblages are shown.
The irst is a complete type joint, consisting of beams with 5m
span and a 3m high column. Both beams and columns have a
20cm by 50cm rectangular cross-section. The second joint is concentric and differs from the irst only in the cross-section of the column which is 160cm by 25cm. Note that both columns
have the same moment of inertia in the plane of bending. In both subassemblages horizontal displacement of the bottom section of the column as well as the vertical displacements of the end sections of the beam are prevented. The goal is to evaluate the required horizontal force applied to top of the column which
produces a 1cm horizontal displacement. The modulus of elasticity of the concrete is 20,6GPa and Poisson’s ratio is 0,2.
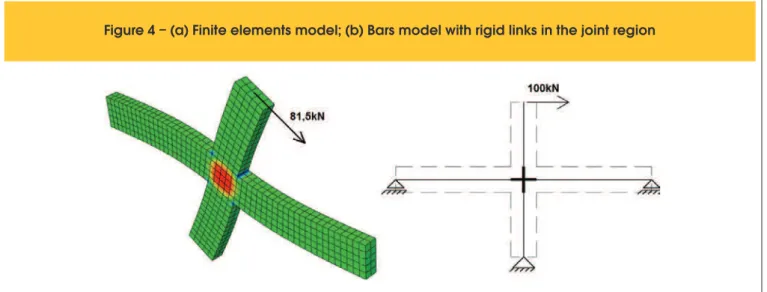
Initially consider as a basis the inite elements model of the irst example, shown in Figure 4(a). This model uses quadratic hexa
-hedron elements having twenty nodes with reduced integration implemented in the commercial code ABAQUS [3]. Concrete is
modeled as a linear elastic homogeneous material. The
discretiza-tion mesh follows the guidance given in Reference [4] for bending
problems which suggests at least two elements through the width
and shows excellent agreement with beam theory using four ele
-ments through the height, as well as experience gained throughout the present research. These techniques are used for the inite ele
-ment models in the remainder of this study.
For the inite element model of Figure 4(a) the value of the reac -tion force at the top sec-tion of the column corresponding to the imposed unit displacement is 81,5kN. Consider now the model
shown in Figure 4(b) consisting only of bar elements where rigid links are speciied for both beams and columns in the interior of the joint. In this case, the necessary force is 100kN. If no rigid links Three-dimensional inite element models of beam/column subas
-semblages are submitted to unit displacements at one of the col-umn end sections, and comparisons are made between the result-ing reactions against those obtained usresult-ing the proposed model.
As a result of this study required parameters of the model are ad
-justed. Only elastic analysis is considered since this is the usual
approach for nonseismic design of building structures, where
sec-ond order effects are directly or approximately taken into account.
In order to validate the adopted parameter values, comparisons are made between the predicted values of displacements against
experimental subassemblage results for drift values compatible with the NBR-6118 code [2] limits for service lateral displacement. In order to assess the accuracy of the proposed simpliied model,
Figure 3 – Elevation and plan view of
the example substructure (in cm)
ample observe from Figure 6(a) that the reaction obtained from
the inite element model is 74kN, corresponding to an imposed
displacement of 1cm at the top of the column. For a bar model with rigid links inside the joint the reaction force is 92,1kN. Figure 6(b),
which shows a section through the symmetry plane of the joint,
depicts again the concentration of shear stresses inside the joint. If
no rigid links are speciied the required force is 69,7kN.
Despite beams and columns having the same moment of inertia, the joint of the second example has less stiffness than that of the irst example. Among various factors, one of the largest contribu
-tors to the increase of the lexibility of the connection is the addi
-tional torsional deformation that exists in the column. This subject
will be discussed in detail in section 4.1.
From the above discussion it can be concluded that in usual situations, errors in joint modeling can result in lateral displacement errors in the
order of 20%. Experimental results from Shin and LaFave [3] show that joint lexibility contribute with 24% of total lateral displacement for drifts of 1% of story height and 53% for drifts of 6% of story height.
are speciied, with all bars having constant properties throughout their lengths, completely neglecting the stiffness of the joint region,
the corresponding force would be 68,3kN. Computing the ratios of
those different values of required forces to the inite element result
one concludes that the stiffness of the subassemblage is either
overestimated by 23% or underestimated by 16%.
Figure 4(a) shows color-illed contours of shear stresses. It can be seen that there exists a high concentration of shear stress in
the joint zone. These stresses result from the combined action of normal stresses due to bending moments of same sense applied
by beams and columns to the joint. Figure 5(a) shows a represen
-tation of the moments applied by the beams to the joint. Figure
5(b) shows the normal stresses resulting from the applied bending moments and the required shear stresses inside the joint to main-tain equilibrium. Joint shown in Figure 5(a) also suggests that the largest contribution to joint deformation is due to shear distortion, and not bending in the interior of the joint.
For the second case, shown in Figure 3(b), of the illustrative ex
-Figure 5 – (a) Joint deformed configuration; (b) Shear and normal stresses
Figure 6 – (a) Interior frame joint substructure; (b) Concentration of shear stress inside the frame joint
It can then be concluded that the contribution of joint lexibility to dis
-placements is signiicant and must be taken into account in checking the limit state of excessive lateral displacements of building frames. In ultimate limit states second order global effects are also directly affected by joint lexibility, whose capacity to absorb the shear force
must be checked.
3. Complete joints
Consider again the model shown in Figure 4(a), which corresponds to the complete joint of Figure 3(a). The top section displacement is
due to contributions of beams, columns, and joint deformations. The deformation in the joint zone has normal, bending, and shear
com-ponents. The most signiicant part is due to shear distortion that will be discussed in more detail in order to develop of an approximate expression of its stiffness where the important factors are included, with the correct power. In a second step the approximated expression is adjusted as a result of the conducted parametric study.
3.1 Flexibility of complete frame joints
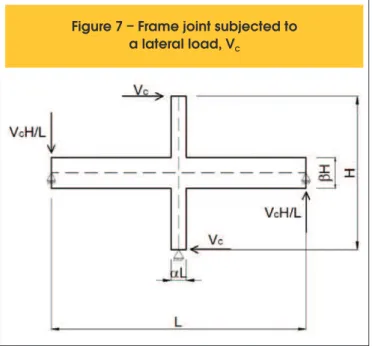
Consider the subassemblage in Figure 7 subjected to a horizontal loading, VC , applied to the top of the column. Different modeling alternatives for joint lexibility of steel frames made of wide-lange sections are discussed by Charney and Downs [5]. They show
that if on equates the lever arm between tension and compression stress resultants to the beam depth, the horizontal shear at the center of the joint, VN (see Figure 5(b)), is given by:
(1)
Where α is the ratio of column width to beam span, L. The ratio of
beam depth to story height, H, is equal to β, as depicted in Figure 7. The average shear stress is given by:
(2)
Where: t=joint thickness and sN=volume of joint region.
Figure 7 – Frame joint subjected to
a lateral load, VC
Figure 8 – (a) Adjusted rigid links model; (b) scissors model
Substituting VN in Equation (2) for its value in Equation (1), on gets:
(3)
Using the unit dummy load method for computing the horizontal
displacement of the upper section of the column one has that the shear stress corresponding to VC =1 is:
(
4)
Thus, the contribution, ΔN , to the horizontal displacement at the top
of the column due to shear stress at the joint is given by:
(
5)
Where G is the transverse modulus of elasticity of concrete. The two different alternatives for the modeling of joint lexibility dis -cussed in the following sections are:
Adjusted rigid links model. Scissors model.
3.2 Adjusted rigid links model
As previously discussed, the simple adoption of rigid links in the interior of the beam/column joint results in stiffness over
-estimation. A frequently adopted alternative is to adjust the length of the rigid links by multiplying by a factor η ≤ 1, so as
to shorten them, as can be seen in Figure 8(a). This model
implicitly assumes that flexibility is due to bending deformation
inside the joint.
Parametric study conducted by Horowitz and Marques[6] shows that η values varies between 0.44 and 0.75, and is high
-ly dependent on the ratio of beam to column section heights,
thus not being convenient for general use. This finding is
cor-roborated by the recent study of Birely et al [7] where the ad -justed rigid links model is used for seismic design and
evalu-ation, based on a data base of experimental results including 45 cross type interior joints. Depending on frame effective stiffness approach and joint reinforcement design criterion η values vary all the way from 0 to 1. Therefore this model is not pursued any further in this study
3.3 Scissors model
Consider the model shown in Figure 8(b) consisting of rigid links at the ends of the members inside the joint, a hinge, and a torsional spring. The stiffness of the torsional spring represents the shear
stiffness of the joint. This simple model was proposed by Krawin
-kler and Mohasseb [8] to consider the effect of panel zones of steel
moment-resisting frames.
For the scissors model the moment in the spring is VC H. The
dis-placement at the top of the column only due to the lexibility of the joint region is given by:
(6)
Where: KNT = stiffness of the spring of the scissors model.
Equating the displacements given by Equations (5) and (6):
(
7)
Comparative studies of steel interior joint subassemblages with ex
-perimental results and full planar frames, including P-Delta effects, reported in Charney and Downs [5] shows that the scissors model
is effective for steel building structures in general.
3.4 Parametric study of complete frame joints
Since simplifying assumptions were adopted regarding the distri -bution of shear stresses and lever arm of the normal stress resul-tants, a correction factor, g, is needed in Equation (7). The resulting
expression for the torsional spring is then given by:
(8)
A parametric study was conducted keeping constant the width
of all members at 20 cm and beam spans of 5m between
umns. Story heights of 3 and 4meters were considered. For
each height, values of 40, 60, 80, and 100cm were adopted for both beams and columns depths. Adopted values for the correction factor g for cross type interior joints, T-lateral and
T-top joints, and L-type joints will be denoted by gC , gT and gL,
respectively.
3.4.1 Cross type interior joints
Initially a parametric study for the interior Cross-type joint is conducted. The boundary conditions applied to the three-di
-mensional model are the same as those used in the examples
of Section 2. The adopted value of parameter g is obtained comparing results from the scissors and the finite elements models.
The irst issue to be discussed is the appropriate value of the
joint volume, sN , that should be adopted for joints with general
width/depth ratios. Figure 9 shows the shear stress contours for
two different joint geometries: square, and the one in which the
height is twice its width. It can be readily noticed that the behav
-ior changes substantially. To approximate the geometric effect,
Horowitz and Marques [9] suggests the following approach for
the computation of the effective joint volume:
(9)
Where a and b are the joint dimensions, with a ≤ b, and t is the joint thickness.
Figure 10 shows the surface that represents the variation of the computed correction parameter, g, with the depths of beam
and column sections, for a story height of 3m. From the analy -sis of the obtained results the value of the parameter g for
cross-type joints, gC , was taken as 0,45, which represents a
value slightly below the average with a bias to larger flexibility. This is also representative for story height of 4m as shown in Horowitz and Marques [9], where the authors detail extensive parametric study of the scissors model applied to complete
interior joints.
Figure 10 – Variation of the parameter
for 3 meters story height
Figure 11 – Anti-symmetric model in finite
elements for T-Lateral and T-Top exterior joints
Figure 1
2 – Finite element anti-symmetric model
for L-type joints
3.4.2 Complete T-Lateral and T-Top exterior joints
Consider now the T-Lateral and T-Top exterior joints. Typical three-dimensional inite elements models are shown in Figure 11 with the imposed boundary conditions, where u, v and w are
trans-lations along global axes x, y and z, respectively. An anti-symmet
-ric displacement ield was applied in order to force a zero moment
section at mid-height of the column and mid-span of the beams
without resorting to multi-node artiicial constraints.
Similarly to cross-type joints the correction factor, gT , for T-type joints, is evaluated as the result of a parametric study. The inal
adopted value is, gT = 0,3, as reported by Horowitz and Marques
[10], where the authors give a detailed analysis of the scissors model applied to complete T and L-type joints.
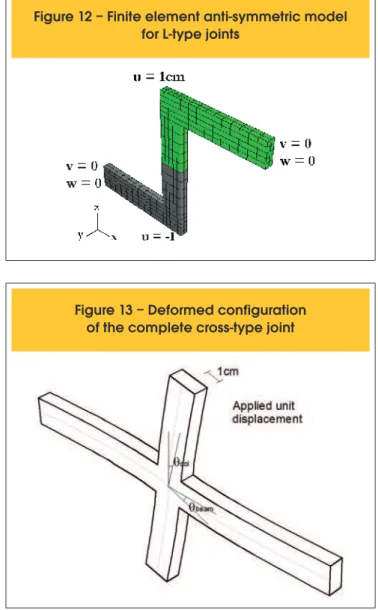
3.4.3 Complete L-type exterior joints
The previously used modeling techniques are also employed for L-type joints as shown in Figure 12.
As a result of the parametric study it was adopted, gL = 0,1, as reported in Horowitz and Marques [10].
4. Concentric joints
4.1 Modeling the lexibility of concentric joints
Consider the beam/column joint shown in Figure 13 subjected to an arbitrary displacement at its top section. One has that the dif -ference between the rotation of the beam, qbeam, and the rotation of the column, qcol, is due to the shear distortion of the joint region, as discussed in Section 2.
Consider now the concentric cross-type joint, shown in Figure
14(a), subjected to a uniform displacement at its top section. The
elastic restraint from strip B-B’ is less effective than that offered by A-A’ due to the column horizontal torsional deformations in the
region of framing of the beams.
In order to take into account this phenomenon, we consider a tor-sional member embedded in the column as show in Figure 14(b).
The additional lexibility of the joint is that resulting from the lex
-ibility of the torsional member, similarly to the proposed ACI code [11] equivalent frame formulation provisions for the computation of column stiffness in lat slabs.
The differential rotation between the beam and the column, qconc,
is given by:
(10)
The value of qconc can be taken as the sum of the differential rota-tion of the column at the point of incidence of the beam, qA, and the average rotation of the torsional member inside the joint, qt,average.
As lexibility is the inverse of stiffness, and considering qA as being
that corresponding to a complete joint, one has that:
(11)
The value of Kcomplete was derived in Section 3.4 for the various
types of joints. The term corresponding to the torsional stiffness is
detailed below.
Figure 14 – (a) Complete cross-type joint; (b) Cross-type with torsional member
4.1.1 Torsional stiffness
Consider a column connected to a torsional member and subject-ed to a unit torsional moment, as shown in Figure 15(a). Assuming a linear distribution of moment per unit length and considering that
the maximum value of the torsional moment at the center of joint
is such as to provide a unit area under the diagram (see Figure
15(b)), it follows that the function that expresses the change of the applied moment to only one of the two arms of the torsion member, as shown in the discussion of the equivalent frame method in Mac
-Gregor’s textbook [12], is:
(12)
where bC is the width of the column (see Figure 14(a)).
From the loading distribution one can obtain the torsional moment diagram T(x) by integrating the function t(x), as shown in Figure 15(c):
(1
3)
Function T(x) expresses the variation of the torsional moment
along the member.
From Figure 15(c) one has that the value of T at the point of
fram-ing of the beam on the column, point A of strip A-A’ in Figure 14(a), is given by:
(1
4)
Where bB is the width of the beams.
The value of the derivative of the rotation in each section along the torsional member with respect to x is obtained by dividing the
torsional moment at each section by CG, as shown in Figure 15(d), is given by:
(15)
Where G is the transverse modulus of elasticity of the mate
-rial and C is the torsional constant used in the ACI code [11], given by:
(1
6)
Where x is the least value between bC and bB, and y being the
largest.
The rotation at the end of the member is the integral of the
deriva-tive of the rotation along the member, and is given by:
(1
7)
Poisson’s ratio for concrete is taken as 0,2, thus the transverse modulus of elasticity is 0,42E. Substituting G for E/2, as suggested in the ACI code [11], and assuming that the average rotation of the
member is one-third of the rotation at its end, one concludes that:
(18)
Torsional stiffness Ktor is the inverse of lexibility and therefore is given by:
(19)
Figure 15 – Side view of the joint showing the
torsional member; (b) torsional moment applied to the
member; (c) torsional moment diagram in the torsional
member; (d) derivative of rotation along the member
A
B
C
4.2 Parametric study of concentric joints
Substituting the values of Kcomplete and Ktor in Equation (11) one ar
-rives at the following expression:
(20)
Where g and k are correction factors. The values of g were
obtained for each type of joint in Sections 3.4.1 through 3.4.3.
In the following sections the values for k are obtained from a
parametric study, similar to the ones conducted for complete type joints.
4.2.1 Concentric cross-type interior joints
In this new parametric study subassemblages are analyzed with story heights of 3 and 4 meters, beams with cross-section of 20x40, 20x60, 30x40, and 30x60cm and columns with
cross-section heights of 20, 30 and 40cm and widths of 40, 60, 80, 100, 120, 140, 160, 180 and 200cm. As in the modeling conducted for complete joints, the horizontal translation in the bottom of the col-umn and the vertical translation at the ends of the beams were pre-vented. The reaction force resulting from an imposed displacement
of 1 cm applied at the top of the column of the inite element model
is computed for each subassemblage. Figure 16 shows a
cross-type joint with applied boundary conditions and external loading.
As seen in Section 3.4.1, the value of correction parameter for
complete cross-type joints is gC = 0,45. Using k=1 in Equation (20)
to compute the spring stiffness of the scissors model results in
dif-ferences of less than 5% when comparing with the inite element analyses. Therefore the correction factor of the torsional term for concentric cross-type interior joints is taken as, kC=1.
4.2.2 Concentric T-Lateral exterior joints
Consider now T-lateral type joints. The three-dimensional inite
element models are shown in Figure 17(a). Using gT = 0,3 and adoptingkT-Lat = 1, the maximum difference obtained with the pro
-posed model when compared with the inite elements results is in the order of 6%.
4.2.3 Concentric T-Top exterior joints
The modeling of the T-Top joint is conducted in the same way as for the T-lateral exterior joints, as can be seen in Figure 17(b). If
one uses gT = 0,3 and k=1 in Equation (20) for the computation of
the torsional stiffness, the resulting frame model is 20% stiffer than the inite element model. Therefore based on the parametric study
Figure 16 – Cross-type interior joint with its
boundary conditions and load
Figure 17 – (a) Model of the T-Lateral exterior joints; (b) model of the T-Top exterior joints;
(c) model of the L-type joints
it was adopted kT-Top = 0,5 which results in a maximum difference
of 10% with respect to inite element analyses.
4.2.4 Concentric L-type joints
Figure 17 (c) shows the three-dimensional model used for L-type joints with its applied boundary conditions. The modeling of L-type
joints using gL = 0,1 and k=1, as in the case of T-Top exterior joints,
presents signiicant differences with respect to inite element re
-sults, in the order of 40%.
As a result of the conducted parametric study it is adopted kL=
0,25. The use of this correction parameter decreased the maxi
-mum misit in stiffness of the results from the two models to 20%. Since this type of joint is less frequent in the structures of buildings no signiicant loss of precision in global lexibility is expected.
5. Results and discussion
5.1 Comparison with experimental results
In order to calibrate the modeling of joint lexibility with real cases of structural buildings we initially conduct a comparison of the pro
-posed scissors model prediction with experimental results found in
the literature.
5.1.1 Cross-type interior joints
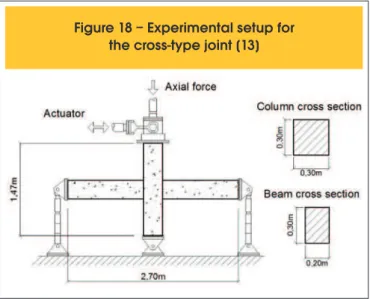
Consider the experimental arrangement shown in Figure 18 de
-veloped by Shiohara et al [13]. The columns have cross-section of 30x30cm, the beams cross section is 30x20cm, the height of the
column is 1,47m and the length of the beam is 2,7m. NBR-6118
code [2] recommends maximum lateral displacement of H/850 for the wind action, representing a displacement of 0,12% of the story height. Using the experimental results of shear versus displacement, one reaches the conclusion that for a 0,12% drift, the corresponding horizontal force is 21kN. The concrete strength is equal to 28 MPa.
The concentric scissors model is constructed with the following parameters: E=0,85×5600(28)0,5=2,52×10⁴MPa; G=1,05×10⁴MPa; a=0,111; β=0,204; sN=2,7×10
2 m3; K
comp=272 MN-m/rad; Ktor=40783 MN-m/rad; Kconc=270 MN-m/rad.
The following four structural models are considered for comparison purposes:
n Finite Elements.
n Bars with unadjusted rigid links.
n Scissors model with uncracked bars.
n Scissors model with effective moments of inertia according to the NBR6118 code: Icol,e=0,8Icol; Ibeam,e=0,5Ibeam; KNT,e=0,8KNT. Where Icol,e and Ibeam,e are the effective moments of inertia of
columns and beams to be used in the structural analysis to ap
-proximately take cracking into account. The effective value of the
torsional spring stiffness, KNT,e, is computed using the column re-duction factor.
The obtained results from the four models are shown in the Table 1. Results in Table 1 indicate that the scissors model with uncracked
bars, reproduced quite accurately the results of the inite element model, demonstrating the suitability of the parametric adjustment. In order to reproduce the experimental results the gross moment
of inertia of the members must be reduced to take cracking into account. The unadjusted rigid link model is twice as stiff as the scissors model with effective moments of inertia.
5.1.2 T-Lateral exterior joint
From the experimental specimen of the T-Lateral exterior joint shown in Figure 19 [14], comparisons were conducted with the
proposed model. The specimen consists of columns 2,70m high and a beam with span of 2,15m. The column has a cross-section
Figure 18 – Experimental setup for
the cross-type joint [13]
Figure 19 – Experimental setup for
the T-Lateral exterior joint [14]
Table 1 – Comparison of actuator force with
numerical results – Cross-Type interior joint
Model
Shear Force, V (kN)
cTheoretical
Experimental
Finite Elements
Unadjusted rigid link
Scissor's Model with
uncracked bars
Scissor's Model with
cracked bars
35,5
43,1
36,1
21,2
21
21
21
of 40x60cm and the beams 45x30cm, the concrete strength is 29,5MPa. In the experimental arrangement the columns ends are hinged in order to simulate the inlection points in a real building frame and cyclic loading is applied at the end of the beam. Using the experimental data provided by the senior author of Reference [14], it was found that for a displacement of 5,28mm, correspond
-ing to a 0,25% drift, the applied force is 48,3 kN.
The concentric scissors model is constructed with the following pa-rameters: E=0,85×5600(29,5)0,5=2,58×10⁴MPa; G=1,08×10⁴MPa; a=0,093; β=0,167; sN=0,102 m3; Kcomp=787 MN-m/rad; K
tor=26209 MN-m/rad; Kconc=587 MN-m/rad.
The same four kind of models used in the previous section are compared in Table 2. The scissors model with uncracked bars
presents a 8,5% error when compared to the inite element model.
Considering the cracking of the model based on the reduction fac-tors of the gross moment of inertia of the sections recommended
by the Brazilian code, NBR 6118 [2], the prediction error for the proposed model with respect to the experimental results is 3,9%.
Once again the unadjusted rigid links proved to be twice as stiff as the cracked scissors model.
5.1.3 L-type joint
In the case of concentric L-type exterior joints, the proposed mod
-el was compared with experimental results obtained by Ang-ela
-kos[15]. Figure 20 shows a schematic representation of the ex -perimental arrangement. The specimen has a span of 1,325m and
height of 0,914m. The cross-section of the beam is 28cm by 40cm and that of the column is 40cm by 40cm. It was used a 1,83mm displacement representing the magnitude of the serviceability limit imposed by the NBR 6118 code [2]. The concrete strength is 31,7MPa. The concentric scissors model uses the following pa -rameters: E=0,85×5600(31,7)0,5=2,68×10⁴MPa; G=1,12×10⁴MPa; a=0,152; β=0,219; sN=0,064 m3; Kcomp=180 MN-m/rad; K
tor=35275 MN-m/rad; Kconc=179 MN-m/rad.
The same four models previously used are compared in Table 3. Another feature is to be highlighted. Different experimental results
were obtained for displacements that open or close the joint. This demonstrates the importance of the contribution of the reinforce-ment slip. Once more it can be seen the small difference, around
4%, between the proposed scissors model and the result of the inite element analysis. When the cracked scissors model is com
-pared with the average of the experimental results, it is observed that the difference is only 2,9%.
5.2 Multi-story frames
In order to assess the accuracy of the proposed simpliied joint model, six multi-story frames without slabs were analyzed and comparisons
made between unadjusted rigid links, proposed scissors model and
the inite elements model. In Figure 21 it can be observed typical ge
-ometry of the frames where L is the bay length, H is the story height, nbay is the number of bays and nsto the number of stories.
Table 2 – Comparison of actuator force with
numerical results – T-Lateral exterior joint
Model
Shear Force, V (kN)
cTheoretical
Experimental
Finite Elements
Unadjusted rigid link
Scissor's Model with
uncracked bars
Scissor's Model with
cracked bars
96,9
102,3
88,7
50,2
48,3
48,3
48,3
48,3
Figure 20 – Experimental setup for L-type joint [15]
Table 3 – Comparison of actuator force with numerical results – L-type joint
Model
Shear Force, V (kN)
cOpening
Theoretical
Experimental
Closing
Finite Elements
Unadjusted rigid link
Scissor's Model with
uncracked bars
Scissor's Model with
Figure 21 – Schematic detail of the geometry
and the loading applied to the frames
In all cases a 10kN lateral load was applied in the irst three and the last loors while a 15 kN load was applied to the intermediate remaining loors. The horizontal load was applied in the joints of the outer columns. In order to verify the effect of the geometric
Figure 22
– Applied loads for frame model 1
nonlinearity, a vertical load of 15 kN is applied to the outer columns
and 30 kN to the inner columns at all stories. The load applied to the three-dimensional model of frame 1 can be seen in Figure 22.
In the irst two examples the frames contain complete joints only, while the remaining frames contain concentric type joints only. Table 4 summarizes the geometry of the frames adopted in the analyses.
In Table 5 second-order analysis results are presented, where the
percentage difference for the displacement response of each
mod-el is computed with respect to the inite mod-element modmod-el. It can be readily seen that the scissors model presents the best results when compared to the inite element model. The maximum percentage difference is 5%, while for the model using unadjusted rigid links the difference increases to 16%. The last two columns contain lateral
displacements of the scissors model with cracked members and the percentage increase due to cracking. It can be seen that average
ampliication of displacements is 46,5% which has a signiicant im -pact on bending moments of beams and columns.
6. Conclusions
Beam/column joint lexibility in usual reinforced concrete building
frames, disregarding the presence of slabs and transverse beams,
contributes around 20% of the total lateral displacement. Therefore joint lexibility modeling is needed to check the excessive lateral displacement serviceability limit state as well as the global second
order effects in ultimate limit states.
The NBR-6118 code [2] suggests the use of a rigid link model
whose adjusted lengths are functions of the framing beam depths.
Since joint lexibility stems from shear distortion, not bending in
beam/column joints including the usual case of column sections wider than framing beam sections. Simple expressions for spring stiffnesses are obtained from mechanical models affected by cor
-rection factors whose values are determined from extensive para -metric studies.
Comparative studies with experimental results demonstrate that the proposed model has adequate accuracy for design purposes if
member stiffnesses are reduced according to the NBR- 6118 code
[2] factors in order to take cracking into account. Maximum differ
-ence of 5% in displacements was observed between the proposed approximate scissors model and three-dimensional second order inite element analyses of six building plane frames.
7. Acknowledgements
The authors wish to recognize CAPES for inancial support and Professor Hunk-Jen Lee for providing his experimental data.
8. References
[01] SHIN, M.; LAFAVE, J. M. Modeling of joint shear
deformation contributions in RC beam-column connections to overall frame behavior. Structural
Engineering and Mechanics, v.18, n.5, 2004;
pp.645-669.
Table 4 – Geometry of analyzed frames
n
baysn
baysFrames
Frames
Complete joints frames
Concentric joints frames
L (m)
L (m)
n
ston
stoH (m)
H (m)
Beam section (cm)
Beam section (cm)
Column section (cm)
Column section (cm)
3
1
3
3
2
1
5
6
5,3
5
4
5
1
2
3
4
5
6
14
14
16
16
16
20
3
3
3
3
3
3
20x60
20x80
20x60
15x70
20x60
20x60
20x40
20x60
100x30
130x30
100x20
100x30
Table 5 – Results os second order analyses
Drift (cm)
Drift (cm)
Error (%)
Drift (cm)
Error (%)
Drift (cm)
Increase (%)
Finite element
Unadjusted rigid links
uncracked bars
Scissor's model
Scissor's model
cracked bars
Frames
1
2
3
4
5
6
6,23
9,12
5,36
4,23
13,84
29,12
5,26
8,23
4,64
3,56
12,11
27,07
6,52
9,34
5,32
4,11
14,03
29,50
9,24
12,34
8,52
6,60
19,38
43,08
15,5
9,8
13,4
15,8
12,5
7,0
4,6
2,4
0,7
2,8
1,4
1,3
41,7
32,1
60,2
60,6
38,1
46,0
[02] ASSOCIAÇÃO BRASILEIRA DE NORMAS TÉCNICAS. Projeto de estruturas de concreto - Procedimento. -
NBR 6118, Rio de Janeiro, 2007.
[03] ABAQUS, User’s Manual, version 6.3, Hibbitt, Karlsson& Sorensen, Inc, Pawtucket, RI, 2002. [04] ABAQUS, Getting Started with ABAQUS/Standard,
version 6.3, Hibbitt, Karlsson& Sorensen, Inc, Pawtucket, RI, 2002.
[05] CHARNEY, F. A.; DOWNS, W. M. Modeling
procedures for panel zone deformations in moment
resisting frames, EECS/AISC Workshop on Connections
in Steel structures, Amsterdam, 2004..
[06] HOROWITZ, B.; MARQUES, S. J. P. J. Modelação da lexibilidade de nós internos de pórtico em concreto armado. In: CMNE/CILAMCE, 2007, Porto-Portugal. [07] BIRELY, A. C.; LOWES, L. N.; LEHMAN, D. E. Linear
analysis of concrete frames considering joint lexibility, ACI Structural Journal, V. 109, No. 3, May-June 2012,
pp. 381-391.
[08] KRAWINKLER, H.; MOHASSEB, S. Effects of panel
zone deformations on seismic response, J. Constr. Steel Res., V. 8, 1987, pp. 233-250.
[09] HOROWITZ, B.; MARQUES, S. J. P. J. Efeito da seção do pilar na lexibilidade de nós internos de
Brasileiro do Concreto, IBRACON-CBC, 2007, Bento Gonçalves, v.1, 2007.
[10] HOROWITZ, B.; MARQUES, S. J. P. J. Modelação da lexibilidade de nós de pórtico em concreto armado
com peças de mesma largura. In: 50º Congresso Brasileiro do Concreto, IBRACON-CBC, 2008, Salvador - Brasil, v.1, 2008.
[11] ACI Committee 318, Building Code Requirements for Structural Concrete (ACI 318-08) and Commentary, American Concrete Institute, Farmington Hills, MI, 2008.
[12] MACGREGOR, J., Reinforced Concrete: Mechanics and Design, Prentice Hall, 3ed, 1997.
[13] Shiohara, H., Zaid, S. e Otani, S., Test of an Innovative Reinforcing Detail for High Performance R/C Interior Beam-Column Connection Subjected to Seismic Action, Proceedings of the Third International
Conference on Concrete under Sever Conditions, Vancouver, 2001, pp. 739-746.
[14] LEE, H. J., YU, S. Y., Cyclic Response of Exterior Beam-Column Joints with Different Anchorage Methods, ACI Structural Journal, v.106, n.3, 2009;
p.329-339.