Synthesis and Structural Properties of Niobium Pentoxide Powders: A Comparative Study
of the Growth Process
Angela M. Rabaa, Jorge Bautista-Ruíza, Miryam R. Joyab,*
Received: December 02, 2015; Revised: August 23, 2016; Accepted: September 10, 2016
Powders Nb2O5 were prepared by two diferent synthesis method, Sol-Gel and polymeric precursors (Pechini). In the Pechini method before adding the citric acid in the process, four diferent solutions were used to get the samples. For Sol-gel method, two diferent processes were also used in obtaining powders. The precursor was completely solubilized in ethanol and then hydrolyzed with ammonia and water. The calcination of the samples was between 500 and 750°C. The resulting powders were characterized by Scanning Electron Microscopy (SEM), Brunauer, Emmett and Teller (BET) surface
area measurements, UV-visible and Raman spectroscopy. The formation of T−Nb2O5 orthorhombic
took place upon calcination at 7500C. Crystallite sizes were determined using the Scherrer method which resulted in an uniformed size of about 25 − 65nm. Ultraviolet-Visible difuse relectance
spectroscopy indicated a variation in the optical band gap values (3.32-3.40 eV) in crystal growth
process. The Raman vibrational modes indicate the presence of the orthorhombic phase of the material.
Keywords: comparative study, sol-gel, Uv-Vis, Inelastic light scattering and Nb2 O5
* e-mail: [email protected]
1. Introduction
Niobium Pentoxide (Nb2O5) is an n-type semiconductor
with a band gap of about 3.4 eV, low in comparison to other
oxides. The interest in studying the Nb2O5 is due to its
remarkable physicochemical properties and structural isotropy suitable for a wide range of applications in the construction of gas sensing, electrochromics display and photoelectrodes,
as well as in ield-emission displays and microelectronics1-6.
Studies were conducted in the past on the use of Nb2O5
nanoparticles for environmental remediation in water through of photocatalytic processes. In these technologies
Nb2O5 shows great potential because of its stability in an
aqueous medium, its surface acidity, redox and photocatalytic properties, which are instrinsically linked to its structure7-9.
The main phases reported in literature for Nb2O5 are
TT-Nb2O5 (pseudohexagonal) at low temperatures, T-Nb2O5 (orthorhombic structure) heating the amorphous oxide to 600
and 800°C, and H-Nb2O5(monoclinic structure) heating to
about 1100°C 10. In general the crystallization conditions
of each Nb2O5 structure depends on the starting materials,
synthesis methods and heat treatment conditions. In particular the T-Nb2O5 net parameters are: a = 6.17Å; b = 29.32Å;
c = 3.94Å, and its crystalline structures consist of 4 × 4
blocks of corner-shared NbO6 octahedra, with connected
blocks sharing the edges of the octahedron11.
In order to get thin ilms of Nb2O5 there are two phase deposition methods. Liquid phase deposition and
vapour phase deposition. For the liquid phase methods such as hydrotermal, solvothermal, anodization, sol-gel and electrodeposition exist and the physical and chemical
methods for the vapour phase12. Additionally, nanostructures
of Nb2O5 are obtained through sol-gel and precipitation methods. Besides, the preparation of niobium base materials also the Pechini route is used.
Soares et al.11 reported the synthesis of Nb
2O5 samples by means of the Laser Floating Zone (LFZ) technique and the solid-state reaction in order to study some of their physical properties as a function of synthesis conditions. The authors found a structural orthorhombic to monoclinic phase transition observed in samples sintered at temperatures
higher than 800°C. Rosario et al.13 prepared Nb
2O5 powders
and ilms using the niobium salt NH4H2[NbO(C2O4)3].3H2O
as starting material. Nb2O5 nanoparticles obtained by
the oxidant-peroxo method14 were synthesized employing
ammonium niobium oxalate (NH4[NbO(C2O4)2(H2O)2].nH2O as a starting precursor. These nanoparticles presented mixed phases of Nb2O5 orthorhombic and Nb2O5nH2O. Sol- gel methods have been widely reported in the production of porous and high surface area niobium oxides. Molecular precursors, mainly metal alkoxides, are generally used as
starting materials. In the work15Nb
2O5 amorphous powders
prepared by the Sol-gel technique and their crystalline structures were analyzed through a controlled heat-treatment process. Ristic et al.16 reported that the Nb(OC
2H5)5 was
used as a starting precursor in the preparation of the Nb2O5
powders using the Sol-gel procedure. The initial Nb2O5
a Departamento de Física, Universidad Francisco de Paula Santander, Cucuta, North Santander,
Colômbia
b Departamento de Física, Facultad de Ciencias, Universidad Nacional de Colombia, Cra 45, Bogotá,
powders were amorphous and by heating them at 500°C
contained Nb2O5 (TT-phase), whereas at 650°C the Nb2O5
(T-phase) was obtained. Uekawa et al.17 reported that the
synthesis of highly crystallized Nb2O5 nanoparticles with a
diameter of 4.5nm was based also on a Sol-gel route.
In this research, Nb2O5 nanosize powders were prepared
by two diferent routes: a) the Sol-gel technique, for its
similarities with the Pechini route (in other research also
known as the citrate gel route15) and b) the Pechini method,
using diferent sintering temperatures (500-750°C). The powders obtained were characterized by X-ray difraction
(XRD) to evaluate the inluence of heat treatment on the
formation of the TT- Nb2O5 and T-Nb2O5 phases. Also by
the BET method in order to obtain measurements of surface
area, the UV-vis difuse relectance spectroscopy (DRS) to
identify the band gap energy and the Raman spectroscopy to
perform a vibrational characterization.
2. Experimental details
2.1. Preparation of the nanosize powders
Tables of the synthesis procedure are shown in (1) and (2). The samples 1−Nb2O5 and 2−Nb2O5 were synthesized
by the Sol-gel method according to literature procedures16.
Niobium (V) ethoxide, (Nb(OC2H5)5 99.999% Alfa Aesar) was employed as the starting precursor and absolute ethanol for analysis (Merck) and Ammonia hidroxide 30% (Panreac) were
also used. The samples 1−Nb2O5 were prepared by adding
5g of Nb(OC2H5)5 to 90ml of absolute ethanol which was
stirred vigorously, then 5ml of Ammonia hydroxide was
added to the precipitation system. The samples 2−Nb2O5
were prepared by adding 5g of Nb(OC2H5)5 to 94ml of absolute ethanol under vigorous stirring, then 1ml of distilled water was added to the precipitation system. After irmly shaking, the precipitation systems were transferred to petri dishes and
left to evaporate at 60°C on a stove; the solid residue was
subsequently dried at 160°C for 4h in an oven. The powders
obtained were calcined at 500, 650 and 750°C respectively for 2h. The samples A−Nb2O5, B−Nb2O5, C−Nb2O5 and
D−Nb2O5 were prepared using the Pechini method adapted
from previous procedures reported18.
Niobium chloride (NbCl5 99% Sigma-Aldrich) was
employed as the starting precursor, hydrated citric acid (99.5% Panreac) as a chelating agent and ethylene glycol (99.8% Panreac) as polymerizing agent. The employed solvents were: distilled water for the samples A−Nb2O5
and aqueous solutions of 65% HNO3, 37% HCl and 30%
NH4OH for the samples B−Nb2O5, C−Nb2O5 and D−Nb2O5 respectively. The precalcination was performed at 300°C for 4 hours. The powders that were obtained were calcined at 500, 650 and 750°C for 2h respectively (table 2).
Sol-gel and Pechini methods were chosen for their similarity and since these allow the preparation of homogeneous and
Table 1: Diferent conditions of the preparation samples in the
sol-gel method.
sample Hydrolysis Temperature °C
1-Nb2O5 – 500°C NH4OH 500
2-Nb2O5 – 500°C H2O
1-Nb2O5 – 650°C NH4OH 650
2-Nb2O5 – 650°C H2O
1-Nb2O5 – 750°C NH4OH 750
2-Nb2O5 – 750°C H2O
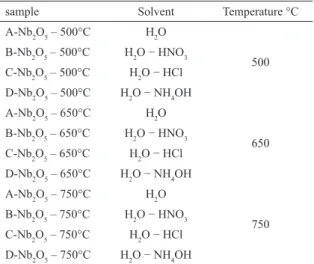
Table 2: Diferent conditions of the preparation samples in the
Pechini method.
sample Solvent Temperature °C
A-Nb2O5 – 500°C H2O
500
B-Nb2O5 – 500°C H2O − HNO3
C-Nb2O5 – 500°C H2O − HCl
D-Nb2O5 – 500°C H2O − NH4OH
A-Nb2O5 – 650°C H2O
650
B-Nb2O5 – 650°C H2O − HNO3
C-Nb2O5 – 650°C H2O − HCl
D-Nb2O5 – 650°C H2O − NH4OH
A-Nb2O5 – 750°C H2O
750 B-Nb2O5 – 750°C H2O − HNO3
C-Nb2O5 – 750°C H2O − HCl
D-Nb2O5 – 750°C H2O − NH4OH
highly pure powders and porous and high surface area oxides, with ine particles and adequate chemical composition. The Pechini route consists of the formation of chelates between metal ions and carboxylic acids. These are subsequently polymerized by a reaction with polyalcohols, which have a good distribution of metallic ions in the polymer structure, that when heated at moderate temperatures it favors the condensation reaction causing polyesteriication to occur. The excess water is removed and a homogeneous gel is
formed19,20. The sol-gel method enables homogenous samples
to be obtained at low temperatures and the starting cationic composition to be maintained by the use of metal salts as raw materials and mixing them in a liquid solution. The principal advantage of the Sol-gel method is that reagents are mostly mixed in atomic levels, which may increase the
reaction rate and decrease the heat treatment temperature21.
The XRD patterns were obtained using two diferent methods. In the irst term an Xpert-PRO PANalytical
difractometer (Co Kα1 radiation, λ= 1.78901Å), operating
at 40mA. A step of 0.0133° in 1 min, in the 2θ angle range of
10 – 90°was used. That equipment then required technical
support. For the remaining analysis an Xpert PANalytical
Empyrean Serie II Alpha 1 (Cu Kα2) radiation, λ=1.54442Å)
was used operating at 40mA with a step of 0.05° in 50 seconds,
crystalline phases was performed using the X’Pert HighScore PANalytical software. Raman spectroscopy was made using a commercial micro-Raman probe setup TG4000 Jobin Yvon
spectrometer (Raman excitation line: λ=532 nm) at room
temperature. The Brunauer-Emmett-Teller (BET) approach
was employed to determine the speciic surface area of the nanosize powders, employing a Micromeritics ASAP 2020 − 77 K apparatus with adsorption data at a relative pressure range of 0.03 − 0.15. Before the analysis, each sample was
outgassed at 100°C for 2 hours then the temperature was
increased to until 300°C. The UV-vis spectra were taken
using Cary 5000 spectrometer (varian) in difuse relection mode. A ield emission scanning electron microscope (SEM Vega3 Tescan) operating at 5.0kV was used to verify the material morphology.
3. Results and discussion
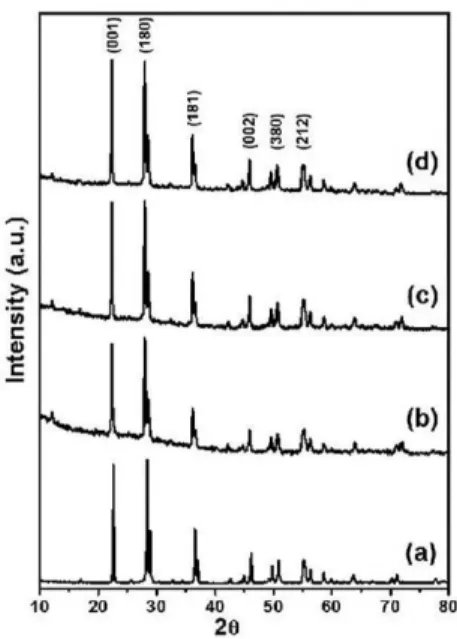
Figure 1 XRD patterns peak analysis veriies that those
Nb2O5 samples obtained by the Pechini method heated at
750°C have the orthorhombic crystalline structure due to the existence of dominant difraction peaks according to PDF cards No. 30-0873 (contained in the Power Difraction File) for the T-Nb2O5 phase, (a = 6, 175Å, b = 29,
175Å, c = 3, 930Å). The XRD patterns of the samples
obtained by routes based on the Pechini method at 650°C
also displayed the existence of the T-Nb2O5 phase although
with less crystallinity. At 500°C spectra obtained from routes
based on the Pechini method coincided with PDF cards No.
28-0317 for the low temperature pseudohexagonal TT-Nb2O5
phase (a = b = 3,607Å, c = 3.925Å).
In Figure 2 XRD patterns of the Nb2O5 samples obtained by the Sol-gel method are presented. The sharpness and intensity of all difraction peaks improve progressively with the increase in the calcination temperature which proves the crystallite growth of Nb2O5 nanoparticles. Figure 2
XRD patterns show that at 650 and 750°C the crystalline
structures are orthorhombic according to PDF cards No. 30-0873. In the XRD patterns of the 1-Nb2O5 – 500°C and 2-Nb2O5 – 500°C samples there are no appreciable peaks that specify the crystalline phase that was reached. In general
the XRD patterns structurally point out the pureness of the
Nb2O5 nanosize powders synthesized by Pechini and Sol-gel
methods due to the absence of undesired impurities generated from the precursors used in both methods.
Figure 1: XRD difraction patterns of samples obtained by Pechini
method; the samples correspond to T−Nb2O5 phase obtained by heating at 750°C. (a) A-Nb2O5 – 750°C, (b)B-Nb2O5 – 750°C, (c)
C-Nb2O5 – 750°C and (d) D-Nb2O5 – 750°C.
Figure 2: Sol-gel method, samples obtained by heating at 500,
650 and 750°C. (a) 1-Nb2O5 −500°C, (b) 2-Nb2O5 −500°C, (c) 1-Nb2O5 – 650°C, (d) 2-Nb2O5 −650°C, (e) 1-Nb2O5 −750°C and
(f) 2-Nb2O5 – 750°C.
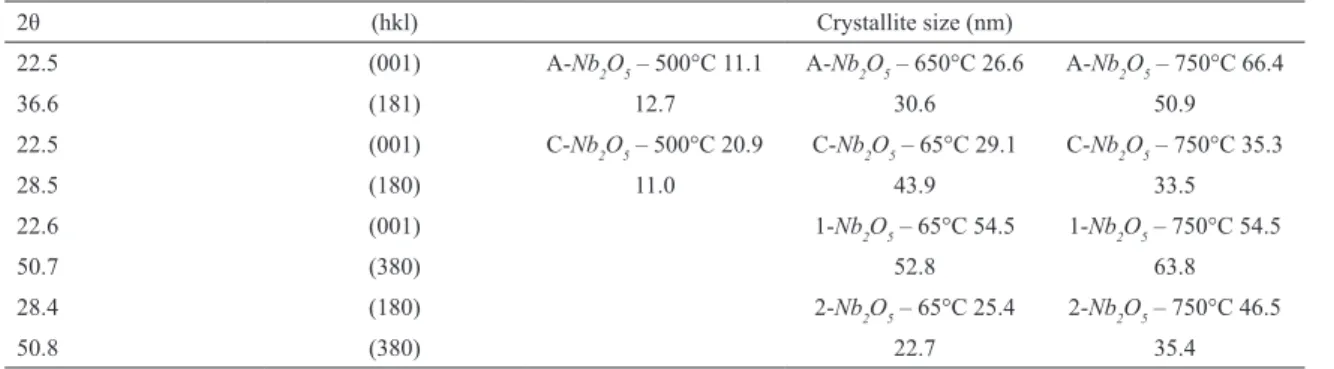
To analyze the crystallite growth, the crystallite size (L) of the Nb2O5 nanoparticles was calculated by the Scherrer’s equation L = Kλ/(βcosθ), (for peak broadening due to size efects) where K is the shape correction factor, 0.9 for L taken as the volume-averaged crystallite dimension perpendicular
to the hkl difractionplane; λis the wavelength used, θ
is the Bragg difraction angle measured hkl peak and
β represents the FWHM (Full width at half maximum)
measured in radians on the 2θ scale22. The broadening lines
chosen for the L estimate correspond to (001), (180), (181), (002), (380), and (212) crystalline planes according to PDF No. 01-071-0336 reported in Inorganic Crystal Structure
Database (ICSD)23. The crystallite size of nanoparticles
on the T-Nb2O5 phase increases from ~25 to ~65nm with
an increase in calcination temperature, as shown table 3. The crystallite size increases more with the A-Nb2O5 route
Table 3: Crystallite size estimated by Scherrer equation from the XRD data
2θ (hkl) Crystallite size (nm)
22.5 (001) A-Nb2O5 – 500°C 11.1 A-Nb2O5 – 650°C 26.6 A-Nb2O5 – 750°C 66.4
36.6 (181) 12.7 30.6 50.9
22.5 (001) C-Nb2O5 – 500°C 20.9 C-Nb2O5 – 65°C 29.1 C-Nb2O5 – 750°C 35.3
28.5 (180) 11.0 43.9 33.5
22.6 (001) 1-Nb2O5 – 65°C 54.5 1-Nb2O5 – 750°C 54.5
50.7 (380) 52.8 63.8
28.4 (180) 2-Nb2O5 – 65°C 25.4 2-Nb2O5 – 750°C 46.5
50.8 (380) 22.7 35.4
routes the crystallinity achieved at 650°C is very similar
to that achieved at 750°C. The achieved crystallinity with
1-Nb2O5 route is more or less uniform at 650°C and 750°C
while the crystallinity increases with the 2-Nb2O5 route
when the samples are sintered at 650°C and 750°C. This
is due to the fact that the crystallite size is greater when the hydrolisis is catalyzed in basic medium. The samples A-Nb2O5– 750°C and 1- Nb2O5 – 750°C have the L larger. In
general the route A of the Pechini method allows to obtain a larger crystallite size and 750°C is the more favorable crystallization temperature. Table 4 shows the results
of speciic surface area, SBET determined by taking data
at relative pressures between 0.03 and 0.15. The method had accuracy constraints during the measurement process.
This fact was observed because the values of SBETwere
less than 10m2/g. The S
BETdates show that the increase in
the calcination temperature from 500°C to 750°C resulted
in the progressive decrease of speciic surface area of the
Nb2O5 nanosize powders. This is mainly because a more
high calcination temperature can lead to a greater proportion of the pore coalescence due to the further crystallization of walls separating mesopores in their structure which be established through measurement of pore size. The B route
Pechini method did not show regularity in SBET downward
trend with increasing temperature, unlike C and D routes
which did. SBETof the samples obtained by Sol-gel method
did not display a decrease with the temperature. The similarity between speciic surface area of the C-Nb2O5 – 750°C,
D-Nb2O5 – 750°C and 2-Nb2O5 – 750°C samples agree with
the crystallinity achieved at 750°C and information compared
with the SEM images show as small SBETmeasurements
are associated with larger particle sizes.
Table 4: SBET values of the synthesized samples: sol-gel method 1 − 2 and Pechini C − D. The SBET was determined by taking data at relative pressures between 0.03 and 0.15.
Sample SBET (m
2/g) Sample S
BET (m
2/g) Sample S
BET (m
2/g)
C-Nb2O5 – 500°C 79.50 C-Nb2O5 – 650°C 14.52 C-Nb2O5 – 750°C 4.53
D-Nb2O5 – 500°C 75.85 D-Nb2O5 – 650°C 9.85 D-Nb2O5 – 750°C 4.44
1-Nb2O5 – 500°C 1.70 1-Nb2O5 – 650°C 1.17 1-Nb2O5 – 750°C 1.19
2-Nb2O5 – 500°C 1.30 2-Nb2O5 – 650°C 14.24 2-Nb2O5 – 750°C 4.68
This fact is well consistent with the observed results of a higher crystallinity and a larger crystallite size of the Nb2O5 nanoparticles at a higher calcination temperature (igure 2 and igure 3). When comparing the data re- ported in table 4 with
the SEM images it is concluded that the oxides prepared at
500°C by the method Pechini had a high SBETbecause at this
temperature the particle size is small.
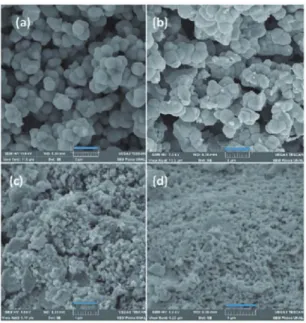
Figure 3 shows SEM photographs of the selected samples sol-gel and Pechini. Figure 3 also shows the SEM micrographs
of samples Nb2O5 by the Pechini (B and D) and sol-gel (1
and 2) method, at a temperature of 750°C respectively. The
samples obtained by Sol-gel (1,2-Nb2O5) show a structure
of the particles consisting of regular spherical particles of
well-deined shapes and sizes of approximately 1-2 µm, igure
3 (a),(b). In igure 3(c) and (d) for example, two samples are presented for Pechini method. These samples exhibit the nanoparticles formation, whereas the SEM photograph of sample (a) and (b) shows a unique spherical microstructure. The last two photographs show high-magniication SEM images. Here, it is also shown that particles involved are smaller. This indicates that by virtue of Pechini method, smaller and irregular particles are obtained.
In Figure 4 (a), (c) UV-Vis A − Nb2O5 material is observed
at diferent calcination temperatures. By extrapolating the
Figure 3: SEM micrographs of Nb2O5 particles: (a) 1-Nb2O5 −750°C for a resolution of 2µm, (b) 2-Nb2O5 – 750°C for a resolution of
2µm, 750°C for a resolution of 1µm.
Figure 4: UV-Vis Spectra of Nb2O5 nanoparticles synthesized by
the Pechini method (A-Nb2O5) at diferent temperatures: (a) 500,
(b) 650 and (c) 750°C.
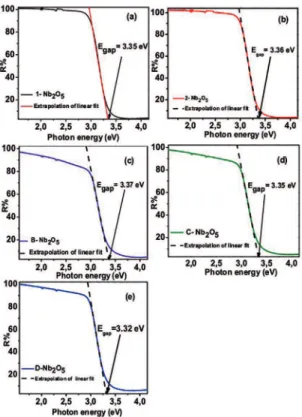
Figure 5 (a)-(e) UV-Vis for samples to 750°C by sol- gel
methods and Pechini. In literature, as a typical n-type wide
band gap semiconductor (Eg=3.4eV), Nb2O5 is the most
thermodynamically stable phase among various niobium
oxides24. As shown in igure 5 the band gap energy values
for diferent samples are very close to the value of literature between 3.32 and 3.37eV. Small changes in values can be related to particle size25. There is no clear explanation for
the discrepancy of the band gap in this study. As can be seen, the energy band by the two methods of growth varies, being lower for the B method Pechini while it remained practically the same for the other methods. Rigorously, we believe the particle size and band gap depend on: method of preparation, calcination temperature and grain size.
Figure 6 shows the Raman spectra for samples C-Nb205
by Pechini method at diferent calcination temperatures. As shown in igure 6 (a) and (b) the position of the Raman peaks is narrow and well deined which indicates crystallinity in the material of these calcination temperatures. In igure 6
(c) Raman modes for the calcination temperature of 500°C
can be observed. This spectrum does not have well-deined peaks which indicates an amorphous or poorly crystalline material. Bands corresponding to vibrations of cations occupying centres of octahedrons and tetrahedrons are found
in the 150-400cm-1range26-28. In the spectrum of Figure 6
(a-b), the peaks occur at 78.3, 127.4, 227.3 and 307.4cm-1.
Bands of the oxygen framework vibrations are located in the
500-1100cm-1range, igure 6(a-b) at521, 642.6, 689.3 and
843cm-1. With the decrease ofthe calcination temperature,
the peaks decrease rapidly.
Figure 7 (a) and (b) shows the Raman spectra of sample 2-Nb2O5 by Sol-gel method. For Irena et al.29 the bands in
the 400 - 800cm-1wavenumber region are assigned to the
symmetric and antisymmetric stretching mode of the Nb-O-Nb
linkage. While the Raman band at 235cm-1becomes the bending
mode of Nb-O-Nb. The spectra in igure 7, corresponds to a
well developed crystalline structure of Nb2O5. As shown in
igure 6 compared to igure 7 the Raman modes are narrower,
also the peak near 667cm-1 is much more intense. These two
igures again show that the calcination temperature of 700°C
Figure 5: UV-Vis Spectra of Nb2O5 nanoparticles at temperature of 750°C. (a) 1-Nb2O5 – 750°C, (b) 2-Nb2O5 – 750°C, (c) B-Nb2O5
– 75°C, (d) C-Nb2O5 – 750°C and (e) D-Nb2O5 – 750°C.
Figure 6: Raman spectra for C-Nb2O5 at (a) 750°C, (b) 650°C
and (c) 500°C.
Figure 7: Raman spectra for 2-Nb2O5 sol-gel method (a) 750º C and (b) 650º C.
shows that an increase of the synthesis temperature causes an increase in the material crystallinity because an increase in the synthesis temperature led to a sharp peak, this fact is veriied with the values of the crystallite size that were estimated by the Scherrer equation (Table 3).
4. Conclusions
The microstructure of the resulting T − Nb2O5 nanosize powder is linked to the two synthesis methods, because the properties of the niobium oxide powders are strongly dependent on the raw material and on the synthesis route used. The employed Pechini and Sol- gel routes allowed the
preparation of Nb2O5 nanosize powders. For heat treatment
temperatures about 500°C the powder has a TT − Nb2O5
phase. The heat treatment process allows the formation of T − Nb2O5 nanosize powders with an orthorhombic structure,
which was conirmed by XRD. The Raman spectroscopy
technique conirmed the phase transformations observed
by X-ray difraction. In the SEM it was observed that the
grain size is smaller for the Pechini method, but for the sol gel method it is more uniformed. As is been in the UV-VIS measurements conirmed that with the increase of the
5. Acknowledgements
Authors acknowledge financial support from the agencies; Universidad Francisco de Paula Santander, Cúcuta, Colombia; Universidad Nacional Colombia and Colciencias and CNPq Brazil.
6. References
1. Wang YD, Yang LF, Zhou ZL, Li YF, Wu XH. Efects of calcining temperature on lattice constants and gas-sensing properties of
Nb2O5. Materials Letters. 2001;49(5):277-281.
2. Mujawar SH, Inamdar AI, Patil SB, Patil PS. Electrochromic properties of spray-deposited niobium oxide thin ilms. Solid State Ionics. 2006;177(37-38):3333-3338.
3. Jose R, Thavasi V, Ramakhrisna S. Metal Oxides for Dye-Sensitized Solar Cells. Journal of the American Ceramic Society. 2009;92(2):289-301.
4. Lira-Cantu M, Krebs FC. Hybrid solar cells based on MEH-PPVand thin ilm semiconductor oxides (TiO2, Nb2O5, ZnO,
CeO2 and CeO2–CTiO2): Performance improvement during
long-time irradiation. Solar Energy Materials and Solar Cells.
2006;90(14):2076-2086.
5. Ahn KS, Kang MS, Lee JK, Shin BC, Lee JW. Enhanced electron difusion length of mesoporous TiO2 ilm by using Nb2O5 energy
barrier for dye-sensitized solar cells. Applied Physics Letters.
2006;89:013103.
6. Hashemzadeh F, Gafarimejad A, Rahimi R. Porous p-NiO/n-Nb2O5
nanocomposites prepared by an EISA route with enhanced photocatalytic activity in simultaneous Cr(VI) reduction and methyl orange decoloration under visible light irradiation.
Journal of Hazardous Materials. 2015;286:64-74.
7. Carniti P, Gervasini A, Marzo M. Dispersed NbOx Catalytic
Phases in Silica Matrixes: Inluence of Niobium Concentration and Preparative Route. The Journal of Physical Chemistry C.
2008;112(36):14064-14074.
8. Sreethawong T, Ngamsinlapasathian S, Lim SH, Yoshikawa S. Investigation of thermal treatment efect on physicochemical and photocatalytic H2 production properties of mesoporous-assembled
Nb2O5 nanoparticles synthesized via a surfactant-modiied sol–gel
method. Chemical Engineering Journal. 2013;215-216:322-330.
9. Marin ML, Hallett-Tapley GL, Impellizzeri S, Fasciani C, Simoncelli S, Netto-Ferreira JC, et al. Synthesis, acid properties and catalysis by niobium oxide nanostructured materials. Catalysis Science & Technology. 2014;4:3044-3052.
10. Zhao Y, Zhou X, Ye L, Tsang SCE. Nanostructured Nb2O5
catalysts. Nano Reviews. 2012;3:17631.
11. Soares MRN, Leite S, Nico C, Peres M, Fernandes AJS, Graça MPF, et al. Efect of processing method on physical properties of Nb2O5. Journal of the European Ceramic Society.
2011;31(4):501-506.
12. Rani RA, Zoolfakar AS, O’Mullane AP, Austin MW, Kalantar-Zadeh K. Thin ilms and nanostructures of niobium pentoxide: fundamental properties, synthesis methods and applications.
Journal of Materials Chemistry A. 2014;2(38):15683-15703.
13. Rosario AV, Pereira EC. Inluence of the crystallinity on the Li+ intercalation process in Nb
2O5 ilms. Journal of Solid State Electrochemistry. 2005;9(10):665-673.
14. Lopes OF, Paris EC, Ribeiro C. Synthesis of Nb2O5 nanoparticles
through the oxidant peroxide method applied to organic pollutant photodegradation: A mechanistic study. Applied Catalysis B: Environmental. 2014;144:800-808.
15. Graça MPF, Meireles A, Nico C, Valente MA. Nb2O5 nanosize
powders prepared by sol–gel Structure, morphology and dielectric properties. Journal of Alloys and Compounds. 2013;553:177-182.
16. Ristić M, Popović S, Musić S. Sol–gel synthesis and characterization of Nb2O5 powders. Materials Letters. 2004;58(21):2658-2663.
17. Uekawa N, Kudo T, Mori F, Wu YJ, Kakegawa K. Low-temperature synthesis of niobium oxide nanoparticles from peroxo niobic acid sol. Journal of Colloid and Interface Science.
2003;264(2):378-384.
18. Raba AM, Barba-Ortega J, Joya MR. The efect of the preparation method of Nb2O5 oxide inluences the performance of the
photocatalytic activity. Applied Physics A. 2015;119(3):923-928.
19. Bouquet V, Longo E, Leite ER, Varela JA. Inluence of heat treatment on LiNbO3 thin ilms prepared on Si(111) by the
polymeric precursor method. Journal of Materials Research.
1999;14(7):3115-3121.
20. Pechini MP, inventor; Sprague Electric Co, assignee. Method of preparing lead and alkaline earth titanates and niobates and coating method using the same to form a capacitor. United States patent US 3330697 A. 1967 Jul 11.
21. Galceran M,Pujol MC,Aguillo´ M, Díaz F.Sol- gel modiied Pechini
method for obtaining nanocrystalline KRE(WO4)2 (RE = Gd and
Yb). Journal of Sol-Gel Science and Technology. 2007;42(1):79-88.
22. Kato K, Tamura S. Die Kristallstruktur von T-Nb2O5. Acta Crystallographica Section B. 1975;B31:673-677.
23. Ikeya T, Senna M. Change in the structure of niobium pentoxide due to mechanical and thermal treatments. Journal of Non-Crystalline Solids. 1988;105(3):243-250.
24. Liu J, Xue D, Li K. Single-crystalline nanoporous Nb2O5
nanotubes. Nanoscale Research Letters. 2011;6:138.
25. Cavalcante LS, Marques VS, Sczancoski JC, Escote MT, Joya MR, Varela JA, et al. Synthesis, structural reinement and optical behavior of CaTiO3 powders: A comparative study of
processing in diferent furnaces. Chemical Engineering Journal.
2008;143(1-3):299-307.
26. Jehng JM, Wachs IE. Structural chemistry and Raman spectra of niobium oxides. Chemistry of Materials. 1991;3(1):100-107.
27. Bormanis K, Palatnikov M, Shcherbina O, Frolov A, Chufyrev P, Sidorov N. Physical Properties and Structure of Niobium Pentoxide Ceramics Treated by Concentrated Light Flow.
Integrated Ferroelectrics. 2011;123(1):137-143.
28. Brayner R, Bozon-Verduraz F. Niobium pentoxide prepared by soft chemical routes: morphology, structure, defects and quantum size efect. Physical Chemistry Chemical Physics.
2003;5:1457-1466.
29. Mickova I. Photoelectrochemical Study of Anodically Formed Oxide Films on Niobium Surfaces. Croatica Chemica Acta.