The Efect of Co and Zn Addition on Densiication and Electrical Properties of Ceria-Based
Nanopowders
Lúcia Adriana Villas-Boasa*, Pedro Augusto de Paula Nascentea, Richard Landersb, Marcelo Camposc,
Dulcina Maria Pinatti Ferreira de Souzaa
Received: October 21, 2015; Revised: May 26, 2016; Accepted: July 25, 2016
In this work, cobalt and zinc-doped Ce0.8Gd0.2O1.9 samples were prepared starting from a commercial nanopowder and compared to the undoped material. The powder samples were pressed and afterwards
sintered by a two-step procedure, before characterization by X-Ray Difraction (XRD), X-ray photoelectron spectroscopy (XPS), Scanning Electron Microscopy (SEM), Transmission Electron Microscopy (TEM) and Impedance Spectroscopy (IS) in air. Cobalt or zinc additions are efective as sintering aid, allowing peak sintering temperatures around 1000°C to reach densiications above
of 93% of theoretical density, showing no evidence for the presence of secondary phases. The total
conductivity at 800 °C of pressed Zn-doped samples (6.7x10⁻² S/cm) and Co-doped samples (7.5x10⁻²
S/cm) is similar for undoped samples (7.2x10⁻² S/cm) showing that Zn and Co has a positive efect on
densiication without compromising the electrical conductivity.
Keywords: gadolinium-doped ceria, cobalt addition, zinc addition, XPS, SOFC
* e-mail: [email protected]
1. Introduction
Solid oxide fuel cell (SOFC) has attracted considerable
interest in the last few decades as a promising clean and
eicient energy conversion device1-3. Classical designs
employ yttria-stabilized zirconia (YSZ) as electrolyte, but it exhibits adequate ionic conductivity only at high temperatures (900-1000 °C). Such high temperatures limit the viability of fuel cells due to long-term stability and require expensive materials for sealing, insulation, and interconnects. Eforts to ind new electrolyte materials with high electrical conductivity at lower SOFC operation temperatures have identiied ceria based electrolytes as a substitute for YSZ2,3,
and gadolinium-doped ceria (GDC) has shown to be amongst
the most promising electrolytes4.
Ceria based electrolytes have been investigated over the past 20 years due to their high conductivity which makes them good candidates to be used at intermediate temperature
(500-700 °C)3,5. A major diiculty in using ceria as electrolyte
is related to the reduction of Ce+4 to Ce+3, which is signiicant
at low oxygen partial pressure (p(O2) < 10
-15atm) and high
temperature (T > 800°C)6. Another drawback regarding ceria
solid solutions is their poor sinterability, which requires high temperatures (1400-1600°C) to achieve high densiication (> 95%)5.
Adequate methods have been developed to prepare dense
ceria-based electrolytes at lower temperature, allowing for
the electrolyte-electrode co-sintering, which simpliies the
fabrication process and reduces the cost. Three methods are the
most used to achieve high densiications at low temperatures.
One is based on decreasing the particle size of the powder to the nanoscale, hence increasing the driving force, i.e.
speciic surface area, for densiication, thus the sintering
temperatures are drastically reduced7. Conventional powders sinter at 0.5-0.8 Tm (melting temperature), while nanopowders conveniently deagglomerated might sinter at temperatures as low as 0.2-0.3 Tm for similar high density8. A second method
consists on the use of sintering aids to promote densiication through liquid phase sintering or assisted ionic low along
the grain boundaries9. Small amounts of sintering aids, e.g.
CoO, MnO, Fe2O3, and CuO are very efective with respect to
densiication, but some of them exhibit a detrimental inluence
on grain boundary conductivity9-12. Recent work has showed
the efectiveness of ZnO as sintering aid for yttrium-doped ceria (YDC), samarium-doped ceria (SDC), and GDC13.
A third method involves the optimization of the sintering
temperature proile, using the so-called two-step sintering route, with a peak temperature to activate the densiication difusion process, followed by a lower temperature dwell to proceed with densiication with minimum grain growth14.
While the role of Co additions has been widely studied in
recent years, the efect of Zn as sintering aid is less known. Furthermore, there is no systematic comparison between
additives following a similar processing route, and starting from identical powders. In this work, the concomitant use a Department of Materials Engineering, Federal University of São Carlos – UFSCAR, São Carlos, SP, Brazil
b Department of Applied Physics, Campinas, Institute of Physics, State University of Campinas – UNICAMP, Campinas, SP, Brazil
of nanopowders and cobalt and zinc as sintering aids has been investigated together with the two-step sintering route. The sinterability, microstructure, and electrical conductivity of Co- and Zn-doped Ce0.8Gd0.2O1.9 samples were evaluated against the performance of undoped powders.
2. Experimental
Ce0.8Gd0.2O1.9 (CGd), 2 mol% CoO-doped Ce0.8Gd0.2O1.9
(CGd-Co), and 0.2, 0.4 and 1 mol% ZnO-doped Ce0.8Gd0.2O1.9
(CGd-0.2Zn, CGd-0.4Zn and CGd-1Zn, respectively),
were studied in this work. The starting materials were CGd
(Fuel Cell Materials) with 32.6 m2/g speciic surface area,
Co(NO3)2.6H2O (Synth, 98% purity), and Zn(NO3)2.6H2O
(Synth, 99.98% purity). Appropriate amounts of these powders were mixed in isopropanol containing 1 wt% of poly-vinylbutyral (B-98, Solutia), in a vibratory mill with zirconia milling media. Before uniaxial pressing at 40 MPa,
the suspensions were dried in air and granulated through a nylon sieve. The resulting pellets were isostatically pressed at
200 MPa and afterwards sintered following a two-step proile.
Information on early stages of sintering was obtained by
dilatometry (Linseis L75, vertical) under a constant heating
rate of 5 °C/min. The peak sintering temperatures were thus adjusted to 1200 and 1000 °C, while the dwell temperatures were 1000 and 900 °C for 5 and 10 h, respectively, at ixed
heating/cooling rates of 5 ºC/min. A short designation of the
sintering conditions hereby adopted includes sequentially
the peak and dwell temperatures, the latter followed by the
dwell time (e.g., 1200-1000°C /10h).
The structure of the sintered samples was characterized
by a Siemens D5000 X-ray diffractometer using Cu Kα source. Samples densities were measured using the
Archimedes method. The microstructure of the polished and thermally etched surfaces was analyzed by scanning electron
microscopy (SEM, Philips XL 30 FEG). The average grain
size was measured by the mean lineal intercept method.
Sintered samples were also analyzed by transmission electron microscopy (TEM, Hitachi H-9000).
X-ray photoelectron spectroscopy (XPS) results were obtained by a VSW HA-100 spherical analyzer using non-monochromated Al Kα radiation (hν = 1486.6 eV). The high
resolution spectra were acquired using constant analyzer pass
energy of 44 eV. The pressure inside the analysis chamber
was kept bellow than 2x10⁻⁸ mbar. The powdered samples
were pressed into pellets and ixed to a stainless steel sample
holder with double-faced conducting tape and analyzed
without further preparation. Curve itting was performed using Gaussian line shapes, and a Shirley background was
subtracted from the data.
The electrical conductivity of the specimens was measured in air over the temperature range 200-800 °C using
(two-probe) impedance spectroscopy (HP 4192 A) over the frequency range 5 Hz to 13 MHz, with a test signal amplitude
of 500 mV. Platinum paste electrodes were applied on both
sides of the pellets.
3. Results and Discussion
3.1 Sintering Characterization
In order to analyze the efects of cobalt and zinc additions
on the ceria-based solid solutions sintering process, a
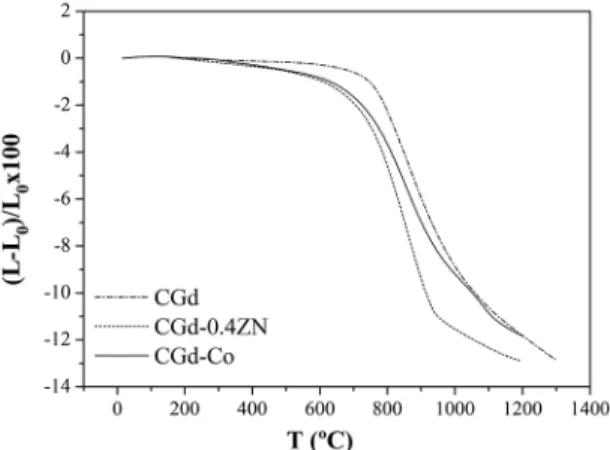
dilatometric analysis was performed (Figure 1). Pure CGd stars to shrink at approximately 800 ºC, while CGd-0.4Zn and CGd-Co show early signs of densiication already at 400 ºC. Once densiication starts it proceeds at a much higher
rate in the Zn and Co doped samples than in pure CGd.
Figure 1: Shrinkage proiles obtained for undoped, zinc, and
cobalt-doped samples.
The densiication curve (Figure 2) was calculated from the dilatometry data using equation 115:
%
th100
L
L
( )
1
t f
t f
3
t
=
T Y
t
t
where %ρth is the percentage of theoretical density, Lf is
the inal sample length, Lt is the time length dependent and
is equal to L0-ΔL0 (L0 is the initial sample length and ΔL0 is the sample displacement during time, t), ρt is the theoretical
sample density and ρf is the inal sample density.
For Zn and Co-doped samples a considerable improvement of the sintering kinetics is observed (Figure 2). It can also be seen that the densiication is completed within
a narrow temperature interval for CGd-Co, indicating a
faster densiication and the temperature to achieve 90% of densiication is ~ 900 °C. However, for CGd and CGd-0.4Zn samples, the temperature to attain the same densiication is
1300 and 1220 °C, respectively.
and Gd (20.8 at.%). It was not possible to detect the presence
of Zn due to the low amount used, probably below the detection limit.
3.3 XPS Analysis
The chemical states of the constituent ions were analyzed
by XPS. The Ce 3d spectrum is characterized by a complex line shape that relects the inal state occupation of the Ce
4f level. CeO2 presents three pairs of spin-orbit doubles, while Ce2O3 presents only two pairs16,17. The spin-orbit doublets are commonly denoted v and u and represent the 3d5/2 and 3d3/2 states, respectively. The v and v” peaks are
attributed to a mixture of 3d 94 f 2(O 2p4) and 3d94 f 1(O 2p5)
Ce4+ inal states, and v’’’ peak, to 3d 94f 0 (O 2p6) Ce 4+ inal
state17. The series of u structures from the 3d3/2 level can be
explained in the same way. The v0 and v’ peaks correspond to the 3d94 f 2(O 25) and 3d 94 f 1(O 2p6) Ce3+ inal states,
respectively18. The peak at approximately 916.5 eV is used
to identify the existence of Ce4+, since it is assigned to 4f0
transitions, which do not occur for Ce3+ 16,17.
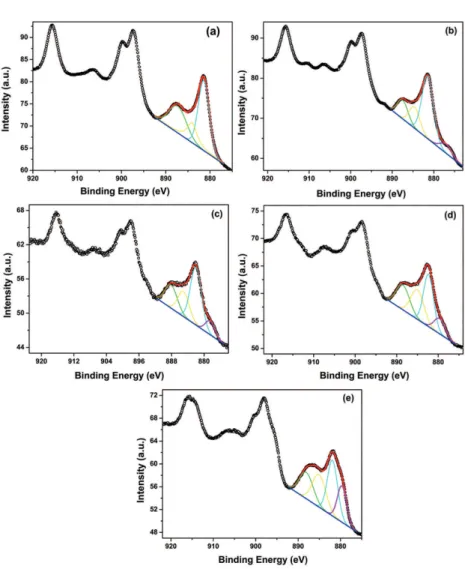
Figure 6 displays the Ce 3d XP-spectra for the following samples: (a) CGd, (b) CGd-0.2Zn, (c) CGd-0.4Zn, (d) CGd-1Zn, and (e) CGd-Co. The addition of 0.2 mol %
Zn (Figure 6(b)) caused a small change in the spectrum,
noticeable by the appearance of a small contribution at lower binding energy, related to the v0 peak. The additions of higher amounts of Zn provoked an enhancement of this
v0 peak (Figures 6(c) and 6(d)). The addition of Co caused
even a more noticeable change (Figure 6(e)). These changes
in the Ce 3d spectra are attributed to a partial reduction of Ce4+ to Ce3+. It seems that the v0 peak intensity increases with the increase in the amount of Zn. It should be mentioned that a substantial degree of reduction of Ce4+ to Ce3+ during
XPS measurements can occur when the measurement time is extended to several hours19.
From XPS analyzes, it was possible to identify the
chemical changes in cerium ion valence state that occur in CGd samples. The major problem in using doped ceria as electrolyte is the relatively easy reduction of Ce+4 to Ce+3 at
low oxygen partial pressure and high temperature (typical SOFC anode conditions), which creates an undesirable electronic conduction and leads to a chemical expansion of
the lattice parameters. The electronic conduction decreases
the fuel conversion eiciency due to partial internal short circuit and the chemical expansion inluences the mechanical
Figure 2: Percentage of theoretical density (%ρth) as function of
temperature for CGd, CGd-0.4Zn and CGd-Co.
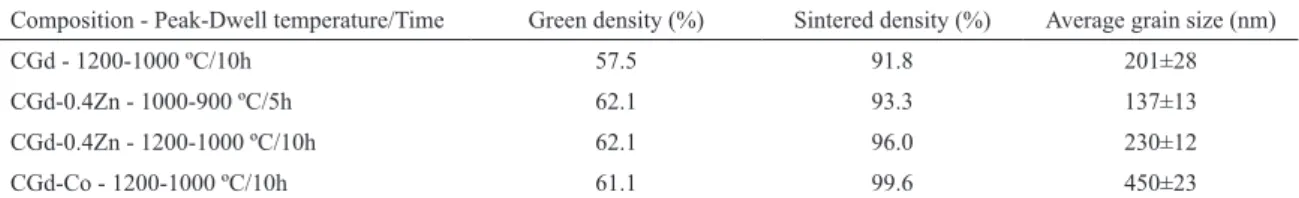
sintered samples in Table 1. Co or Zn additions favored the
densiication, with peak sintering temperatures as low as 1000 °C achieving densiications higher than 93%. These
results agree with previously reported ones9,11-13.
3.2 Structural and Microstructural
Characterization
Figure 3 presents the XRD difractograms of the sintered samples. The difraction peaks are indexed to the expected cubic luorite structure, with no evidence for the presence
of secondary phases. The additions of Co and Zn caused minimal changes in the lattice parameter, with a slight increase for the Zn-doped samples. Other authors did not detected either a secondary phase for the additions of 2 at.% of cobalt12 and 1 at.%Zn13 to CGd. If secondary phases are
formed, they are below the XRD detection limit.
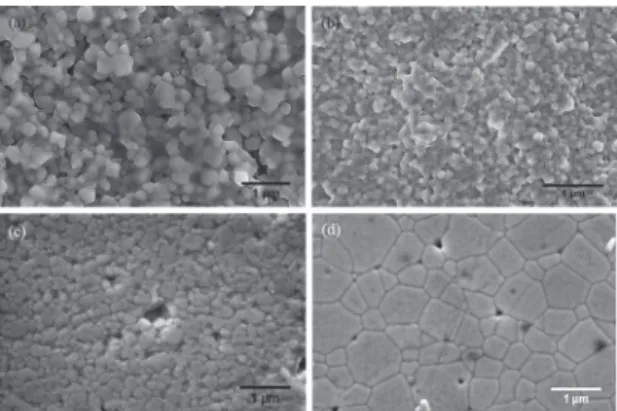
Figure 4 displays SEM micrographs of the sintered samples. (a) CGd-1200-1000 °C/10h fracture sintered sample, (b) CGd-0.4Zn-1000-900 °C/5h fracture sintered sample, (c) and (d) polished and thermally etched surfaces
of CGd-0.4Zn and CGd-Co samples, respectively, sintered
at 1200-1000 °C/10h. It can be observed the beneicial efect
of the sintering aids. The Co addition caused the grains grow
more steeply than the Zn additions (Table 1).
Figure 5 displays dark ield TEM micrographs of (a) CGd and (b) CGd-1Zn samples sintered at 1200-1000 °C/10h.
The micrographs show a homogeneous microstructure for the undoped and Zn-doped samples. An energy dispersive
spectroscopy (EDS) analysis detected only Ce (79.2 at.%)
Table 1: Green, inal relative density and average grain size of samples sintered by a two-step method.
Composition - Peak-Dwell temperature/Time Green density (%) Sintered density (%) Average grain size (nm)
CGd - 1200-1000 ºC/10h 57.5 91.8 201±28
CGd-0.4Zn - 1000-900 ºC/5h 62.1 93.3 137±13
CGd-0.4Zn - 1200-1000 ºC/10h 62.1 96.0 230±12
Figure 3: XRD difractograms of the sintered samples.
Figure 4: SEM micrographs of the sintered samples: (a)
CGd-1200-1000 °C/10h fracture sintered sample, (b) CGd-0.4Zn-CGd-1200-1000-900 °C/5h fracture sintered sample, (c) and (d) polished and thermally
etched surfaces of CGd-0.4Zn and CGd-Co samples, respectively,
sintered at 1200-1000 °C/10h.
Figure 5: Dark ield TEM micrographs of (a) CGd and (b)
CGd-1Zn samples sintered at 1200-1000 °C/10h.
integrity of cells6. The addition of either Zn or Co caused a
small change in the Ce 3d spectra, indicating only a partial reduction of cerium, however, the impact of these additions on the n-type conductivity of CGd is minimal.
The Gd 4d spectra (not shown here) appear as a broad
structure containing two main contributions, Gd 4d5/2 and Gd 4d3/220, and are very similar to the one obtained by
Cheng et al.21 for a Gd
2O3 ilm deposited on silicon. For all
analyzed samples, the binding energy of the Gd 4d5/2 peak
is around 140.7 eV, which is very close to the value (140.9 eV) reported by Kossoy et al.22 for Ce
0.8Gd0.2O1.9 thin ilms.
3.4 Electrical Conductivity
Figure 7 shows the impedance spectra, measured at 250 °C, of the samples sintered at 1200-1000 °C/10h, corrected for their thickness and electrode area. Impedance spectra of samples containing sintering aids showed the usual characteristics commonly reported for polycrystalline solid
electrolytes, with one high frequency arc (ascribed to the bulk contribution), one intermediate frequency arc (related to the grain boundary contribution), besides the lower frequency
electrode response often resembling a tail. However, with
increasing temperature, the relaxation frequency of the high frequency arc exceeds the upper limit of the equipment, and this arc disappears gradually. The intermediate frequency
semicircle displays the same tendency so that at temperatures higher than 500 °C, the impedance spectra showed only the electrode response.
The impedance spectra of samples free of sintering aid sometimes show a higher degree of overlapping of the
semi-circles for grain and grain boundary (e.g., see Figure 7) than
in the spectra of the doped samples. Instead of well resolved contributions, the result is a depressed impedance arc which
can be deconvoluted into speciic contributions with the typical relaxation frequencies of grain and grain boundary.
The impedance spectra were itted by means of the ZView program. Diferent elementary equivalent circuits arranged in series, each consisting of one resistance (R) and one constant phase element (CPE) in parallel, were adopted as base model. The CPE elements are often used instead of
simple capacitors when the impedance data deviates from perfect semicircles, appearing instead as depressed arcs23. Each
speciic contribution (grain, grain boundary, and electrode) was ascribed to one of these elementary circuits, except in
the higher temperature range where the arcs related to ionic
transport were not well deined. In such cases only the cell total resistance (bulk+grain boundary) was considered.
The data shown in Figure 7 suggest that the sintering aids inluenced slightly the low temperature performance, but there was no clear trend. Anyhow, even small diferences at low temperature quickly vanished with increasing temperature, as it is shown in the following discussion. The bulk (σb)
and total (σt) electrical conductivities were calculated from
the corresponding (bulk and total=bulk+grain boundary) R
values taking into account the sample geometry. The grain boundary conductivity was calculated assuming estimates for the grain boundary thickness and grain size, to calculate the microscopic grain boundary conductivity (vgbmicro). The
gb micro
v can be calculated as usual24.
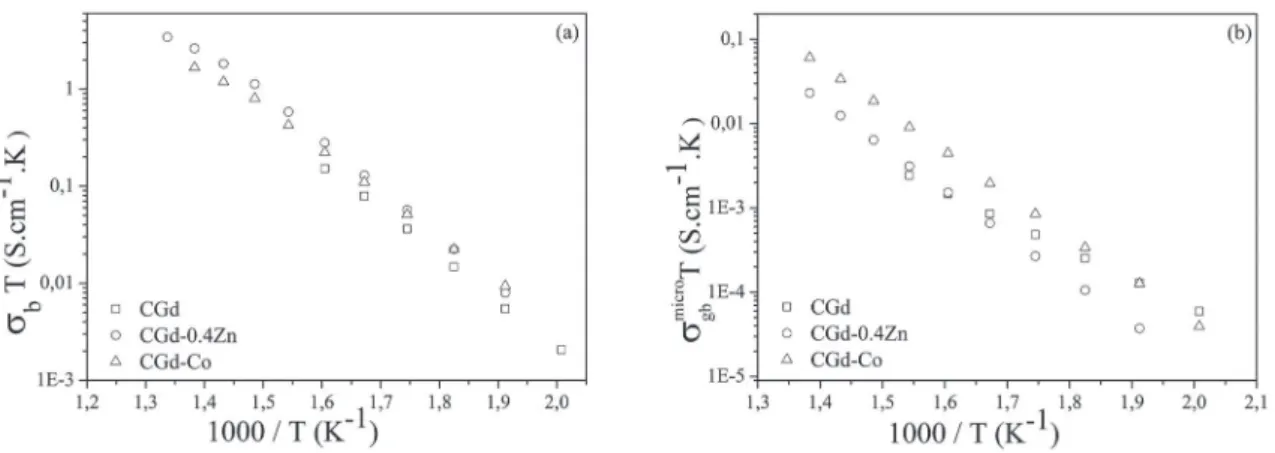
Figure 8 depicts Arrhenius plots of the bulk and microscopic
grain boundary electrical conductivities measured in air for specimens sintered 1200-1000 °C/10h. Both bulk and grain boundary conductivities of Zn and Co-doped samples were a
little higher than undoped samples, which may be explained
Figure 6: Ce 3d XPS-spectra for the following samples: (a) CGd, (b) CGd-0.2Zn, (c) CGd-0.4Zn, (d) CGd-1Zn, and (e) CGd-Co.
Figure 7: Impedance spectra, measured at 250 °C, of the samples
sintered at 1200-1000 °C/10h.
rather than Gd. This behavior afects both bulk and grain
boundary electrical properties. In the bulk, the conductivity
is higher probably due to the augment of oxygen vacancies
with the formation of solid solution among Gd2O3 and CeO2. The grain boundary is less resistive with sintering
aids due to space charge efects, since dopant segregation at
grain boundaries might damage the ionic conductivity. The
behavior observed here can be attributed to the inluence of sintering aid on the grain boundary thickness (δgb), as it
has been exhaustively discussed for doped-ceria and
yttria-stabilized zirconia23. The δ
gb values for Co and Zn-doped and
nondoped samples analyzed at 300 °C in air were calculated
using equation 2 and are shown in Table 2:
~
( )
C
C
C
C
d
d
2
g gb
gb g
g gb
g g
gb
d
=
f
f
Where εgb and εg are the grain boundary and grain
permittivity that were considered equal, Cg and Cgb are,
respectively, the capacitances for grain and grain boundary,
and is the average grain size. The terms εgb and εg can be
approximately equal since the dielectric constant of CeO2
is insensitive to the concentration23.
The δgb is lower for Co addition than Zn addition,
Figure 8: Arrhenius plots of (a) bulk and (b) microscopy grain boundary electrical conductivities measured in air of the samples sintered at 1200-1000 °C/10h.
Table 2: Activation energies for the bulk (Eab) and microscopic grain boundary (Eagb) conductivities, grain boundary thickness (δgb) at
300 °C, measured in air, of samples sintered at 1200-1000 °C/10h.
Composition Eab (eV) E
agb (eV) δgb at 300 °C (nm)
T < 400 °C T > 400 °C
CGd 0.93 0.70 2.79
CGd-0.4Zn 1.00 0.58 1.05 2.17
CGd-Co 0.91 0.67 1.01 1.73
segregate more at the grain boundary than Gd, and this may be correlated to a preferential segregation of the sintering aids rather than the addition of rare earth, and the enhancement of the conductivity may due to change in the space charge layer structure. It is noteworthy that the relative low Co-O bond dissociation and low solubility of cobalt in ceria corroborate with the higher segregation of Co at the grain boundary12.
Figure 9 presents the Arrhenius plots of total electrical conductivity (σt) measured in air of the samples sintered
at 1200-1000 °C/10h. The diferences are relatively small,
suggesting that the additions of Co and Zn have little inluence
on the electrical properties of ceria-based solid solutions.
At temperatures higher than 500 °C (1000/T≈ 1.3 K-1), all
lines almost overlap.
Figure 9: Arrhenius plots of total electrical conductivity measured
in air of the samples sintered at 1200-1000 °C/10h.
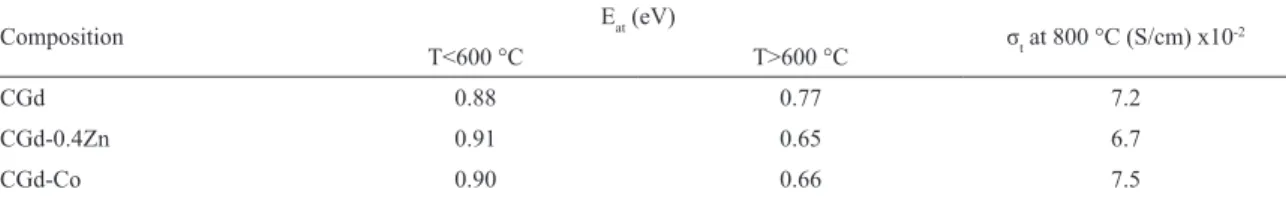
The sets of total conductivity data at 800 °C and activation energies are listed in Table 3. The overall conductivity results, including low temperature activation energies in the range 0.8 to 1.0 eV, match the corresponding values for Zn- and Co-free samples. This result suggests that Zn additions have a positive role on the sintering without the formation of ion-blocking grain boundaries, thus resembling Co-doped CGd rather than other
ceria-based ceramic materials doped with diferent sintering aids such as Mn and Fe9. The results observed in this work agree
well with results reported by Pérez-Coll et al.12 and Ge et al.13.
4. Conclusions
Two-step sintering combined with zinc additions, starting from a nanopowder, successfully produced high density Ce0.8Gd0.2O1.9 samples (>93%) at low peak/dwell
temperature (Tpeak = 1000 °C and Tdwell = 900 °C /5h) without
the presence of secondary phases. However, Co additions
increased the grain size, while zinc had only a marginal efect
on grain growth. Zn and Co additions have a considerable
efect on sintering kinetics by improving the densiication
in comparison with pure CGd samples.
In particular, the chemical states of the constituents
were analyzed by XPS and the addition of either Zn or Co
caused a change in the Ce 3d spectra, indicating a partial reduction of Ce4+. The total conductivity of ceria electrolytes
Table 3: Total conductivity (σt) at 800 °C and activation energies for total conductivity (Eat) in air of sample sintered at 1200-1000 °C /10h.
Composition Eat (eV) σt at 800 °C (S/cm) x10
-2
T<600 °C T>600 °C
CGd 0.88 0.77 7.2
CGd-0.4Zn 0.91 0.65 6.7
CGd-Co 0.90 0.66 7.5
5. Acknowledgements
Financial supports from CAPES and CNPq are greatly appreciated. We would like to thank Rita C. G. Vinhas (State University of Campinas, Campinas Campus, Brazil), for helping with the XPS measurements.
6. References
1. Ormerod RM. Solid oxide fuel cells. Chemical Society Reviews.
2003;32(1):17-28.
2. Zhu B. Solid oxide fuel cell (SOFC) technical challenges and
solutions from nano-aspects. International Journal of Energy Research. 2009;33(13):1126-1137.
3. Jacobson AJ. Materials for Solid Oxide Fuel Cells. Chemistry of Materials. 2010;22(3):660-674.
4. Steele BCH. Appraisal of Ce1−yGdyO2−y/2 electrolytes for
IT-SOFC operation at 500°C. Solid State Ionics.
2000;129(1-4):95-110.
5. Prasad DH, Lee JH, Lee HW, Kim BK, Park JS. Correlation
between the powder properties and sintering behaviors of nano-crystalline gadolinium-doped ceria. Journal of Ceramic Processing Research. 2010;11(5):523-526.
6. Figueiredo FML, Marques FMB. Electrolytes for solid oxide fuel
cells. Wiley Interdisciplinary Reviews: Energy and Environment.
2013;2(1):52-72.
7. Singh V, Babu S, Karakoti AS, Agarwal A, Seal S. Efect of
submicron grains on ionic conductivity of nanocrystalline doped ceria. Journal of Nanoscience and Nanotechnology.
2010;10(10):6495-6503.
8. Groza JR. Nanosintering. Nanostructured Materials.
1999;12(5-8):987-992.
9. Zhang X, Decès-Petit C, Yick S, Robertson M, Kesler O, Maric R, et al. A study on sintering aids for Sm0.2Ce0.8O1.9 electrolyte. Journal of Power Sources. 2006;162(1):480-485.
10. Zhang TS, Ma J, Leng YJ, Chan SH, Hing P, Kilner JA. Efect of transition metal oxides on densiication and electrical properties of Si-containing Ce0.8Gd0.2O2−δ ceramics. Solid State Ionics.
2004;168(1-2):187-195.
11. Gao L, Zhou M, Zheng Y, Gu H, Chen H, Guo L. Efect of zinc oxide on yttria doped ceria. Journal of Power Sources.
2010;195(10):3130-3134.
12. Pérez-Coll D, Marrero-López D, Núñez P, Piñol S, Frade JR.
Grain boundary conductivity of Ce0.8Ln0.2O2−δ ceramics (Ln =
Y, La, Gd, Sm) with and without Co-doping. Electrochimica Acta. 2006;51(28):6463-6469.
13. Ge L, Li S, Zheng Y, Zhou M, Chen H, Guo L. Efect of zinc oxide doping on the grain boundary conductivity of
Ce0.8Ln0.2O1.9 ceramics (Ln = Y, Sm, Gd). Journal of Power Sources. 2011;196(15):6131-6137.
14. Lapa CM, de Souza DPF, Figueiredo FML, Marques FMB.
Two-step sintering ceria-based electrolytes. International Journal of Hydrogen Energy. 2010;35(7):2737-2741.
15. Wang J, Raj R. Estimate of the Activation Energies for Boundary Difusion from Rate-Controlled Sintering of Pure Alumina,
and Alumina Doped with Zirconia or Titania. Journal of the American Ceramic Society. 1990;73(5):1172-1175.
16. Mullins DR, Overbury SH, Huntley DR. Electron spectroscopy of single crystal and polycrystalline cerium oxide surfaces.
Surface Science. 1998;409(2):307-319.
17. Larsson PO, Andersson A. Complete Oxidation of CO, Ethanol, and Ethyl Acetate over Copper Oxide Supported on Titania and Ceria Modiied Titania. Journal of Catalysis. 1998;179(1):72-89.
18. Le Normand F, El Fallah J, Hilaire L, Légaré P, Kotani A, Parlebas JC. Photoemission on 3d core levels of Cerium: An experimental and theoretical investigation of the reduction of cerium dioxide.
Solid State Communications. 1989;71(11):885-889.
19. Paparazzo E, Ingo GM, Zacchetti N. X-ray induced reduction efects
at CeO2 surfaces: An x-ray photoelectron spectroscopy study. Journal of Vacuum Science & Technology A. 1991;9(3):1416-1420.
20. Raiser D. Deville JP. Study of XPS photoemission of some
gadolinium compounds. Journal of Electron Spectroscopy and Related Phenomena. 1991;57(1):91-97.
21. Cheng X, Xu D, Song Z, He D, Yu Y, Zhao Q, Shen D. Characterization of gadolinium oxide ilm by pulse laser
deposition. Applied Surface Science. 2009;256(3):921-923.
22. Kossoy A, Cohen H, Bendikov T, Wachtel E, Lubomirsky I.
Water adsorption at the surface of pure and Gd-doped ceria. Solid State Ionics. 2011;194(1):1-4.
23. Guo X, Waser R. Electrical properties of the grain boundaries of oxygen ion conductors: Acceptor-doped zirconia and ceria.
Progress in Materials Science. 2006;51(2):151-210.
24. Tian C, Chan SW. Ionic conductivities, sintering temperatures