Body mass index, body weight perception and
common mental disorders among university
employees in Rio de Janeiro
Índice de massa corporal, percepção do peso
corpo-ral e transtornos mentais comuns entre funcionários
de uma universidade no Rio de Janeiro
Alessandra Bento Veggi,
aClaudia S Lopes,
aEduardo Faerstein
aand Rosely Sichieri
aAbstract
Abstract
Abstract
Abstract
Abstract
Objective: Objective: Objective: Objective:Objective: We tested the hypothesis that inadequate self-perception of body weight with or without obesity would be associated with common mental disorders (CMD).
Method: Method: Method: Method:
Method: We analyzed cross-sectional data from 4,030 university employees participating in the longitudinal Pró-Saúde Study Phase 1 (1999) in Rio de Janeiro. Participants (22-59 years of age) were invited to fill out a questionnaire that includes an evaluation of common mental disorders by General Health Questionnaire (GHQ-12). Body mass index (BMI=kg/m2) was calculated based on measured weight and height, and participants self-classified their own current body weight as highly above ideal, slightly above ideal, ideal, slightly below ideal or highly below ideal.
Results: Results: Results: Results:
Results: Among woman 58.3% of those with body mass index lower than 25.0 kg/m2 considered themselves as being above ideal weight; for men, this proportion was 23.5%. Multivariate logistic regression adjusted for age, income, leisure-time physical activity, self-reported health problem and body mass index, showed that body weight perception highly above ideal had a strong association with common mental disordersamong women (OR=1.84, 95%CI= 1.22-2.76). For women but not men, body mass index showed a borderline association with common mental disorders (p-trend=0.05) that did not persist after adjustment for income and self-reported health problem.
Conclusion: Conclusion: Conclusion: Conclusion:
Conclusion: Inadequate body weight perception, independent of body mass index, was associated with common mental disorders in women, but not men. One possible explanation for this association may be the socio-cultural pressure placed on women to conform the thinness ideal.
K K K K
Keywords:eywords:eywords:eywords:eywords: Body mass index; Weight perception; Mental disorders; Obesity; Body image; Questionnaires.
Resumo
Resumo
Resumo
Resumo
Resumo
Objetivo: Objetivo: Objetivo: Objetivo:Objetivo: Foi testada a hipótese de que a autopercepção inadequada do peso corporal, com ou sem obesidade, estaria associada aos transtornos mentais comuns (TMC).
Método: Método: Método: Método:
Método: Foram analisados dados de um corte transversal de 4.030 funcionários de uma universidade no Rio de Janeiro, que participaram da Fase 1 (1999) de um estudo longitudinal (Estudo Pró-Saúde). Os participantes (de 22 a 59 anos) preencheram um questionário, que incluiu a avaliação da presença de transtornos mentais comuns através do General Health Questionnaire (GHQ-12). O índice de massa corporal (IMC=kg/m2) foi calculado com base em medidas de massa corporal e estatura, e os participantes classificaram seu peso corporal nas seguintes categorias: muito acima do ideal, um pouco acima do ideal, ideal, um pouco abaixo do ideal, muito abaixo do ideal.
Resultados: Resultados: Resultados: Resultados:
Resultados: Entre as mulheres, 58,3% daquelas com índice de massa corporal menor que 25,0 kg/m2 consideraram-se acima do peso ideal; entre os homens, esse percentual foi de 23,5%. Através da análise multivariada por regressão logística ajustada por idade, renda, atividade física recreativa, morbidade auto-referida e índice de massa corporal, observou-se uma forte associação entre a presença de transtornos mentais comuns e a percepção de peso muito acima do ideal entre as mulheres (OR=1,84, IC 95%=1,22-2,76). Entre as mulheres, o índice de massa corporal apresentou uma tendência de associação com a presença de transtornos mentais comuns (p da tendência=0,05) que não persistiu após o ajuste por renda e morbidade auto-referida. Conclusão:
Conclusão: Conclusão: Conclusão:
Conclusão: A percepção inadequada do peso corporal, independente do índice de massa corporal, esteve associada à presença dos transtornos mentais comuns nas mulheres, mas não nos homens. Uma possível explicação para essa associação está relaci-onada à maior pressão sociocultural disseminada entre as mulheres para se enquadrarem ao ideal de magreza vigente.
Descritores: Descritores: Descritores: Descritores:
Descritores: Índice de massa corporal; Percepção do peso; Transtornos mentais; Obesidade; Imagem corporal; Questionários.
aDepartment of Epidemiology, Institute of Social Medicine,
State University of Rio de Janeiro
Introduction Introduction Introduction Introduction Introduction
In the last decades, social pressures towards a slim body have been intensified, referring to overweight persons in a depreciative way.1-2 Once stigmatized, overweight individuals are common target for prejudice and discrimination in workplaces, social relationships, as well as by health professional, due to their physical appearance.3-4
Many socio-cultural factors including pressure from peers, relatives, parents, media, and other elements of the social environment may affect people weight norms. Self-perception of body weight is an important aspect of body image.5-6 It’s most likely reflecting satisfaction with, and concerns about, body weight and may be influenced by social norms and standards of the dominant culture.7
It has been well documented that the size of the “ideal” weight is far smaller than the size of average woman and compared against this stringent standard, the majority of women fell themselves above ideal weight.5-6 This phenomenon is more prevalent in industrialized and often Western cultures and is far more common among females than males, mirroring cross-cultural differences in the importance of thinness for women.8 It constitutes a significant source of distress for many women, and has been associated with adverse consequences including common mental disorders and unhealthy weight control behaviors.6-9
Although there are some findings that obesity may be associated to psychological disorders8-9 evidence of increased psychological distress in non-clinical populations of obese is less clear.10 Several cross-sectional and prospective studies, but not all11, have reported psychiatric morbidity in obese individuals.12-15 Onyike et al14 using data from The Third National Health and Nutrition Examination Survey found that the association between obesity and depression depends on severity of obesity. The association between excess body weight and psychiatric disorders association could be explained by dieting13 or other diseases.16 Roberts et al17-18 found associations between BMI (body mass index) and mental disorder among older adults.
However, the relationship between obesity and mental health is still controversial; these discordant results may be influenced by the possibility of bi-directional causal pathway of these events: psychiatric morbidity may lead to obesity19-22 or obesity may cau-se psychological suffering.14-15,23 In addition, studies have used a wide range of methods and criteria to define and measure psychiatric disorders, obesity and overweight.10-14
Under the hypothesis that obesity may cause psychological suffering due to social pressure towards a slim body, an inadequate self-perception of weight, with or without obesity, should be associated with psychiatric morbidity. Therefore, the goal of this study was evaluating the associations of BMI and inadequate body weight perception with common mental disorders in a free-living population using a standardized methodology for measuring weight and body weight perception.
Methodology Methodology Methodology Methodology Methodology
This study is part of the Pró-Saúde Study, an investigation aimed to evaluate social determinants of physical and mental morbidity among technical and administrative employees of a university in the state of Rio de Janeiro. Individuals signed an informed consent before filling a questionnaire, during their working hours. In this study, the analyses are based on cross sectional data collected in 1999 from 4,030 participants, After excluding people over age of 60 (102), pregnant women (5), paid-leaving breastfeeding (2), those who reported diseases that affect the BMI such as diabetes and hyperthyrodism (215) and those lacking information on weight or height (105), body weight perception (35) and common mental disorders (40) leaving 3,526 respondents for the current analyses.
Weight (kilograms) and height (meters) were measured by trained nutritionists according to standardized method using di-gital scales with 0,1 kg precision and 150 kg capacity, and a platform with an attached measuring bar with precision within 0,1cm. Body Mass Index (BMI=Kg/m2) was classified according to World Health Organization recommendations.24
Body weight perception was based on participant’s self-perception of their own current body weight classifying it in five categories such as highly above ideal, slightly above ideal, ideal, slightly below ideal or highly below ideal.
Common mental disorders (CMD) were assessed using the self-administered 12-item General Health Questionnaire (GHQ-12),25 a well-established screening questionnaire for the detection of non-psychotic psychiatric disorder in general population.26 The
GHQ was validated in its original version27 and its Brazilian version,28 having in both cases the Clinical Interview Schedule as the gold standard.29 Each of the 12 items of instrument asks whether the respondent has recently experienced a particularly symptom or behavior, rated on a 4-point scale as follows: ‘not at all’ (code 1); ‘no more than usual’ (code 2); ‘rather more than usual’ (code 3); and ‘much more than usual’ (code 4). Case here refers to the probability that an individual has a common mental disorder, given that the distribution of assessed symptoms is unlikely to show a sharp dichotomy of cases and non-cases. Criteria are based on threshold scores, which are likely to vary with types of samples and settings. It was scored using the original case classification method, which provides a simple dichotomy between probable “case” and “non-case”. Those scoring three or more (out of 12) on the GHQ were classified as cases of common mental disorders. The 12 items of GHQ cover feelings of strain, depression, inability to cope, anxiety and lack of confidence.
Socio-demographic variables (age, schooling, household per capita income, marital status), self-reported occurrence of disease in the previous two weeks, which impaired daily life activities, and leisure-time physical activity in the previous two weeks were evaluated as possible confounding variables in the associations between BMI and inadequate body weight perception with CMD. Household per capita income was calculated as the total family income divided by numbers of persons living on that budget and it was categorized into quartiles.
Statistical analysis Statistical analysisStatistical analysis Statistical analysisStatistical analysis
Means were compared using t-test or ANOVA and categorical variables by chi-square test. For the study of the association between BMI, inadequate body weight perception and presence of CMD, OR and 95% confidence intervals (95% CI) were calculated. Multivariate analysis used logistic regression and two sets of models were evaluated considering presence of common mental disorder as the dependent variable. The first set of models evaluated the association between BMI and common mental disorders with and without adjustment for age, income, leisure-time exercise, and self-reported health problems. Further models evaluated the association between inadequate body weight perception and CMD including BMI as a continuous variable. All data were analyzed using STATA 6.0.30
Results ResultsResults ResultsResults
Overall prevalence of CMD was 34.5% among women and 22.3 % among men. The highest prevalence of CMD was found among women in the lowest categories of schooling and income. For both men and women, self-reported health problem were also more frequent among those with CMD.
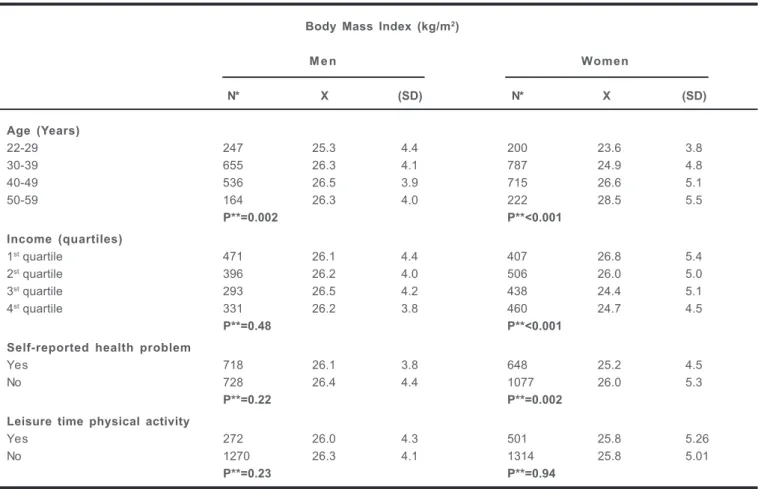
Mean BMI increased slightly with age for both sexes and decreased with higher schooling, higher income among women, but not men. BMI was lowest for never married men and women (Table 1).
The prevalence of overweight (BMI>25.0 kg/m2) among women was 53.3%, and among men, this prevalence was 64.9%. Although, the agreement between BMI classification and body weight perception was high (Kappa coefficient= 0,77 for men and 0,68 for women – Table 2), women had a tendency of classifying themselves as above ideal weight, whereas men had a perception of being below the ideal weight even at a normal BMI. Prevalences of body weight perceptions below ideal was 14.1% for men and 7.2% for women and prevalences of body weight perceptions above ideal were 56.7% and 70.9%, respectively.
T T T T
Table 1 – Body Mass Index Mean and Standard Deviation (SD) according to risk factors among employees of a Brazilian universityable 1 – Body Mass Index Mean and Standard Deviation (SD) according to risk factors among employees of a Brazilian universityable 1 – Body Mass Index Mean and Standard Deviation (SD) according to risk factors among employees of a Brazilian universityable 1 – Body Mass Index Mean and Standard Deviation (SD) according to risk factors among employees of a Brazilian universityable 1 – Body Mass Index Mean and Standard Deviation (SD) according to risk factors among employees of a Brazilian university, 1999, 1999, 1999, 1999, 1999
Body Mass Index (kg/m2)
M e n Women
N* X (SD) N* X (SD)
Age (Years)
22-29 247 25.3 4.4 200 23.6 3.8
30-39 655 26.3 4.1 787 24.9 4.8
40-49 536 26.5 3.9 715 26.6 5.1
50-59 164 26.3 4.0 222 28.5 5.5
P**=0.002 P**<0.001
Income (quartiles)
1st quartile 471 26.1 4.4 407 26.8 5.4
2st quartile 396 26.2 4.0 506 26.0 5.0
3st quartile 293 26.5 4.2 438 24.4 5.1
4st quartile 331 26.2 3.8 460 24.7 4.5
P**=0.48 P**<0.001
Self-reported health problem
Yes 718 26.1 3.8 648 25.2 4.5
No 728 26.4 4.4 1077 26.0 5.3
P**=0.22 P**=0.002
Leisure time physical activity
Yes 272 26.0 4.3 501 25.8 5.26
No 1270 26.3 4.1 1314 25.8 5.01
P**=0.23 P**=0.94
* Totals vary due to differential missing values **ANOVA or t-test
T T T T
Table 2 – Body Mass Index (BMI) classification according to sex and body weight perception among employees of a Brazilianable 2 – Body Mass Index (BMI) classification according to sex and body weight perception among employees of a Brazilianable 2 – Body Mass Index (BMI) classification according to sex and body weight perception among employees of a Brazilianable 2 – Body Mass Index (BMI) classification according to sex and body weight perception among employees of a Brazilianable 2 – Body Mass Index (BMI) classification according to sex and body weight perception among employees of a Brazilian university
university university university university, 1999, 1999, 1999, 1999, 1999
Body Mass Index (kg/m2)
Men Women
<18.5 18.5-24.99 >25.0 <18.5 18.5-24.99 >25.0
N % N % N % N % N % N %
Below ideal 20 83.4 173 32.3 23 2.3 24 75.0 89 10.2 26 2.6
Ideal 02 8.3 281 52.2 187 18.0 07 21.9 343 39.0 61 6.2
Above ideal 02 8.3 81 15.2 826 79.7 01 3.1 447 50.8 905 91.2
TOTAL 24 1.5 535 33.5 1036 64.9 32 1.7 879 46.2 992 52.1
X2 P<0.001 P<0.001
Kappa 0.77 0.68
Body Weight Perception
Among men, in both adjusted and unadjusted models, BMI was unrelated to CMD. Among women, in a model adjusted for age and leisure-time physical activity, prevalence of CMD increased with BMI categories of overweight. The OR for obesity was 1.35 (95% CI 1.00-1.83), but with further adjustment for income and self-reported health problems, the OR for obesity reduced to 1.26 (95% CI 0.93-1.72) – Table 3.
After adjustment for age, income, leisure-time physical activity and self- reported health problem, inadequate body weight
M e n
Body Mass CMD Model 1 Model 2 Model 3 Index
(kg/m2) N % OR 95% CI OR 95% CI OR 95% CI
cases
<18.5 24 13.0 0.35 0.08-1.53 0.32 0.07-1.41 0.29 0.06-1.33
18.5-24.99 540 24.1 1.00 – 1.00 – 1.00 –
25.0-29.99 741 43.2 0.86 0.64-1.17 0.87 0.65-1.18 0.89 0.66-1.21
>30.0 297 21.2 1.08 0.75-1.57 1.10 0.76-1.59 1.13 0.77-1.65
P* = 0.62 P* = 0.50 P*= 0.41
Women
Body Mass CMD Model 1 Model 2 Model 3 Index
(kg/m2) N % OR 95% CI OR 95% CI OR 95% CI
cases
<18.5 32 29.0 0.45 0.16-1.22 0.43 0.16-1.18 0.49 0.18-1.37
18.5-24.99 882 35.2 1.00 – 1.00 – 1.00 –
25.0-29.99 647 34.8 0.97 0.76-1.24 0.95 0.75-1.22 0.97 0.75-1.25
>30.0 363 40.4 1.35 1.00-1.83 1.28 0.95-1.74 1.26 0.93-1.72
p* = 0.05 p* = 0.09 p* = 0.11
Model 1 adjusted by age and leisure time physical activity Modelo 2 adjusted by age, leisure time physical activity, income
Modelo 3 adjusted by age, leisure time physical activity, income and self reported health problem.
* test for linear trend
T TT T
Table 3 – Adjusted Odds Rable 3 – Adjusted Odds Rable 3 – Adjusted Odds Rable 3 – Adjusted Odds Rable 3 – Adjusted Odds Ratio (OR) and 95% confidence interatio (OR) and 95% confidence interatio (OR) and 95% confidence interatio (OR) and 95% confidence interatio (OR) and 95% confidence intervals for commom mental disorders (CMD) according to Body Massvals for commom mental disorders (CMD) according to Body Massvals for commom mental disorders (CMD) according to Body Massvals for commom mental disorders (CMD) according to Body Massvals for commom mental disorders (CMD) according to Body Mass Index (BMI) and sex
Index (BMI) and sexIndex (BMI) and sex Index (BMI) and sex Index (BMI) and sex
M e n
Body Weight Perception CMD Model 1 Model 2
n % cases OR 95% CI OR 95% CI
Highlyabove ideal 254 23.3 1.28 0.85-1.93 1.26 0.72-2.21
Slightly above ideal 616 21.6 1.01 0.72-1.43 1.01 0.69-1.46
Ideal 436 19.5 1.00 – 1.00 –
Slightly below ideal 177 29.9 1.54 0.98-2.43 1.65 0.97-2.46
Highly below ideal 30 30.0 0.99 0.37-2.66 0.99 0.36-2.72
Women
Body Weight Perception CMD Model 1 Model 2
n % cases OR 95% CI OR 95% CI
Highlyabove ideal 496 39.9 1.77 1.27-2.45 1.84 1.22-2.76
Slightly above ideal 792 37.5 1.60 1.18-2.16 1.62 1.19-2.22
Ideal 386 27.7 1.00 – 1.00 –
Slightly below ideal 115 33.9 1.40 0.85-2.30 1.40 0.85-2.30
Highly below ideal 17 52.9 2.28 0.66-7.90 2.30 0.66-7.99
Modelo 1 ajustado por idade e atividade física recreativa
Modelo 2 ajustado por idade, renda, atividade física recreativa, problema de saúde auto-referido e IMC como uma variável contínua.
T TT T
Tabela 4 – Adjusted Odds Rabela 4 – Adjusted Odds Rabela 4 – Adjusted Odds Rabela 4 – Adjusted Odds Rabela 4 – Adjusted Odds Ratio (OR) and 95% confidence interatio (OR) and 95% confidence interatio (OR) and 95% confidence interatio (OR) and 95% confidence interatio (OR) and 95% confidence intervals for common mental disorder (CMD) according to body weightvals for common mental disorder (CMD) according to body weightvals for common mental disorder (CMD) according to body weightvals for common mental disorder (CMD) according to body weightvals for common mental disorder (CMD) according to body weight perception and sex
perception and sexperception and sex perception and sex perception and sex
Discussion Discussion Discussion Discussion Discussion
In this study population, being outside the range of what is considered to be the ideal weight was associated to CMD only among women, even after controlling for confounders including BMI. These findings are in agreement with those reported by Wadden et al1 who examined the psychological functioning and satisfaction with weight in 393 obese and non-obese adolescent girls, and found that subject’s perceived degree of overweight
This study was partially supported by Conselho Nacional de Desenvol-vimento Científico (CNPQ) and Fundação de Amparo à Pesquisa do Estado do Rio de Janeiro (Faperj).
Received in 03.24.2004 Accepted in 08.04.2004
have shown inconclusive results.10-23 As far as it was possible to identify, few studies were carried out in Brazil,6 a country with different cultural characteristics from those prevailing in the USA and Europe, where most studies were conducted.
Discrepancies between body mass index and “ideal” body weight can lead to negative emotional states, such as disappointment and dissatisfaction, placing individuals at risk for psychiatric disorders. 31-35 Subjects who perceived themselves as overweight or underweight may often feel isolated or discriminated against their peers.33-35
In the present study, the odds of common mental disorders was greater among those women who perceived themselves as overweight and underweight, independent of their weight according to BMI standards. We also observed that body weight dissatisfaction was as high as in other studies with about 50% of normal weight women feeling themselves above ideal weight. Nunes et al,6 in a population-based cross-sectional study among women aged between 12 and 29 years old in Porto Alegre, found that 46% of them had an ideal weight lower than their actual weight, and 37% considered themselves fat.
Although we found a good agreement between BMI and body weight perception, overweight and underweight women showed a more adequate body weight perception than normal weight women suggesting that incorporation of cultural beliefs regarding thinness as the equivalent of female beauty may result in a hypercritical view of one’s own body.35 Some women appear to be more sensitive to this social pressure and therefore may experience minor psychiatric morbidity as a result of having failed to meet the cultural ideal for attractiveness.34 On the other hand, CMD may accentuate this concern and increase body dissatisfaction.
Men’s body weight perception showed a slightly greater agreement with BMI, compared to women.5 Nevertheless, an important percentage of normal weight and overweight men underestimated their body weight. This trend of feeling below ideal weight found among men had been detected in some studies recently.36-37 The muscle dysmorphia is a clinical condition, which affects men who, despite having muscle hypertrophy, feel frail and small, being equivalent to the inadequate body weight perception in women who try to adjust themselves to the ideal corporal pattern.37
Higher prevalence of CMD in women compared with men had been observed in many studies, including a previous analysis of the Pro-Saúde Study.38 Environmental explanations, particularly gender differences in social roles seem the most plausible.39
The standard of thinness has been idealized in our culture stimulating many women to consider their ideal weight in the underweight range. This “thin ideal” so hard to be achieve may contribute to higher levels of common mental disorders in women.40 However, it must be acknowledged that several other factors – biological, psychological and socio-cultural should be considered to adequately explain CMD in women.17-18,41
Finally, although our results do not support the association of CMD and BMI, the results suggest a borderline association between IMC>30 kg/m2 and CMD, only among women. Roberts et al,41 in a longitudi-nal study in U.S., found an increased risk of depression associated with obesity and discussed the complexity of the relationship between obesity and mental health. The cross-sectional nature of the study design limits any conclusion about the temporality and direction underlying the observed associations. Further research is needed to identify factors associated with female’s inadequate perception of her weight and to distinguish the ways and extent in which inadequate body weight perception are conducive to CMD in some women.
References ReferencesReferences References References
1. Wadden TA, Stunkard AJ. Social and psychological consequences of obesity. Ann Intern Med. 1985;(6 Pt 2):1062-7.
2. Stunkard AJ, Sobal J. Psychosocial consequences of obesity. In: Brownell KD, Fairburn, CG. Eating disorders and obesity. New York: Guilford Press; 1995. 3. Appolinario, JC. Obesidade e psicopatologia. In: Halpern A, Matos AFG, Suplicy H, Mancini MC, Zanella MT. Obesidade. São Paulo: Lemos; 1998. p. 217-23.
4. Myers A, Rosen JC. Obesity stigmatization and coping: relation to mental health symptoms, body image and self-esteem. Int J Obes Relat Metab Disord. 1999;23(3):221-30.
5. Fallon AE, Rozin P. Sex differences in perceptions of desirable body shape. J Abnorm Psychol. 1985;94(1):102-5.
6. Nunes MA, Olinto MTA, Barros FB, Camey S. Influência da percepção do peso e do Índice de Massa Corporal nos comportamentos alimentares anormais. Rev Bras Psiquiatr. 2001;23(1):21-7.
7. Ogden J, Evans C. The problem with weighting: effects on mood, self-esteem and body image. Int J Obes Relat Metab Disord. 1999;20(3):272-7. 8. Rierdan J, Koff E. Weight, weight-related aspects of body image, and depression in early adolescent girls. Adolescence. 1997;32(127):615-24. 9. Buddeberg-Fisher B, Klaghofer R, Reed V. Associations between body weight, psychiatric disorders and body image in female adolescents. Psychoter Psychosom. 1999;68(6):325-32.
10. Friedman MA, Brownell KD. Psychological correlates of obesity: moving to the next research generation. Psychol Bull. 1995;117(1):3-20. 11. Palinkas LA, Wingard DL, Barret-Conor E. Depressive symptoms in overweight and obese older adults: a test of “jolly fat” hypothesis. J Psychosom Res. 1996;40(1):59-66.
12. Siegel JM, Yacey AK, McCarthy WJ. Overweight and depressive symptoms among African American Women. Prev Med. 2000;31(3):232-40.
13. Hayes D, Ross CE. Body and mind: the effect of exercise, overweight and physical health on psychological well-being. J Health Hum Behav. 1986;27(4):387-400.
14. Onyike CU, Crum RM, Lee HB, Lyketsos, CG, Eaton, WW. Is Obesity associated with major depression? Results from the Third National Health and Nutrition Examination Survey Am J Epidemiol. 2003;158(12):1139] 47. 15. Doll HA, Petersen SE, Stewart-Brow SL. Obesity and physical and emotional well-being: associations between body mass index, chronic illness and physical and mental components of the SF-36 questionnaire. Obes Res. 2000;8(2):160-70.
16. Ross CE. Overweight and depression. J Health Soc Behav. 1994;35(1):63-79.
17. Roberts RE, Kaplan GA, Shema SJ, Strawbridge WJ. Are the obese at greater risk for depression? Am J Epidemiol. 2000;152(2):163-70. 18. Roberts RE, Strawbridge WJ, Deleger S, Kaplan GA. Are the fat more jolly? Ann Behav Med. 2002;24(3):169-80.
19. Carter FA, Bulik CM, Joyce PR. Direction of weight change in depression. J Affect Disord. 1994;30(1):57-60.
20. Barefoot JC, Heitmann BL, Helms MJ, Williams RB, Surwit RS, Siegler IC. Symptoms of depression and changes in body weight from adolescence to mid-life. Int J Obes Relat Metab Disord. 1998;22(7):688-94. 21. DiPietro L, Anda RF, Williamson DF, Stunkard AJ. Depressive symptoms and weight change in a national cohort of adults. Int J O. 1992;16(10):745-53.
22. Pine DS, Cohen P, Brook J, Coplan JD. Psychiatric symptoms in adolescence as predictors of obesity in early adulthood: a longitudinal study. Am J Public Health. 1997;87(8):1303-10.
23. Istvan J, Zavela K, Weidner G. Body weight and psychological distress in NHANES I. Int J Obes Relat Metab Disord. 1992;16(12):1999-1003.Commented in: Int J Obes Relat Metab Disord. 1993;17(8):485-6. 24. World Health Organization. Obesity: preventing and managing the global epidemic. Genebra: WHO; 1997.
25. Goldberg D, Williams P. A user’s guide to the general Health Questionnaire. NFER- Windsor: Nelson Publishing; 1998.
26. Goldberg D. The detection of psychiatric illness by questionnaire. London: Oxford University Press; 1972.
27. Stansfeld SA, Marmot MG. Social class and minor psychiatric disorder in British Civil Servants: a validated screening survey using General Health Questionnaire. Psychol Med. 1992;22(3):739-49.
Operating Characteristic (ROC) analysis. Psychol Med. 1985;15(3):651-9. 29. Goldberg DP, Blackwell B. Psychiatric illness in general practice: A detailed study using a new method of case identification. Br Med J. 1970;1(707):439-43.
30. Stata Statistical Software, Release 6.0, College Station, TX: Stata Corporation; 1999.
31. Adami GF, Gandolfo P, Campostano A, Meneghelli A, Ravera G, Scorpinaro N. Body image and body weight in obese patients. Int J Eat Disord. 1997;24(3):299-306.
32. Hill AJ, Williams J. Psychological health in a non-clinical sample of obese women. Int J Obes Relat Metab Disord. 1998;22(6):578-83. 33. Klesges RC, Klem ML, Klesges LM. The relationship between changes in body weight and changes in psychosocial functioning. Appetite. 1992;19(2):145-53.
34. Mc Carthy M. The thin ideal, depression and eating disorders in women. Behav Res Ther. 1990;28(3):205-15.
35. Blowers LC, Loxton NJ, Grady-Flesser, M, Occhipinti S, Dawe S. The relationship between sociocultural pressure to be thin and body dissatisfaction in preadolescent girls. Eat Behav. 2003;4(3):229-44. 36. Drewnowski A, Yee DK. Men and body image: are males satisfied with their body weight? Psychosom Med. 1987;49(6):626-34.
37. Assunção SSM. Dismor fia muscular. Rev Bras Psiquiatr. 2002;24(3):80-4.
38. Lopes CS, Faerstein E, Chor D. Eventos de vida produtores de estresse e transtornos mentais comuns: resultados do Estudo Pró-Saúde. Cad Saude Publica. 2003;19(6):1713-20.
39. Jenkins R. Sex differences in minor psychiatric morbidity. Psychol Med.Monogr. 1985;Suppl 7:1-53.
40. Bebbington PE. Sex and depression. Psychol Med. 1998;28(1):1-8. 41. Roberts RE, Deleger S, Strawbridge WJ, Kaplan, G. Prospective association between obesity and depression: evidence from the Alameda County Study. Int J Obes Relat Metab Disord. 2003;27(4):514-21.
Correspondence Correspondence Correspondence Correspondence Correspondence