Health Promotion Perspectives, 2015, 5(1), 14-23
doi: 10.15171/hpp.2015.003 http://journals.tbzmed.ac.ir/HPP
Predictors of Bone Mineral Density in African-American and Caucasian
College-Aged Women
*Andrea K. Johnson 1, M. Allison Ford 2, Tamekia L. Jones 3, Vinayak K. Nahar 2, Jeffrey S. Hallam 4
1Department of Health and Human Performance, University of Tennessee at Martin, Martin, TN, 38238, USA 2Department of Health, Exercise Science & Recreation Management, University of Mississippi, University, MS, 38677, USA 3Department of Pediatrics and Department of Preventive Medicine, University of Tennessee Health Science Center, Memphis, USA
4 College of Public Health, Department of Social and Behavioral Sciences, Kent State University, Kent, USA
ARTICLE INFO ABSTRACT
Article type:
Original Article Background: Research regarding risk factors and prevalence of low bone min-eral density (BMD) among African-American and Caucasian college-aged wom-en are limited. The objective of this cross-sectional study was to determine if selected predictors of BMD in African-American and Caucasian college-aged women differ by race.
Methods: A total of 101 local African-American (n=50) and Caucasian (n=51) females, ages 18 to 30 years, were in this study. All data were collected in the Bone Density and Body Composition Laboratory. BMD was measured using DXA technology. Race, family history of osteoporosis, BMI, current physical activity, osteoporosis knowledge, length of time on oral contraceptives, age at menarche and calcium intake were included in the multiple regression analyses with spinal and femoral BMD as dependent variables.
Results: Overall, 38.6% had low spinal BMD and 7.9% had low femoral BMD. BMI (β=0.073, R2 = .148, P = .001, 95% CI [0.030, 0.116]) and current physical activity (β=0.071, R2 = .148, P = .017, 95% CI [0.013, 0.129]) were the only variables that were statistically significant in predicting spinal BMD. BMI (β=0.056, R2 = .13, P = .010, 95% CI [0.014, 0.098]) and current physical activ-ity (β=0.078, R2 = .13, P = .007, 95% CI [0.022, 0.134]) were also the only varia-bles that were statistically significant in predicting femoral BMD. Race was not a significant predictor of spinal or femoral BMD.
Conclusion: It is imperative for both African-American and Caucasian women to engage in osteoporosis-preventive behaviors.
Article history: Received: Nov 20 2014 Accepted:Feb 12 2015 e-published: Mar 29 2015
Keywords: BMD, BMI,
Physical activity, Women,
Race,
Osteoporosis Knowledge
*Corresponding Author: Andrea K. Johnson-Stevenson Tel: +1 731 881 7313 e-mail: [email protected]
Introduction
Researchers estimate that 10 million Americans have osteoporosis, while 44 million adults over the age of 50 year are at risk for this disease.1 By
the year 2020, osteoporosis will affect
approxi-mately 14 million adults over the age of 50 yr.2 Women account for 80% of those affected by os-teoporosis; and, men account for the remaining 20%.3 Because females are at a greater risk for
teoporosis than males, only females were included in this study. Because of the higher prevalence of osteoporosis in women, their risk of hip fractures is equal to their risk of breast, uterine and ovarian cancers combined.1
Osteoporosis is a skeletal disease that is charac-terized by low bone mass and degradation of bone tissue.4 The utilization of t-scores and z-scores to
express bone mineral density (BMD) is typical. The t-score is based on comparison of an individual’s bone density to the bone density of a 25 to 30-year-old of similar gender and race/ethnicity.5 The
World Health Organization (WHO) uses a thresh-old of 2.5 standard deviations below the mean BMD of young adult women and a threshold of 1 to 2.5 standard deviations below the mean BMD of young adult women as the criterion for a diagnosis of osteoporosis and osteopenia, respecti-vely.6
Af-rican-American women fracture at a lower rate when compared to Caucasians with the same BMD. However, when African-American fracture bone, they have higher mortality and morbidity rates.7
With an increasing aging population and increasing longevity of minority groups, osteoporosis is an increasing public health concern.8
Risk factors for osteoporosis include estrogen deficiency, age, being female, genetic factors, per-sonal history of fractures in the absence of trauma, thin/small frame, diet low in calcium, vitamin D deficiency and reaching menopause either natu-rally or surgically before the age of 45.9 Being
overweight, however, has been shown to be pro-tective against osteoporosis due to the additional mechanical loading and the endocrine-like proper-ties of adipocytes.3 Other risk factors include the
use of certain drugs such as glucocorticoids and antiepileptics and lifestyle behaviors such as ex-cessive alcohol consumption, smoking and physi-cal inactivity.9 However, high-impact physical
ac-tivity has been protective against osteoporosis and even improves bone mineral density.10 Some fac-tors that are linked to low BMD in premenopausal women include conditions that require the use of glucocorticoids and anticonvulsants and the eating disorder, anorexia nervosa.11 Other factors linked to low BMD in premenopausal women are de-layed menarche and amenorrhea.12 Moreover,
Depo-Provera, a contraceptive injected intramus-cularly, can cause a decline in femoral and spinal BMD.13,14 Additionally, young women tend to lack
knowledge regarding osteoporosis and its risk fac-tors.15
The primary aim of this research was to deter-mine if selected predictors of BMD in African-American and Caucasian college-aged women dif-fer by race.
Materials and Methods
Participants and Procedures
This was a prospective cohort study. African-American and Caucasian females were recruited by email, advertisement in university classrooms
and campus bulletin boards as well as in doctors’
offices, local churches, and local newspapers on a rolling basis beginning in August of 2009. All data were collected in the Bone Density and Body Composition Laboratory at a Mississippi univer-sity. Participants were required to come to the la-boratory on two separate occasions with there be-ing a weekend separatbe-ing the two visits. Partici-pants were included if they were between the ages of 18 and 30 years, and did not have any condi-tions that would place them at apparent risk (celi-ac disease, corticosteroid use, and amenorrhea) for low BMD. Since recruitment was mostly based around the university, this sample was considered a convenient sample.
Based on existing literature, eight factors were selected to determine the role and magnitude in predicting spinal and femoral BMD.9 The selected factors were race, family history of osteoporosis, body mass index (BMI), current physical activity, osteoporosis knowledge, length of time on oral contraceptives, age at menarche and calcium intake.
Anthropometric Assessment
Height and weight of all participants were measured using a balance scale (Detecto, Webb City, MO) on their very first visit. Body mass in-dex (BMI) was calculated as a ratio of the
partici-pant’s weight (kg) to her height (m2). For the
20.4 kg/m2, 2) normal weight if 20.5 BMI
kg/m2 24.4 kg/m2 and 3) high weight if BMI
24.5 kg/m2. Participants were stratified in this way
to closely emulate the BMI cutoffs set by WHO.
The WHO’s cutoffs are as follows: 1) underweight
if BMI < 18.5 kg/m2, 2) normal weight if 18.5
kg/m2 < BMI 24.9 kg/m2, and 3) overweight if
BMI ≥ 25 kg/m2.16
Race, Family history of osteoporosis, Osteo-porosis knowledge, Current physical activity, Age at menarche, Calcium, and Oral contr-aceptives
During the recruitment process, potential partic-ipants were asked to select their race. Only partici-pants who self-identified themselves as Caucasian or African-American were eligible to participate in the study. Family history of osteoporosis was estab-lished by asking participants, “Do you have a fam i-ly history of osteoporosis?” The answer choices
included, “Yes,” “No,” and “Don’t Know.”
During the first visit, osteoporosis knowledge was assessed using the Osteoporosis Knowledge Test (OKT).17 The 24-item, self-administered,
multiple-choice questionnaire has two subscales: OKT calcium and OKT exercise with reliability coefficients for internal consistency of 0.72 and 0.69, respectively.
Current physical activity was also assessed on
the participants’ first visit using a 7-day Physical Activity Recall Questionnaire.18 Participants
iden-tified each day of the week that they exercised at least 30 minutes. The physical activity variable was scored on a scale of 0 – 7 days. If a participant’s
total was ≥ 5 days, then she was considered to
have met the physical activity requirement, which is a primary guideline set forth by the American College of Sports Medicine and the American Heart Association for adults aged 18 to 65 years.19
Each participant’s age at menarche was sub -tracted from his or her current age to determine cumulative exposure to endogenous estrogen. During their initial visit, each participant was giv-en instructions on how to record their food intake over the next 4 days, which would consist of two-week days and two two-weekend days. Licensed
tech-nicians entered food records into the Nutrition Data System for Research (NDS-R, version 4.01). The NDS-R, which calculates nutrient intake, is a dietary analysis program developed by the Nutri-tion Coordinating Center at the University of Minnesota in 1998. This program was used to
de-termine each participant’s calcium intake.
Length of time of oral contraceptives was de-termined by asking participants, “Have you ever taken oral contraceptives”? If participants an
-swered, “Yes”, then they were asked, “How long did you take oral contraceptives”?
Bone Mineral Density Assessment
During participants’ first visit, BMD was meas -ured using the dual energy x-ray absorptiometry (DXA) Hologic Delphi-W (Hologic, Waltham, MA) and was expressed as t-scores. Individuals were classified as having low spinal BMD if their t-score was ≤ -1.0. Participants with a t-score ≤ -1.0 of the spine or femur were classified as having low BMD whereas a t-score > -1.0 was indicative of normal BMD. For the present study, t-scores were utilized for four reasons: 1) t-scores and z-scores are relatively equal for individuals between the ages of 19 and 30 years, 2) the densitometer utilized for this study contains an African-Ameri-can database, 3) t-scores rather than z-scores are utilized by the WHO for diagnostic criteria, and 4) z-scores are not available on the densitometer used in this study for individuals younger than 20 years of age.
Statistical Analysis
Sample size and power were determined using the statistical software package G*Power (3.1.9.2). Data were presented using means (SD) for quanti-tative variables and frequency (%) for qualiquanti-tative variables. ANOVA and independent samples t-tests were conducted to examine the association between each of the outcome variables (femoral and spinal BMD) with the selected risk factors: age, physical activity, calcium intake, oral contra-ceptive use, family history of osteoporosis, BMI, and race.
signifi-cant in predicting femoral and spinal BMD. Statis-tical significance was set as a P-value = 0.05.
Ethical Considerations
There was a fair and equitable participant selec-tion process in accordance with the aims of this study. This study also has scientific value. Lastly, the benefits of this study far outweighed the risks involved. After reviewing these ethical
considera-tions, this study was approved by the university’s
Institutional Review Board.
Results
Description of the Sample
A total of 101 participants (49.5% African-Americans and 50.5% Caucasians) were included in this study. African-American and Caucasian women were similar with respect to their mean age, anthropometric measures, and BMD scores (Table 1).
Table 1: Characteristics by Race and Overall
Characteristics Overall
(n =101)*
African American (n = 50)*
Caucasian (n = 51)*
Age (yr) 21.3 ± 2.2 21.0 ± 1.8 21.6 ± 2.6
Body Mass Index 23.4 ± 4.4 23.8 ± 4.9 23.0 ± 3.8
Spinal BMD (t-score) -0.5 ± 1.0 -0.6 ± 1.0 -0.4 ± 1.0
Femoral BMD (t-score) 0.4 ± 0.98 0.3 ± 0.9 0.5 ± 1.1
Hours of Physical Activity 5.5 ± 6.5 3.4 ± 4.4 7.7 ± 7.5
Grams of Calcium 0.9 ± 0.4 0.8 ± 0.3 0.98 ± 0.4
Oral Contraception Duration (months) 24.5 ± 28.2 19.0 ± 25.0 29.8 ± 30.4
*Mean + SD
Table 2 shows a summary of the responses on physical activity requirements, smoking habits, and oral contraceptive use, as well as Depo-Provera use. African-Americans were less likely to be a current smoker compared to Caucasians but
they were also more likely to have used Depo-Provera in comparison to Caucasians. Caucasians were more likely to meet physical activity require-ments in comparison to African-Americans.
Table 2: Percentage of participants that met physical activity requirements, reported smoking, used oral contracep-tive and used Depo Provera
Items African-Americans
n (%)
Caucasians
n (%)
Met physical activity requirements 14.0 29.4
Current smoker 2.0 9.8
Oral contraceptive use 62.0 76.5
Depo-Provera use 18.0 2.0
Bone Mineral Density
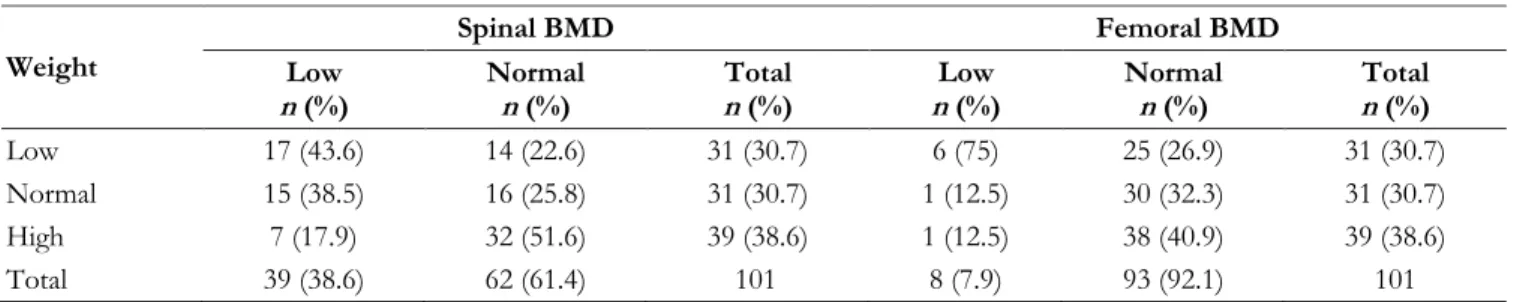
Results for spinal and femoral BMD by the weight categories are shown in Table 3. The mean spinal BMD was higher in participants who had a high weight compared to those in the low weight category. Similar to the mean spinal BMD, the mean femoral BMD was higher in individuals
Participants with a low weight were more than four times as likely to have low femoral BMD in
comparison to those who had a normal or high weight.
Table 3:Weight categories by Spinal and Femoral BMD
Weight
Spinal BMD Femoral BMD
Low
n (%)
Normal
n (%)
Total
n (%)
Low
n (%)
Normal
n (%)
Total
n (%)
Low 17 (43.6) 14 (22.6) 31 (30.7) 6 (75) 25 (26.9) 31 (30.7)
Normal 15 (38.5) 16 (25.8) 31 (30.7) 1 (12.5) 30 (32.3) 31 (30.7)
High 7 (17.9) 32 (51.6) 39 (38.6) 1 (12.5) 38 (40.9) 39 (38.6)
Total 39 (38.6) 62 (61.4) 101 8 (7.9) 93 (92.1) 101
Food Intake Assessment, Osteoporosis Know-ledge, and Physical Activity
Table 4 shows the percentage of participants meeting the Recommended Dietary Allowance (RDA) for calcium, vitamin D, iron, zinc, and magnesium. Calcium is the main nutrient that was
focused on for this study. Caucasian women were more than twice as likely as African-American women to meet the RDA for calcium and Cauca-sians were also more than four times as likely to meet the RDA for magnesium.
Table 4: Percentage Meeting RDA for Calcium, Vitamin D, Iron, Zinc, and Magnesium
Nutrients African American (%)
(n = 50)
Caucasian (%) (n = 51)
Total (%) (n = 101)
Calcium 16.0 37.3 26.7
Vitamin D 46.0 56.9 51.5
Iron 32.0 39.2 35.6
Zinc 72.0 66.7 69.3
Magnesium 6.0 27.5 16.8
The items included in the OKT and the per-centage of correct answers for African-Americans and Caucasians are reported in Table 5. Based on the responses to Question 6, more than 70% of Caucasian participants and over 60% of African-American participants did not realize that being a White woman with fair skin increases osteo-porosis risk. Based on the results to Question 22, more than 90% of African-Americans and 87% of Caucasians did not know the recommended milli-grams of calcium intake for adults.
Findings for time spent engaging in physical activity are reported in Table 1. For the purpose of this study, the time spent engaging in moderate and vigorous physical activities were combined. Only 21.8% of the participants met physical activ-ity requirements (Table 2). Caucasian participants were more likely to engage in the recommended
amount of physical activity than African-American participants were. There was also a statistically sig-nificant difference (P = 0.001) between Caucasian and African-American participants regarding total hours of physical activity with Caucasians spend-ing more time engaged in physical activity than African-Americans.
Linear Regression Findings
Table 5: Percentage of Correct Responses on Osteoporosis Knowledge Test for Each Race and Overall
Items African American (%)
(n = 50)
Caucasian (%)
(n = 51)
Total (%)
(n = 101)
1. Eating a diet low in milk products 84.0 98.0 91.1
2. Being menopausal: “change of life” 48.0 92.2 70.3
3. Having big bones 30.0 31.4 30.7
4. Eating a diet high in dark green leafy vegetables 52.0 70.6 61.4
5. Having a mother or grandmother who has
osteoporo-sis 84.0 98.0 91.1
6. Being a white woman with fair skin 38.0 27.5 32.7
7. Having ovaries surgically removed 18.0 37.3 27.7
8. Taking cortisone (steroids, e.g., Prednisone) for long
time 54.0 51.0 52.5
9. Exercising on a regular basis 88.0 100.0 94.1
10. Which of the following exercises is the best way to
reduce a person’s chance of getting osteoporosis? 44.0 33.3 38.6
11. Which of the following exercises is the best way to
reduce a person’s chance of getting osteoporosis? 48.0 43.1 45.5
12. How many days a week do you think a person should
exercise to strengthen their bones? 76.0 84.3 80.2
13. What is the least amount of time a person should
exer-cise on each occasion to strengthen their bones? 78.0 84.3 81.2
14. Exercise makes bones strong, but it must be hard
enough to make breathing: 52.0 52.9
52.5
15. Which of the following exercises is the best way to reduce a person’s chance of getting osteoporosis
92.0 84.3 88.1
16. Which of the following exercises is the best way to
reduce a person’s chance of getting osteoporosis? 88.0 84.3 86.1
17. Which of these is a good source of calcium?(cheese) 90.0 100.0 95.0
18. Which of these is a good source of calcium?(canned
sardines) 22.0 25.5
23.8
19. Which of these is a good source of calcium?(chicken) 78.0 66.7 72.3
20. Which of these is a good source of calcium?(yogurt) 84.0 100.0 92.1
21. Which of these is a good source of calcium?(ice cream) 52.0 76.5 64.4
22. Which of the following is the recommended amount of
calcium intake for an adult? 10.0 13.7 11.9
23. How much milk must an adult drink to meet the
rec-ommended amount of calcium? 50.0 56.9 53.5
24. Which of the following is the best reason for taking a
calcium supplement? 76.0 82.4 79.2
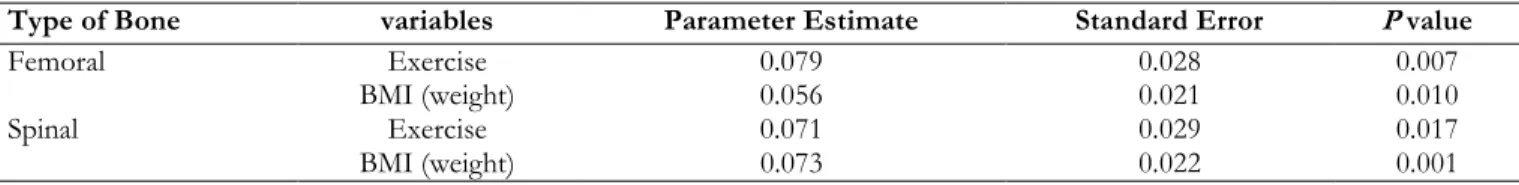
Multiple regression results indicate that BMI and total hours of physical activity are significant predictors of femoral BMD, as well as, spinal BMD. The results from the linear regression anal-ysis for spinal BMD are presented in Table 6. Ac-cordingly, the final linear regression model (R2=14.8%; P=0.0004) for spinal BMD was Y =
Table 6: Multiple Regression Results for Femoral and Spinal BMD
Type of Bone variables Parameter Estimate Standard Error P value
Femoral Exercise 0.079 0.028 0.007
BMI (weight) 0.056 0.021 0.010
Spinal Exercise 0.071 0.029 0.017
BMI (weight) 0.073 0.022 0.001
Discussion
A previous study reported that approximately 15% of premenopausal women have low BMD.20
In this study of premenopausal women, 38.6% had low spinal BMD; and 7.9% had low femoral BMD. Finding no racial differences were an un-precedented finding because numerous studies indicate that African-American women consist-ently have higher BMDs when compared to their Caucasian counterparts.21 Due to prior research
findings, one would expect that African-American women would consistently have higher BMDs than Caucasian women would across each weight category. This, however, is not what was found in the present study. It is probable that the higher prevalence of past and present use of Depo-Provera among African-American participants eliminated the racial differences that would typi-cally be seen in this age group. Depo-Provera, a contraceptive which is injected intramuscularly, can cause a decline in femoral and spinal BMD.13, 14 In the present study, 18% of African-Americans
reported past or current Depo-Provera use in comparison to 2% of Caucasian participants.
Weight status affects BMD.22,23 In the current
study, 43.6% of individuals who were classified as having a low weight also had low spinal BMD; and 75% of those who had a low weight had low femoral BMD. Being thin and/or having a small frame is listed as one of the risk factors for low bone mass, meaning that a larger frame or higher weight would be associated with a higher bone density.6,9 We were unable to recruit successfully
underweight African American participants in ac-cordance with the WHO criteria. Consequently, for the purpose of this study, both African Ameri-can and Caucasian women were considered
under-weight if they had a BMI of ≤ 20.4 kg/m2. Weight
was a significant predictor of both spinal and femoral BMD. Furthermore, participants in the low weight category had significantly different mean femoral BMDs than individuals in the high weight category; and participants in the low and normal weight categories had significantly differ-ent mean spinal BMDs than individuals in the high weight category. The proportion of lean mass to fat mass has an effect on BMD.23
One of the limitations of the present study was not distinguishing between fat mass and lean mass. Weight (BMI) was used rather than fat and lean mass to give physicians and the public a more convenient way of determining risk for low BMD. A previous study examined risk factors for low BMD in Caucasian women ages 22 to 44 and re-ported that current physical activity is not related to BMD.24 When participants in the present study were categorized into two groups; those who met the physical activity requirements and those who did not, t-test results showed no statistically signif-icant difference in spinal or femoral BMDs be-tween the two groups. However, when total hours of physical activity were included in the linear re-gression model for spinal and femoral BMD, it was a significant predictor. This finding is con-sistent with an earlier study that included 157 women, aged 18 to 39.25 They found that current
physical activity was significantly associated with spinal BMD (P = 0.004).
physical activity reported in 30% of the subjects in a similar age group to that of the present study.26 Total hours of physical activity were significantly different between Caucasians and African-Ameri-cans. Caucasians were more likely to meet physical activity requirements in comparison to African-Americans. The lack of physical activity is a possi-ble reason why low spinal BMD was so prevalent in this sample.
It is clear from the number of participants in the study who are affected by low BMD that pro-grams need to be established to encourage young women to engage in behaviors that will maximize their bone densities. Premenopausal women should be encouraged to modify their lifestyles to improve their BMD.27 Physical activity,
particu-larly weight-bearing exercises, and helps to im-prove BMD. Since physical activity was significant in predicting BMD in this study, programs that specifically target increasing physical activity among young women, especially Ameri-cans, should be established; seeing that African-Americans are less likely to meet physical activity requirements in comparison to other racial groups.19
After including variables to explain BMD, only weight and physical activity were significant in predicting spinal and femoral BMD. These two significant predictors only accounted for 14.9% and 13.1% of the variance in spinal and femoral BMD, respectively. It is possible that genetics ac-counts for, in part, the remaining unexplained var-iance. An earlier study reported that up to 80% of the differences seen in peak BMD can be at-tributed to genetic factors.28 Other variables that
we did not measure could also accounts for the unexplained variance.
Early menarche has been shown to result in higher BMD in premenopausal women just as late menarche results in lower BMD and increased risk of fracture in postmenopausal women.29 These findings are due to the differences in duration of exposure to endogenous estrogen.29 For the
pur-poses of this study, each participant’s age at me n-arche was subtracted from their current age to determine cumulative exposure to endogenous
estrogen. Age at menarche was not a significant predictor of spinal or femoral BMD.
The restrictions in this sample cannot be dis-counted as attributing to the lack of a substantial amount of variance in BMD being found. Since this sample was restricted regarding age and fac-tors that place women at apparent risk for low BMD, the amount of variability was reduced. Thus, it is difficult for the current study to ac-count for a substantial amount of variance due to the research design limiting the variability of the sample. Another limitation of the study was the use of a convenience sample. With the use of a convenience sample, there is a chance that these results cannot be applied to the general population.
Since physical activity was a significant predic-tor of spinal and femoral BMD for this study, fu-ture studies can examine time participants spent engaging in endurance exercise versus resistance exercise to see which type exhibits the greatest effect on BMD. Additionally, because of the lim-ited knowledge about osteoporosis, a future study could include an osteoporosis-knowledge interve-ntion.
Practical Implications
As noted earlier, weight (BMI) rather than per-cent body fat was used in this study to make it easier for practitioners to readily assess the risk for low bone density in young women. The National Osteoporosis Foundation (NOF) does not recom-mend women get a DXA scan until the age of 65 year; however, the bone density of women begins to decline years before that age. It is imperative that practitioners recognize the early risk factors in young women for the development of osteopo-rosis later in life. This study shows that a healthy body weight and physical activity can affect BMD.
Conclusion
aware of their low-BMD status, they can begin bone-building activities before them reach peak bone mass. This provides an opportunity to de-crease risk for osteoporosis and related fractures later in life. Weight and physical activity were sig-nificant predictors of spinal and femoral BMD. Women between the ages of 18 and 30 should be encouraged to maintain a healthy body weight as well as participate in weight-bearing physical activ-ity, which will increase their spinal and femoral BMD.
Conflict of Interest
The authors declare no financial or personal conflict of interests.
References
1. Thomas P. Racial and ethnic differences in
oste-oporosis. J Am Acad Orthop Surg 2007;15:26-30.
2. Lane NE. Epidemiology, etiology, and diagnosis
of osteoporosis. Am J Obstet Gynecol
2006;194:3-11.
3. Greco EA, Fornari R, Rossi F, Santiemma V,
Prossomariti G, Annoscia C, et al. Is obesity pro-tective for osteoporosis? Evaluation of bone mineral density in individuals with high body
mass index. Int J Clin Pract 2010;64:817-820. doi:
10.1111/j.1742-1241.2009.02301.x
4. Johnell O, Kanis J. Epidemiology of osteoporotic
fractures. Osteoporos Int 2005;16:S3-S7.
doi:10.1007/s00198-004-1702-6
5. Winters-Stone K. ACSM Action Plan for Health
Series: Action Plan for Osteoporosis. Champaign, IL: Human Kinetics; 2005.
6. WHO Study Group. Assessment of fracture risk
and its application to screening for postmeno-pausal osteoporosis. World Health Organization Technical Report Series 1994;843:1- 129.
7. Barrett-Connor E, Siris ES, Wehren LE, Miller
PD, Abbott TA, Berger ML, et al. Osteoporosis and fracture risk in women in different ethnic
groups. J Bone Miner Res 2005;20:185-194. doi:
10.1359/JBMR.041007
8. Kidambi S, Partington S, Binkley N. Low bone
mass prevalence and osteoporosis risk factor as-sessment in African American Wisconsin women.
WMJ 2005;104:59-65.
9. Amonkar MM, Mody R. Developing profiles of
postmenopausal women being prescribed
estro-gen therapy to prevent osteoporosis. J Community
Health 2002;27:335-350.
10. Vainiopaa A, Korpelainen R, Leppaluoto J, Jamsa
T. Effects of high-impact exercise on bone min-eral density: a randomized controlled trial in
premenopausal women. Osteoporos Int 2005;
16:191-197.
11. Hansen LB, Vondracek SF. Prevention and
treat-ment of nonpostmenopausal osteoporosis. Am J
Health Syst Pharm 2004;61:2637-2654.
12. Gourlay ML, Brown SA. Clinical
con-siderations in premenopausal
osteopo-rosis. Arch Intern Med 2004;164:603-614.
doi:10.1001/archinte.164.6.603
13. Walsh JS, Eastell R, Peel NF. Effects of depot
medroxyprogesterone acetate on bone density and bone metabolism before and after peak bone
mass: a case-control study. J Clin Endocrinol Metab
2008;93:1317-1323. doi:10.1210/jc.2007-2201
14. Clark MK, Sowers MR, Nichols S, Levy B. Bone
mineral density changes over two years in first-time users of depot medroxyprogesterone
ace-tate. Fertil Steril 2004;82:1580-1586.
doi:10.1016/j.fertnstert.2004.04.064
15. Kasper MJ, Garber M, Walsdorf K. Young
women’s knowledge and beliefs about osteop
o-rosis. Am J Health Educ 2007;38:186-193.
doi:10.1080/19325037.2007.10598969
16. World Health Organization. 2008. Available from:
http://apps.who.int/bmi/index.jsp?introPage=in tro_3.html
17. Kim K, Horan M, Gendler P, Patel M.
Osteopo-rosis health belief, self-efficacy , and knowledge tests. USA:Grand Valley State University, Al-lendale, MI;1991.
18. Dishman RK, Steinhardt M. Reliability and
concurrent validity for a 7-day recall of phys-ical ac-tivity in college students. Med Sci
Sports Exerc 1988;20:14-24.
doi:10.1249/00005768-198802000-00003
19. Haskell WL, Lee IM, Pate RR, Powell KE,
Blair SN, Franklin BA, et al. Physical activity and public health: Updated recommendation for adults from the American College of Sports Medicine and the American Heart
Association. Med Sci Sports Exerc
2007;39:1423-1434.
20. Khan AA, Bachrach L, Brown JP, Hanley DA, Josse RG, Kendler D, et al. Standards and guide-lines for performing central dual-energy x-ray ab-sorptiometry in premenopausal women, men, and
children. J Clin Densitom 2004;7:51-64.
doi:10.1385/jcd:7:1:51
21. US Department of Health and Human Services.
Bone health and osteoporosis: A Report of the Surgeon General. Rockville, MD: US Department of Health and Human Services, Office of the Surgeon General;2004.
22. Rollins D, Imrhan V, Czajka-Narins DM, Nichols
DL. Lower bone mass detected at femoral neck and lumbar spine in lower-weight versus normal-weight small-boned women. J Am Diet Assoc
2003;103:742-744. doi:10.1053/jada.2003.50138
23. Wang MC, Bachrach LK, Van Loan M, Hudes
M, Flegal KM, Crawford PB. The relative contri-butions of lean tissue mass and fat mass to bone
density in young women. Bone 2005;37:474-481.
doi:10.1016/j.bone.2005.04.038
24. Bainbridge KE, Sowers M, Lin X, Harlow SD.
Risk factors for low bone mineral density and the 6-year rate of bone loss among premenopausal
and perimenopausal women. Osteoporos Int
2005;15:439-446. doi:10.1007/s00198-003-1562-5
25. Ford MA, Bass MA, Turner LW,
Mauromus-takos A, Graves BS. Past and recent physical ac-tivity and bone mineral density in college-aged
women. J Strength Cond Res 2004;18:405-409.
doi:10.1519/13343.1
26. Wallace LS. Osteoporosis prevention in college
women: application of the expanded health belief
model. Am J Health Behav 2002;26:163-172.
doi:10.5993/ajhb.26.3.1
27. Khan A. Premenopausal women and low bone
density. Can Fam Physician 2006;52:743-747.
28. Koller DL, Econs MJ, Morin PA, Christian JC,
Hui SL, Parry P, et al. Genome screen for QTLs contributing to normal variation in bone mineral
density and osteoporosis. J Clin Endocrinol Metab
2000;85:3116-3120. doi:10.1210/jcem.85.9.6778
29. Chevalley T, Bonjour JP, Ferrari S, Rizzoli
R. Influence of age at menarche on forearm bone microstructure in healthy young
wom-en. J Clin Endocrinol Metab