DOI: 10.1590/1808-057x201703630
Investor relations and information asymmetry*,**
Sandrielem da Silva Rodrigues
Universidade Federal do Rio Grande do Sul, Escola de Administração, Programa de Pós-Graduação em Administração, Porto Alegre, RS, Brazil
Fernando Caio Galdi
FUCAPE Business School, Departamento de Contabilidade e Finanças, Vitória, ES, Brazil
Received on 04.19.2016 – Desk acceptance on 05.20.2016 – 3rd version approved on 01.09.2017
ABSTRACT
Companies invest signiicant volumes of resources in investor relations (IR) departments. he professionals working in the IR department are responsible for communication between the company and the market, so that the information generated is widely disseminated and understood by investors. In this context, this research aims to investigate whether there is evidence that the IR activity decreases information asymmetry between the company and the market. Speciically, we evaluate the hypothesis that Brazilian companies with IR websites classiied as more informative have a reduced bid-ask spread (proxy for asymmetry). herefore, this paper classiies the informative content from IR websites of Brazilian companies for the years 2013 and 2014 and relates the outcomes obtained with information asymmetry metrics. Initially, the estimation considers the pooled ordinary least squares (POLS) model and, at a second moment, in order to mitigate potential endogeneity problems, the pooled two-stage least squares (2SLS) model is used. he results indicate that more informative IR websites are able to decrease the bid-ask spread of Brazilian listed companies. his inding strongly encourages companies to provide information to stakeholders on well-structured IR websites of their own.
Keywords: investor relations (IR), bid-ask spread, Brazilian capital market, inancial information, information asymmetry.
*Paper presented at the XXXIX Meeting of the Brazilian National Association of Graduate Studies and Research in Administration, Belo Horizonte, MG, Brazil, September 2016.
1. INTRODUCTION
Investor relations (IR) departments are responsible for communication between the company and the market
(Marston, 1996). h ey work, not necessarily, by increasing
information content, but improving information l ow from the company to the market and from the market to the company (Bollen, Hassink & Bozic, 2006). Considering the above, IR is believed to help companies to reduce the problems stemming from information asymmetry, since greater access to information improves the monitoring process in organizations. Also, with greater access to company information, previously uninformed investors can assess more accurately company performance, reducing the likelihood of making mistakes in bond pricing. Periodic meetings with investors may be cited as examples of IR departments, in which specii c questions about company i gures can be addressed, as well as operational data (e.g. sales volume, production capacity) that are not required by regulatory bodies.
It is also noticed that in highly asymmetric environments, less informed investors mitigate uncertainty, decreasing the purchase price and/or increasing the selling price of bonds traded (Verrecchia, 2001; Welker, 1995), something which, in turn, reduces the possibility of trading, increasing the diff erence between supply and demand, and this is rel ected in the bid-ask spread (Copeland & Galai, 1983). So, the motivation of this study lies on the fact that IR activities are capable of aff ecting information asymmetry, changing the behavior of uninformed investors (Chang, D’anna, Watson & Wee, 2008). In this context, facilitating access to company information reduces the risk of private information trading, attracting investors and increasing the amount of stocks traded (Brown & Hillegeist, 2007).
International studies point out that IR activities are able to decrease the risk associated with information asymmetry, increase share liquidity, decrease the cost
of equity (Agarwal, Liao, Nash, Taffl er & Taffl er, 2008),
improve visibility so that the company’s shareholder base is widened, analyst and media coverage (Bushee & Miller, 2012), and increase accuracy and concordance in analysts’
forecasts, leading to a reduced cost of capital and increased share prices (Brennan & Tamarowski, 2000). However, in the case of Brazilian companies, the literature lacks papers that investigate the eff ects of IR programs as a whole.
In view of the above, this research aimed to investigate whether actions taken by the IR area can reduce information asymmetry between company and investors in the Brazilian capital market. Specii cally, we evaluate the hypothesis that companies with IR websites classii ed as more informative have a reduced bid-ask spread. To do this, we initially estimated regressions by means of pooled OLS and, at a second moment, aiming to mitigate potential endogeneity problems, we adopted the estimator pooled 2SLS.
In the results, a negative correlation between the disclosure level in IR websites and the bid-ask spread is observed. In addition, evidence suggests that among the six categories making up the IR website’s information checklist, the greater disclosure of press releases and other i nancial information services and availability of resources such as video/audio recording and online participation in meetings are factors that have statistical signii cance, and they are negatively correlated with the bid-ask spread.
h e results found corroborate the papers by Agarwal
et al. (2008), Brown and Hillegeist (2007), Healy, Hutton and Palepu (1999), Hel in, Shaw and Wild (2005), and Welker (1995). However, this group of studies was mainly based on disclosure indices that do not consider the isolated eff ect of i nancial information as performed by
this study. h erefore, it is believed that the results found
supplement in the literature on IR, since it shows that the dissemination of i nancial information is the activity that most contributes to reduce information asymmetry between the IR activities that were investigated.
h e remainder of this paper is organized into four
2. LITERATURE REVIEW
h is section presents the studies on which this research
is based. h e i rst subsection includes specii c IR studies
and the second presents the main references regarding the relationship between information asymmetry and bid-ask spread.
2.1 Investor Relations
Marston (1996) defines IR as the link between listed companies and agents in the global financial community, providing information that helps assessing the company. Traditionally, IR functions cover activities such as planning and executing routine and occasional disclosure of information, coordinating meetings and other services to shareholders, conducting public and individual meetings with analysts, shareholders, and potential investors, and continuously evaluating market responses to the company’s performance (Instituto Brasileiro de Relações com Investidores [IBRI], 2008). Morevover, IR has been regarded as an important area in corporate marketing strategies to dei ne the organization’s image (Dolphin, 2004).
In 2014, Brazilian companies already had exclusive IR departments (90%), formally constituted for more than seven years (33%), which annually consumed resources ranging from 500,000 to 1,000,000 reais in communication, publication, advertising, and services provided by third parties (20%) (Instituto Brasileiro de Relações com Investidores [IBRI] & Fundação Instituto de Pesquisas Contábeis, Atuariais e Financeiras [FIPECAFI], 2015).
h e IR departments in Brazil are large when compared in
world terms. Brazilian companies have a larger number of IR professionals, with an average of 2.8, as well as support staff professionals, with an average of 2.1, higher than the global average of 2.1 IR professionals and 1.1 support staff professionals (Bank of New York Mellon, 2015). In addition, the proi le outlined by the 2015 IBRI & FIPECAFI survey shows that professionals working in the IR area are mostly aged between 30 and 50 years (58%), they accumulate i ve or more years of experience in the area (39%), they completed undergraduate (33%) and graduate courses (40%) in administration, whose wages vary between more than R$ 26,000 to directors and R$ 2,500 to junior analysts.
Within the academic community, there is an increasing interest in pointing out the benei ts generated by IR activities. Brennan and Tamarowski (2000) concluded that IR activities are capable of increasing the number of
analysts who cover a company, improving the accuracy and concordance of forecasts. Moreover, the survey revealed that the number of analysts is associated with greater liquidity of stocks traded, reduced shareholders’ cost of capital, and increased share prices. Agarwal et al. (2008) found that companies awarded Best IR Programs were able to reduce asymmetric information, leading to lower transaction costs and consequent increases in
turnover. h e results also showed that small winning
companies obtained a signii cant increase in the liquidity of their stocks.
Bushee and Miller (2012) analyzed the post-hiring eff ects of an IR agency specialized in small and medium-sized businesses, seen as less visible, noticing signii cant improvements in visibility, widened shareholder base, analyst and media coverage. In contrast, Kirk and Vincent (2014) investigated the eff ects of internally investing in IR by hiring a member of the National Investor Relations Institute [NIRI]. As a result, companies that initiated an IR program internally had a signii cant increase in voluntary disclosure, analyst coverage, and number of institutional investors, improving share liquidity and market valuation.
Specii cally regarding the use of websites for IR, Chang et al. (2008) found that Australian companies with websites having more information available showed greater analyst coverage, higher proportions of institutional investors, market capitalization, and trading volume. Chang, Hooi e Wee (2014) have shown the importance of active communication with analysts, especially in times of uncertainty, i nding that disclosure by Australian companies on the internet correlate positively with accuracy of analysts’ forecasts, in a scenario dominated by small companies with limited analyst coverage. Another advantage of using websites to disseminate information is the increased market value of companies, as shown by Ferreira (2012), which evidenced an average 19% increase in market value at er the launch of a website for disclose information, when compared to companies that did not do so. Likewise, Garay, González, Guzmán and Trujillo (2013) found a strong positive correlation between the corporate disclosure level, on IR websites of companies listed in Argentina, Brazil, Chile, Colombia, Mexico, and Peru, and the company’s value.
using non-i nancial information in at least one investment decision per year. Specii cally, 54.2% of the investors interviewed see corporate websites as a source of relevant information in investment decision-making, only behind annual reports and integrated reports. Also, the benei ts related to new ways of disseminating information through the internet have been observed by recent studies, as shown by Blankespoor, Miller e White (2014), who investigated the use of Twitter to divulge information to investors and other stakeholders, noticing that tweets during the period of proi t/loss announcement were able to reduce information asymmetry, especially for less visible companies, and Yoo, Zo and Ciganek (2011), who identii ed a negative correlation between the adoption of XBRL by Korean companies and information asymmetry between these companies and the capital market.
Some studies were concerned with verifying which corporate features are capable of inl uencing the disclosure level of IR. Marston (1996), in a seminal research, identii ed a positive correlation between IR, i rm size, and company stock listing on foreign stock exchanges. Mendes-da-Silva and Onusic (2014) found that larger and newly listed companies, as well as those recognized for adopting best governance practices (as required by the New Market) provided more corporate information on their websites. Likewise, Lundholm, Rogo and Zhang (2014) found that foreign companies listed on the U.S. stock exchange require more from their IR departments, providing more information and producing clearer texts in their reports. Basuony and Mohamed (2014), analyzing the determinants of voluntary disclosure of i nancial information on the internet by companies listed in Saudi Arabia and Oman, identii ed that company size is the main inl uence factor for disclosure. Mendes-Da-Silva and Magalhães (2005) found a positive relation between the size of Brazilian companies and the amount of i nancial information disclosed in corporate websites and a negative relation between the return on stocks and the amount of information. In addition, Mendes-da-Silva, Ferraz-Andrade, Famá and Maluf (2009) found that greater disclosure is associated with large companies, higher return on stocks, those that adhere to one level of diff erential corporate governance (New Market, Level 1 and 2), the most leveraged companies, and the categories of corporate information more required by brokerage i rms and rating agencies. On the other hand, Hoff mann, Tutic and Wies (2011) found that companies with greater educational diversity of IR professionals showed more information on their IR websites and less intense activism on the part of shareholders.
It is noticed that the expansion of internet use has allowed the democratization of access to corporate information useful to the market, expanding the IR activity through interactive communication tools (chat and online participation in meetings), something which, in turn, helps the company to enhance investor perceptions, as well as it minimizes disagreement with its internal policies
(Brown & Hellegeist, 2007). However, one of the diffi culties
found in the dissemination literature is measuring the information provided by companies on the internet. Some initial eff orts to measure the content available online by companies can be seen in Deller, Stubenrath and Weber (1999), Geerings, Bollen and Hassink (2003), and Hedlin (1999). Hedlin (1999) investigated, through content analysis, what the companies advertise on their IR websites, proposing a three-stage model of internet disclosure: (i) it refers to presence on the internet; (ii) the internet is used to provide information beyond those mandatory ones; (iii) it comprises the advantages the internet off ers, regarding the way information can be presented to the user. At the same time, Deller et al. (1999) conducted a detailed evaluation of items off ered by listed companies on their IR websites in the USA, the UK, and Germany, and the authors were concerned about considering the new communication forms off ered by the
internet. h e authors examined, for each company in the
sample, the availability of these items: mandatory i nancial statements; historical series of financial statements, data in processable format, internal search engines and cookies; press releases and other information services; direct contact via email and direct marketing; recording of meetings, online participation, and links to external information.
h e results showed that, in the USA, IR activities
through the internet were more common (91% of the companies) and off ered more resources, when compared to the other two countries, and that although the internet off ered a variety of possibilities for communicating with investors (e.g. audio and video resources), it was only used partially in the three countries.
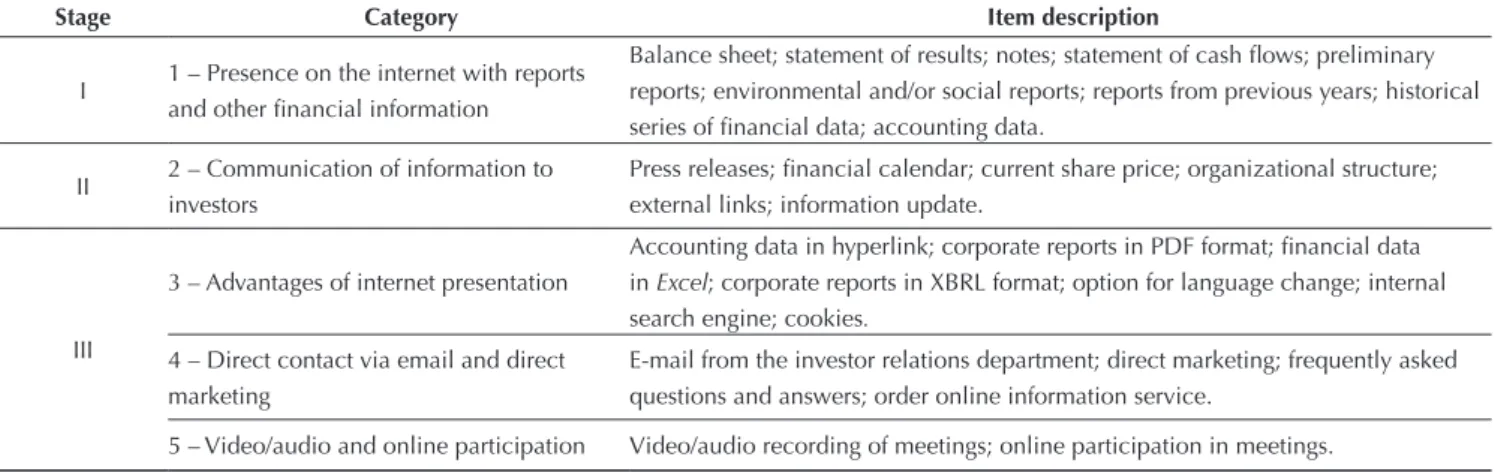
In a later study, Geerings et al. (2003), aiming to expand the results on online dissemination practices, changed the model by Hedlin (1999), incorporating i ve categories based on the characteristics previously investigated by Deller et al. (1999), in order to cover a larger number
of items. h e main change in Heldin’s model concerns
the third stage, which was divided into three categories,
as Table 1 illustrates. h e authors concluded that most
Table 1 Categories of information disclosed on the internet
Stage Category Item description
I 1 – Presence on the internet with reports and other i nancial information
Balance sheet; statement of results; notes; statement of cash l ows; preliminary reports; environmental and/or social reports; reports from previous years; historical series of i nancial data; accounting data.
II 2 – Communication of information to investors
Press releases; i nancial calendar; current share price; organizational structure; external links; information update.
III
3 – Advantages of internet presentation
Accounting data in hyperlink; corporate reports in PDF format; i nancial data
in Excel; corporate reports in XBRL format; option for language change; internal
search engine; cookies.
4 – Direct contact via email and direct marketing
E-mail from the investor relations department; direct marketing; frequently asked questions and answers; order online information service.
5 – Video/audio and online participation Video/audio recording of meetings; online participation in meetings.
Source: Adapted from Geerings et al. (2003).
information (18 to 29 items) when compared to smaller companies (14 items). Furthermore, leading companies
in France and the Netherlands were either at the third phase or ready to move into it.
h us, this paper contributes to the dissemination
literature, increasing the amount of measures for IR activity on the internet. More details will be discussed in the methodology section.
2.2 Information Asymmetry and Bid-Ask Spread
Information asymmetry occurs when some economic agents have more information than others. As a consequence, uninformed investors negotiate with informed investors, generating problems related to adverse selection (Akerlof, 1970) and/or moral hazard (Jensen & Meckling, 1976). In order to mitigate the risk of such trading, uninformed investors reduce the price they are willing to pay for a bond and/or raise the price asked to sell it (Verrecchia, 2001; Welker, 1995), widening the gap
between off er and demand prices of the company’s stocks, named as bid-ask spread.
Empirical studies conducted since the 1960s indicate the relation of the bid-ask spread, or simply spread, with liquidity in the trading of stocks and with
information received by the market. h e i rst analyses
on the determinants of the bid-ask spread in the bond market followed the seminal article by Demsetz (1968). According to the author, spread may be dei ned as the diff erence between the lowest selling off er (ask) and the highest purchase off er (bid) immediately prior to trading. However, in order to mitigate problems caused by bid-ask bounce, as sometimes there are changes in quoted bid and ask that are quickly reversed, the midpoint spread
is used in calculation (Aitken & Frino, 1996). h us, the
diff erence between them may be expressed as:
knowing that
where: Pa
t = ask quoted in time period t; P b
t = bid quoted
in time period t; Pmt = midpoint spread in time period
t; St = bid-ask spread in time period t.
It is worth noticing that studies conducted since the 1990s started calculating spread in intraday (from quote to
quote). h e main justii cation for this methodology is the
objective of analyses, which focused on intraday volume patterns of spread (Fleming, 1997; Lee, Mucklow & Ready, 1993; Mcinish & Wood, 1992) and liquidity calculation (Chakravarty & Sarkar, 1999; Fleming, 2003; Fleming & Sarkar, 1999). However, many samples, especially those with long-term databases, have included only daily data or data observed at long time intervals (Hasbrouck, 2007).
h e pioneering study by Demsetz (1968) focused much
more on liquidity and trading costs in stock markets than on information inl uence over spread. Further research, though, tried to deepen knowledge on the relation of this measure with the components of information asymmetry.
One of the i rst references of information inl uence on market equilibrium prices consisted in the paper written by Copeland (1979), where the author commented on the expectation of increasing spreads in face of price uncertainty, also noticing the influence of financial volumes traded according to this metrics.
Complementarily, Copeland and Galai (1983) used the combination of purchase and sale options and the role played by the market maker to demonstrate information inl uence on the bid-ask spread. According to the authors, the market maker seeks to maximize the bid-ask spread diff erence between two investor classes: one motivated by liquidity and another motivated by information. In addition, the study showed that spread correlates negatively with the market competition degree.
Glosten and Milgrom (1985) argue that spread may
be due to the costs of adverse selection arising from the information asymmetry existing between market participants, since the presence of privileged traders promotes a positive bid-ask spread, even when the market makers are risk neutral and have zero proi t expectation. In the same line, Glosten (1987) created the model for calculating the bid-ask spread that captures the adverse selection component. According to the author, spread is divided into two components: one due to monopoly power, loading cost, and custody cost, and another due to information asymmetry, which is capable of generating advantages to informed traders.
Stoll (1989) states that three costs must be considered as embedded in the spreads to which traders are subject: order processing cost, asset storage cost, and adverse selection cost (information asymmetry component). By using daily NASDAQ/NMS data on share price and spreads, Stoll (1989) concludes that, on average, order processing cost represents 47% of the spread, the cost of holding assets, 10%, and what refers to the information asymmetry component represents 43% of the total cost.
Other proxies have been used in research to estimate information asymmetry: probability of insider trading
(PIN), stock market liquidity, and bond volatility. h ere
is evidence that suggests bid-ask spread as the measure of information asymmetry most frequently used in academic research (Girão & Machado, 2013). Due to its measurement characteristic, bid-ask spread rel ects uncertainty about the asset’s value and the greater uncertainty, the greater information asymmetry between parties in a negotiation. Finally, we can see, based on the studies presented herein (Copeland, 1979; Copeland & Galai, 1983; Glosten, 1987; Glosten & Milgrom, 1985; Stoll, 1989), that bid-ask spread is an adequate proxy for information asymmetry.
3. METHODOLOGY
h is paper is a quantitative research with panel data.
h e information used refer to 2013 and 2014 and they
were analyzed using the regression models pooled OLS and pooled 2SLS. The sample was selected from all companies classii ed as active on the Brazilian Securities, Commodities, and Futures Exchange (BM&FBOVESPA)
within these periods. Companies from the i nancial or insurance sector were removed, due to their diff erential capital structures, as well as companies that did not have data required to operationalize the explanatory variables
used in the regressions. h us, the i nal sample for OLS
regressions included 304 observations for the years 2013
and 2014, in which each year is represented by the cross-section of 152 companies. Likewise, for 2SLS regressions, the i nal sample included 294 observations for the years 2013 and 2014, in which each year is represented by the cross-section of 147 companies.
h e data used in this research comprise primary
information obtained by accessing IR websites and secondary information whose sources were the databases BM&FBOVESPA, Economatica, Brazilian Securities and
Exchange Commission (CVM), S&P Capital IQ, and Reuters.
3.1 Information Asymmetry (SPREAD)
h e proxy chosen to estimate information asymmetry
in this study is bid-ask spread, calculated according to the seminal article by Demsetz (1968) and standardized (divided) by the midpoint spread within the trading
period. h us, the average daily spread for the trading
period may be expressed according to equation 3:
where: Pa
i,t = quoted ask (lowest selling off er) in time
period t of company i; Pb
i,t = quoted bid (highest purchase
off er) in time period t of company i; Pmi,t = midpoint
spread in time period t of company i; Si,t = average daily
bid-ask spread in time period t of company i; ∑ = Greek
letter sigma, which represents the operation sum in this paper.
h e midpoint spread (Pmi,t) is given by (Pa i,t – P
b i,t )/2.
Daily buy and sell offers were extracted from the BM&FBOVESPA website, where they are available for download. Only the most liquid stocks of each company were used for calculation and their outcome was regarded as absolute value.
3.2 IR Website
h e absence of an index or ranking available that
classii es Brazilian listed companies having the amount
of information provided on their IR websites as a basis motivated the preparation of a list of their own, starting from a similar study by Geerings et al. (2003), summarized in Table 1, and instructions contained in the IR Guide IBRI-BOVESPA for including specific issues in the Brazilian market.
Visits carried out during the three-month period (May to July 2014) noticed the presence (or not) of the 33-item checklist distributed into six categories, with a visit to each website. At the end of collection, the coni rmation round was performed, in which 60% of the sample were randomly revisited, and no diff erence was found. Regarding the scoring form, we assigned the scores 1, for presence, and 0, for absence of each item, the lowest score
was 0 and the highest was 33. h is study considered the
same score for the variable IR for 2013 and 2014. Table 2 displays the complete list of verii ed items.
Table 2 Items checked on companies’ website
Category Item
1 – Presence on the internet
1 Website
2 Investor relations website
2 – Financial information
3 Annual report
4 Financial statements
5 Quarterly information
6 Standardized i nancial statements
7 Files from the Brazilian Securities and Exchange Commission and the annual reports
8 Sustainability reports
9 Reports from previous years
10 Main i nancial indicators
3 – Press releases and other information services
11 Press releases
12 Earning release
13 Schedule of disclosure
14 Corporate governance information
15 Current share price
16 Share price history
17 Risk factors
18 Analyst coverage
19 Analyst forecasts
20 Rating agencies
21 Corporate structure or shareholding structure 4 – Advantages of internet presentation
22 Time series of i nancial data 23 Financial data in processable format
24 Bilingual
25 Internal search engine
26 Recent information update
5 – Direct contacts via email and mailing list
27 Investor relations department email 28 Direct marketing (email alert)
29 Frequently asked questions
30 Online investor information service order 6 – Video/audio recording and online participation in meetings
31 Video/audio recording of meetings 32 Participate in online meetings
33 Conference call for presenting results open to the public
Source: Adapted from Geerings et al. (2003).
3.3 Control Variables
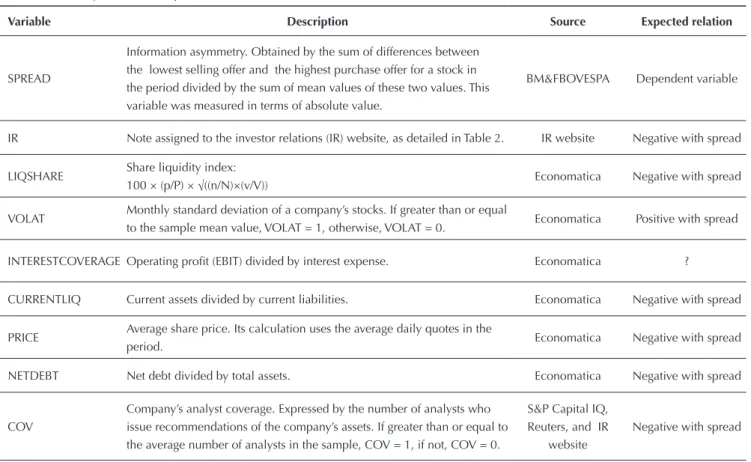
In addition to the variables SPREAD and IR, this study used the control variables described below:
● Analyst coverage (COV) – number of investment
analysts who accompany the company and make forecasts about it. Samples were collected from three separate sources – S&P Capital IQ, on the IR
website, and on the Reuters website (www.reuters.
com) – in a supplementary way, in order to ensure
the highest possible reliability for this variable. If the number of investment analysts that accompany the company is greater than or equal to the
ave-rage number of analysts in the sample, COV = 1, otherwise, COV = 0. A negative relation between information asymmetry and analysts’ coverage is expected because, generating new information, through their recommendations and forecasts, analysts function as information asymmetry redu-cers in the capital market (Healy & Palepu, 2001).
● Volatility (VOLAT) – monthly standard deviation
of a company’s share prices. In the Economatica
database, volatility calculation in n days uses a
series of close prices n + 1 days: d0, d1, d2, d3, ...,
where: di = open day quote of i; I = 1...n; Si =
nepe-rian logarithm of (di/di-1); Sm = mean value of S1,
S2, S3, ..., Sn; PPY = periods per year (PPY = 252,
if daily close; PPY = 52, if weekly close; PPY = 12,
if monthly close; PPY = 4, if quarterly close; PPY =
1, if annual close). VOLAT is regarded as a proxy for information asymmetry since, if the asset value l oated long before issuance, external investors will have less information about a company’s investment risk (Halov & Heider, 2005). If company’s volatility is greater than or equal to the sample mean value, VOLAT = 1, otherwise, VOLAT = 0. A positive
relation between volatility and spread is expected.
● Share price (PRICE) – average share price within
the period investigated. h e presence of
informa-tion asymmetry causes distrust between investors and a reduced turnover, leading to lower liquidity and a drop in a company’s share prices (Verrecchia, 2001; Welker, 1995). Given this, it is expected that
PRICE correlates negatively with spread.
● Internationalization (ADR) – a dummy
indica-tive of company’s participation in the New York Stock Exchange (NYSE) through a Level II or III ADR program. Participation in the international market requires the company to disclose more information in order to meet the requirements of international regulatory bodies, something which
reduces information asymmetry between company
and investors. h erefore, a negative correlation
between ADR and spread is expected.
● Market value (LNVMAR) – the natural logarithm
of market value is used in this paper as a proxy for size.
● Free l oat (FLOAT) – percentage of stocks available
for free trading in the market in relation to the total stocks issued by the company. For companies with more than one stock class, the most liquid share information was used within the period under analysis. A low percentage of free l oat coni gures a strong stockholding concentration, something which might lead the company to provide less information to the public environment, causing an increased information asymmetry. If the per-centage of free l oat is high, managers would be more likely to disclose information, in order to reduce information asymmetry and maintain the
company’s share valuation. h erefore, it is expected
that the percentage of stocks traded in the capital market has a negative relation with information asymmetry.
● Share liquidity index (LIQSHARE) – h e formula
for calculating share liquidity used by the Econo-matica system is given by:
where: n = number of deals with the stock in the
chosen period; v = money volume with the stock
in the chosen period; N = number of deals with all
stocks in the selected period; V = money volume
with all stocks in the chosen period; p = number
of days in which there was at least one deal with
the stock in the chosen period; P = total number of
days in the chosen period. Previous studies found that increased information asymmetry are associa-ted with reduced liquidity of a company’s stocks (Agarwal & O’Hara, 2007; Bharath, Pasquariello & Wu, 2009), suggesting that share liquidity and in-formation asymmetry can be negatively correlated.
● Interest coverage ratio (INTERESTCOVERAGE)
– calculated as the operating proi t (EBIT) divided by interest expense. It represents the company’s i nancial capacity to honor its obligations with creditors.
● Current liquidity (CURRENTLIQ) – current
as-sets divided by current liabilities. It represents the company’s i nancial capacity to honor its short--term obligations.
● Net debt (NETDEBT) – net debt divided by total
assets. h e company’s debt percentage may be
ano-ther cause of information asymmetry. h e greater
Table 3 Summary of the description of variables
Variable Description Source Expected relation
SPREAD
Information asymmetry. Obtained by the sum of differences between the lowest selling offer and the highest purchase offer for a stock in the period divided by the sum of mean values of these two values. This variable was measured in terms of absolute value.
BM&FBOVESPA Dependent variable
IR Note assigned to the investor relations (IR) website, as detailed in Table 2. IRwebsite Negative with spread LIQSHARE Share liquidity index:
100 × (p/P) × √((n/N)×(v/V)) Economatica Negative with spread VOLAT Monthly standard deviation of a company’s stocks. If greater than or equal
to the sample mean value, VOLAT = 1, otherwise, VOLAT = 0. Economatica Positive with spread INTERESTCOVERAGE Operating proi t (EBIT) divided by interest expense. Economatica ?
CURRENTLIQ Current assets divided by current liabilities. Economatica Negative with spread PRICE Average share price. Its calculation uses the average daily quotes in the
period. Economatica Negative with spread
NETDEBT Net debt divided by total assets. Economatica Negative with spread
COV
Company’s analyst coverage. Expressed by the number of analysts who issue recommendations of the company’s assets. If greater than or equal to the average number of analysts in the sample, COV = 1, if not, COV = 0.
S&P Capital IQ, Reuters, and IR
website
Negative with spread
A negative correlation is expected between this variable and information asymmetry.
● New Market (NM) – a variable that represents
the company’s corporate governance quality. If the company belongs to BOVESPA’s New Market diff erential governance level, NM = 1; otherwise, NM = 0.
3.4 Instrumental Variables
Based on the evidence found by Hoff mann et al. (2011), that the IR team’s education inl uences the amount of information provided by the company on its IR website, we used all information about the IR director available in the 2013 and 2014 Reference Form for constructing i ve variables: education in i nance, graduate course in IR, experience in i nance, MA and/or Ph.D. degree, and experience abroad. IR directors with such characteristics are presumed to provide more information to the stock
market by using the company’s IR website. h us, such
variables are assumed to be exogenous, i.e. not correlated with the error term at the second stage of the equation, since they could only inl uence information asymmetry through the IR variable (information available on the
company’s IR website). h e instrumental variables used
are shown below.
● Education in i nance (EDUFIN) – dummy
varia-ble that takes a value equal to 1 if the IR director has a degree in the i nance area (Administration, Accounting, and Economics).
● Graduate certii cate in IR (GRADIR) – dummy
variable that takes a value equal to 1 if the IR di-rector has a graduate degree in IR.
● Experience in i nance (EXPFIN) – dummy variable
that takes a value equal to 1 if the IR director has experience in i nancial institutions.
● MA and Ph.D. (MAPhD) – dummy variable that
takes a value equal to 1 if the IR director has an MA and/or Ph.D. degrees in any area of knowledge.
● Experience abroad (EXPABROAD) – dummy
va-riable that takes a value equal to 1 if the IR director has experience abroad, he may have worked or studied in any country, except Brazil.
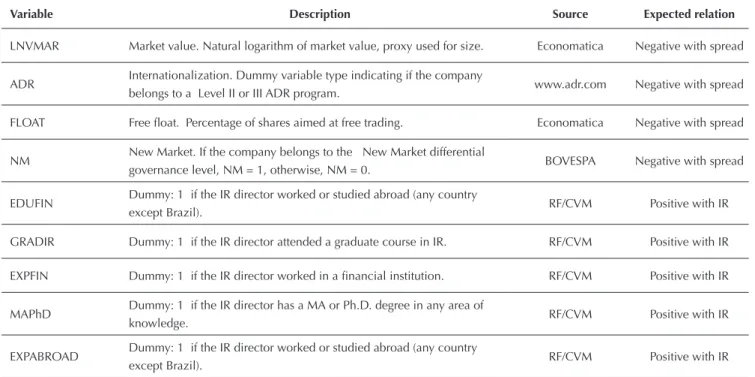
Table 3 displays a summary of the description of variables used in this study, as well as the expected correlation.
Variable Description Source Expected relation
LNVMAR Market value. Natural logarithm of market value, proxy used for size. Economatica Negative with spread ADR Internationalization. Dummy variable type indicating if the company
belongs to a Level II or III ADR program. www.adr.com Negative with spread FLOAT Free l oat. Percentage of shares aimed at free trading. Economatica Negative with spread NM New Market. If the company belongs to the New Market differential
governance level, NM = 1, otherwise, NM = 0. BOVESPA Negative with spread EDUFIN Dummy: 1 if the IR director worked or studied abroad (any country
except Brazil). RF/CVM Positive with IR
GRADIR Dummy: 1 if the IR director attended a graduate course in IR. RF/CVM Positive with IR EXPFIN Dummy: 1 if the IR director worked in a i nancial institution. RF/CVM Positive with IR MAPhD Dummy: 1 if the IR director has a MA or Ph.D. degree in any area of
knowledge. RF/CVM Positive with IR
EXPABROAD Dummy: 1 if the IR director worked or studied abroad (any country
except Brazil). RF/CVM Positive with IR
BM&FBOVESPA = Brazilian Securities, Commodities, and Futures Exchange; CVM = Brazilian Securities and Exchange Commission; RF = Reference Form.
Source: Prepared by the authors.
Table 3 Cont.
3.5 Empirical Model
In order to investigate the relation between information asymmetry and IR, the average spread, in absolute value, was regressed as a function of the explanatory variable IR
website and control variables reported in the literature as likely to inl uence on spread, something which resulted in equation 4:
Spread
i,t= α + β
1IR
i,t+ β
2Cov
i,t+ β
3Volat
i,t+ β
4Price
i,t+ β
5ADR
i,t+ β
6LnVMark
i,t+ β
7FreeFloat
i,t+
β
8LiqShare
i,t+ β
9InterestCoverage
i,t+ β
10CurrentLiq
i,t+ β
11LiqDebt
i,t+ β
12NM
i,t+ ε
i,twhere: IRi,t = score assigned to the IR website, according
to the items detailed in Table 1; Spreadi,t = average
bid-ask spread of i rm i in period t (metrics for information
asymmetry), as detailed in equation 3 (the other variables are dei ned in Table 3).
However, according to Brown and Hillegeist (2007), there is evidence that information dissemination and information asymmetry are endogenously linked, since, if better quality disclosure is able to reduce information asymmetry, i rms with high asymmetry would have More incentives to increase the quality of disclosures in order to reduce information asymmetry.
In these circumstances, when estimating data through ordinary least squares, we have biased and inconsistent estimators for the model parameters. According to Wooldridge (2006), a possible solution to the endogeneity problem is the use of two-stage least squares.
In this way, the two-stage least squares were used with pooled data (pooled 2SLS), in which, at the i rst stage, the endogenous variable is regressed as a function of its instrumental variables, in order to obtain an exogenous measure (equation 6). At the second stage, the model is estimated using the regression value from the i rst
stage to the explanatory variable (equation 5). h us, the
econometric model is represented by:
where: Controls = vector of the control variables as
presented in equation 5 and dei ned in Table 3; ExpAbroadi,t
= dummy variable that takes a value 1 if the IR director
has experience abroad, either for study or work; ExpFini,t
= dummy variable that takes a value 1 if the IR director
has experience in any i nancial institution; EduFini,t =
dummy variable that takes a value 1 if the IR director
has attended a course in the i nance area; MAPhDi,t =
dummy variable that takes a value 1 if the IR director has a MA and/or Ph.D. degree in any area of knowledge;
GRADIRi,t= dummy variable that takes a value 1 if the IR
director has a graduate degree in the IR area; εi,t = residue
of company i in period t.
4. RESULTS
h e factors aff ecting spread were initially investigated
by means of pooled OLS, with a robust standard error,
considering cluster by sector. h e results are found in
the i rst set of results in Table 4. h e second set of results
comes from the pooled 2SLS regression estimated with
robust standard error, considering cluster by sector, in which the variable IR is treated as endogenous. At the bottom of Table 4 there are the partial F statistics and the
partial R2 for the i rst stage of pooled 2SLS and values for
the test by Hausman (1978).
Table 4 Regression results for the relation between investor relations (IR) and information asymmetry
Pooled OLS Pooled2SLS
Dep: spread Fisrt stage Seconde stage
Dep: IR Dep: spread
Coefi cient t Coefi cient t Coefi cient z
IR -0.000991*** -3.00 -0.00296* -1.67
Instruments
Education in i nance -1.219*** -3.80
Experience in i nance 0.227 0.27
Graduate certii cate in IR 2.137** 2.66
MA and Ph.D. 0.381 0.82
Experience abroad -0.263 -0.29
Control variables
Analyst coverage 0.00191 0.65 1.215 1.21 0.00352 0.90
Volatility 0.000248 0.09 -0.128 -0.26 0.0000143 0.00
Price 0.0000629 1.29 0.00514 0.45 0.0000847 1.03
ADR 0.00345 1.26 0.496 0.50 0.00444 1.51
Market value -0.00698*** -4.30 1.137*** 3.61 -0.00405* -1.76
Free l oat -0.0000151 -0.60 0.00613 0.56 0.0000110 0.27
Share liquidity 0.00321* 1.88 -0.391 -1.26 0.00188 1.35
Interest coverage 0.0000157 0.70 0.0116 1.18 0.0000515 1.32
Current liquidity -0.000876 -1.50 -0.0698 -0.55 -0.000889*** -2.84
Net debt -0.00714 -0.91 1.599 1.08 0.000299 0.05
New Market -0.00644** -2.45 2.903** 2.47 0.000225 0.03
Spread
i,t= α + β
1IR
i,t+ β
2Cov
i,t+ β
3Volat
i,t+ β
4Price
i,t+ β
5ADR
i,t+ β
6LnVMark
i,t+ β
7FreeFloat
i,t+
β
8LiqShare
i,t+ β
9InterestCoverage
i,t+ β
10CurrentLiq
i,t+ β
11LiqDebt
i,t+ β
12NM
i,t+ ε
i,tIR
i,t= α + β
1EduFin
i,t+ β
2ExpFin
i,t+ β
3GradIR
i,t+ β
4MAPhD
i,t+ β
5ExpAbroad
i,t+ β
Controls+ ε
i,tCont.
5
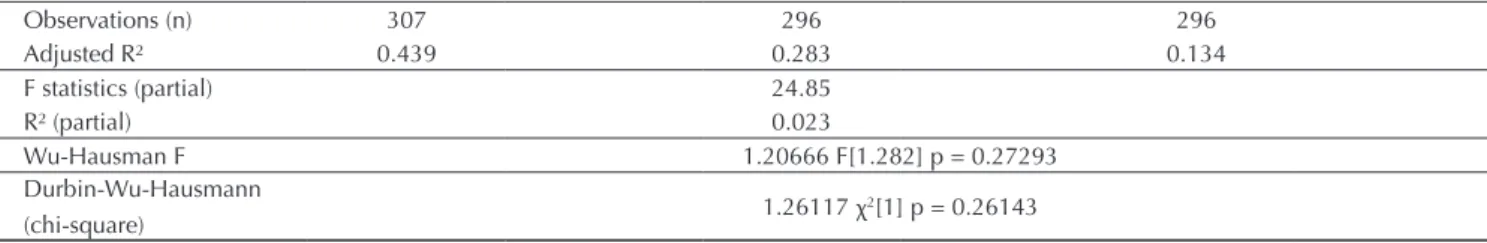
Observations (n) 307 296 296
Adjusted R² 0.439 0.283 0.134
F statistics (partial) 24.85
R² (partial) 0.023
Wu-Hausman F 1.20666 F[1.282] p = 0.27293
Durbin-Wu-Hausmann
(chi-square) 1.26117 χ
2[1] p = 0.26143 ***, **, *: statistical signifi cance of 1%, 5%, and 10%, respectively.
Source: Prepared by the authors.
Table 4 Cont.
h e initial analysis, shown in the i rst column of Table
4, was conducted using pooled OLS regressions and it indicates, as expected, that the variable IR is negatively related with SPREAD at the 1% signii cance level, denoting that companies with IR websites with higher scores have a lower bid-ask spread. A negative relation is also observed, as expected, between the variables MARKET VALUE and NEW MARKET and the variable SPREAD.
Following the recommendations of Lacker and Rusticus (2010), Table 4 also presents the results of i rst-stage estimates, including not only the instruments, but all the second-stage control variables to estimate the
two-stage least-squares (pooled 2SLS). h e results showed
that the instrumental variable graduate certii cate in IR
had a positive and statistically signii cant coeffi cient
at the 5% signii cance level, as expected. However, the variable i nancial education, diff erent from what was expected, had a negative and statistically signii cant sign
at a 1% signii cance level. h e other instrumental variables
(experience abroad, MA/Ph.D. and experience in i nance) did not have a statistical signii cance that justii ed any inference about them.
Also according to Lacker and Rusticus (2010), the simple way to investigate the adequacy of instruments to the model is the analysis of the partial F statistics at the i rst stage of the 2SLS regression. In this way, the partial F analysis must follow that recommended by Stock, Wright
and Yogo (2002). h us, when the number of instruments
is equal to 5, the critical value for F is 15.09. So, F values lower than 15.09 might indicate that the instruments are weak, and this does not occur (partial F: 24.85).
In addition, the test by Hausman (1978) did not have
statistical signii cance to reject the null hypothesis (H0:
regressors are exogenous), reinforcing the view that the
instruments chosen are exogenous, as expected. h erefore,
although the partial R2 is low (2.3%), it is believed, having
results of the tests by Hausman (1978) and Stock et al.
(2002) as a basis, that the instruments are suffi ciently
exogenous and adequate, thus the 2SLS method is preferred instead of the OLS.
Finally, the results from the second stage are displayed in Table 4 and evidence obtained reinforces the previously
obtained results. h e main result is the negative relation
between IR and SPREAD. Consistent with the literature, the quality of online content on IR activities was an explanatory factor of bid-ask spread, with a negative coeffi cient and statistically signii cant at the 10% level. h is result indicates that IR websites with better information contents are inversely related to the company’s information asymmetry measured by bid-ask spread.
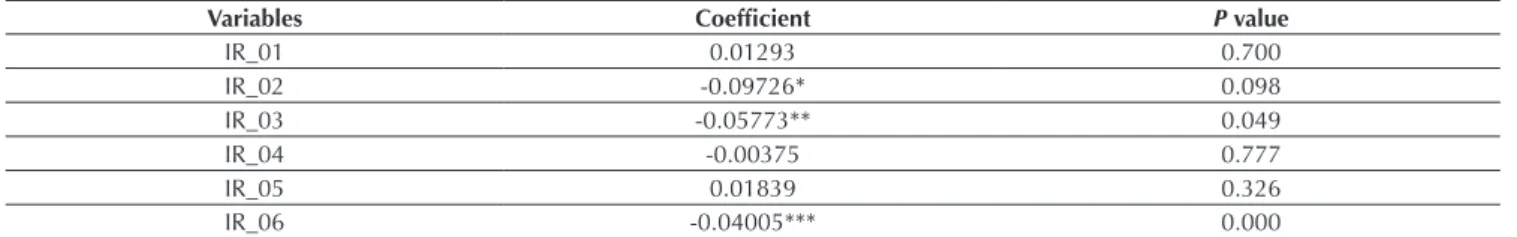
As a supplementary analysis, the individual categories that form the variable IR, as described in Table 2, were regressed through pooled 2SLS in order to verify if there was a diff erence of magnitude between the categories. In this situation, what changes with regard to equations 5
and 6 is only the variable IRi,t, which is now represented as
IRj,i,t, where IRj,i,t is the score assigned to the characteristic
j (as detailed in Table 2, the IR score consists of six
characteristics) from the IR website of company i in year t
and the other variables are dei ned as previously described. h e results for estimated coeffi cients of the variable IRj,i,t
Among the six categories analyzed, the categories of i nancial information (IR_02), press releases, and other i nancial information services (IR_03), and video/audio recording and online participation in meetings (IR_06) were those that showed statistical signii cance, being
negatively related with SPREAD. h is i nding indicates
that IR managers should pay attention to the relevance of
providing additional information on their websites, such as analysts’ forecasts, risk factors, and analyst coverage on equity and company credit rating. A teleconference to present results to the public and information such as conferece calls audio and presentation videos by the company are also relevant.
5. CONCLUSION
h is paper examined the eff ect of IR activities on
information asymmetry. More specii cally, it focused on investigating whether IR activities on the internet can reduce the adverse selection problem deriving from information asymmetry between buyers and sellers of a company’s shares, measured by the bid-ask spread of daily share quotes. To do this, a survey of information disclosed by the companies on their IR websites was carried out, which enabled the formation of a single database on the way how Brazilian companies use the internet to communicate and disseminate their information to stakeholders.
Initially, the analyses were performed considering the pooled OLS estimation to investigate the relation between IR activity in companies and their information asymmetry in the market measured through the bid-ask spread. In order to make the results more robust and because this is a possible endogeneity problem between the variables SPREAD and IR, the pooled 2SLS was used, including the instrumental variables education in i nance, graduate certii cate in IR, experience in i nance, MA and/or Ph.D. degree, and experience abroad.
In general, the results indicate that using the internet to disseminate relevant information to shareholders through the IR website impacts negatively on the bid-ask spread of Brazilian companies, reducing information asymmetry between companies and investors.
Among the six categories that constitute the variable IR, ‘press releases and other i nancial information services’
and ‘video/audio recording and online participation in meetings’ were those that showed statistical signii cance,
being negatively associated with bid-ask spread. h us,
we may say that IR managers must pay attention to the relevance of providing complementary information on their websites. Among the information regarded as more relevant for reducing information asymmetry, we highlight analyst forecasts, description of risk factors, analyst coverage on equity and company credit rating, as well as teleconferences for presentation of results and provision of audio conference calls and presentation videos by the company.
h ese i ndings may be relevant to managers and
regulators, because they indicate that investments in the IR area can generate direct benei ts to shareholders
by reducing uncertainty about share prices. h erefore, we
may say that more informative IR websites improve access to information, something which reduces information asymmetry in the capital market. Taken together, these results provide a strong incentive so that listed companies make information available to stakeholders on well-structured IR websites of their own.
Further research can go deeper into the approach of this study by investigating the eff ects of IR activities on information asymmetry, analyzing, for instance, the information content of specii c events, such as conference calls or meetings with investors.
Finally, the results of this paper are useful for listed companies’ decision-making between developing and
Table 5 Results for information category using the pooled 2SLS method
Variables Coefi cient P value
IR_01 0.01293 0.700
IR_02 -0.09726* 0.098
IR_03 -0.05773** 0.049
IR_04 -0.00375 0.777
IR_05 0.01839 0.326
IR_06 -0.04005*** 0.000
***, **, *: Statistical signifi cance of 1%, 5%, and 10%, respectively.
maintaining (or not) online voluntary information disclosure environments, contributing to enrich discussions about the eff ect of IR activities on information
asymmetry, in an emerging market such as the Brazilian one, therefore diff erent from those previously analyzed.
REFERENCES
Agarwal, P., & O’Hara, M. (2007). Information risk and capital structure [Working Paper]. Social Science Research Network.
Retrieved from http://papers.ssrn.com.
Agarwal, V., Liao, A., Nash, E. A, Taffl er, R. J., & Taffl er, R. (2008). h e impact of eff ective investor relations on market value [Working Paper]. Social Science Research Network.
Retrieved from http://papers.ssrn.com.
Aitken, M., & Frino, A. (1996). h e accuracy of the tick test: evidence from the Australian stock exchange. Journal of Banking & Finance, 20(10), 1715-1729.
Akerlof, G. (1970). h e market for “lemons”: quality uncertainty and the market mechanism. Th e Quarterly Journal of Economics, 84(3), 488-500.
Bank of New York Mellon. (2015). Tendências globais em relações com investidores 2013: uma análise da pesquisa de práticas de RI no Brasil. Retrieved from https://www.adrbnymellon.com/ i les/pb43842.pdf.
Basuony, M. A. K., & Mohamed, E. K. A. (2014). Determinants of internet i nancial disclosure in GCC countries. Asian Journal of Finance & Accounting, 6(1), 70-89.
Bharath, S. T., Pasquariello, P., & Wu, G. (2009). Does asymmetric information drive capital structure decisions? Review of Financial Studies, 22(8), 3211-3243.
Blankespoor, E., Miller, G. S., & White, H. D. (2014). h e role of dissemination in market liquidity: evidence from i rms’ use of Twitter™. Th e Accounting Review, 89(1), 79-112.
Bollen, L., Hassink, H., & Bozic, G. (2006). Measuring and explaining the quality of internet investor relations activities: a multinational empirical analysis. International Journal of Accounting Information Systems, 7(4), 273-298.
Brennan, M. J., & Tamarowski, C. (2000). Investor relations, liquidity, and stock prices. Journal of Applied Corporate Finance, 12(4), 26-37.
Brown, S., & Hillegeist, S. A. (2007). How disclosure quality aff ects the level of information asymmetry. Review of Accounting Studies, 12(2-3), 443-477.
Bushee, B, Miller, G. (2012). Investor relations, i rm visibility, and investor following. Th e Accounting Review,87(3), 867- 897. Chakravarty, S., & Sarkar, A. (1999). Liquidity in US i xed income
markets: a comparison of the bid-ask spread in corporate, government and municipal bond markets. FRB of New York Staff Report, (73).
Chang, M., D’anna G., Watson, I., & Wee, M. (2008). Does disclosure quality via investor relations aff ect information asymmetry? Australian Journal of Management, 33(2), 375-390.
Chang, M., Hooi, L., & Wee, M. (2014). How does investor relations disclosure aff ect analysts’ forecasts? Accounting & Finance, 54(2), 365-391.
Copeland, T. E. (1979). Liquidity changes following stock splits. Th e Journal of Finance, 34(1), 115-141.
Copeland, T. E., & Galai, D. (1983). Information eff ects on the bid-ask spread. Th e Journal of Finance, 38(5), 1457-1469. Deller, D., Stubenrath, M., & Weber, C. A. (1999). Survey on the
use of the internet for investor relations in the USA, the UK and Germany. European Accounting Review, 8, 351-364. Demsetz, H. (1968). h e cost of transacting. Th e Quaterly Journal
of Economics, 82, 33-53.
Dolphin, R. R. (2004). h e strategic role of investor relations.
Corporate Communications: An International Journal, 9(1), 25-42.
Ernst & Young. (2013). Tomorrow’s investment rules: global survey of institutional investors on non-fi nancial performance. Retrieved from http://www.ey.com/Publication/vwLUAssets/ EY-Institutional-Investor-Survey/$File/EY-Institutional-Investor-Survey.pdf.
Ferreira, A. D. (2012). O impacto do custo de transação ao obter informações contábil-fi nanceiras sobre o valor de mercado das empresas brasileiras (Master’s Degree). Fundação Capixaba de Pesquisa em Administração, Ciências Contábeis e Economia, Vitória.
Fleming, M. J. (1997). h e round-the-clock market for US treasury securities. Economic Policy Review, 3(2), pp. 24. Fleming, M. J. (2003). Measuring treasury market liquidity.
Economic Policy Review, 9(3), pp. 57.
Fleming, M. J., & Sarkar, A. (1999). Liquidity in U.S. treasury spot and futures markets quality [Working Paper]. Federal Reserve Bank of New York. Retrieved from http://www.bis.org/publ/ cgfs11l em.pdf.
Garay, U., González, M., Guzmán, A., & Trujillo, M. A. (2013). Internet-based corporate disclosure and market value: evidence from Latin America. Emerging Markets Review, 17, 150-168.
Geerings, J., Bollen, L. H. H., & Hassink, H. F. D. (2003). Investor relations on the internet: a survey of the Euronext zone.
European Accounting Review, 12(3), 567-579.
Girão, L. F. A. P., & Machado, M. R. (2013). A produção cientíi ca sobre assimetria informacional em periódicos internacionais de contabilidade. Revista Contabilidade e Controladoria, 5(1), 99-119.
Glosten, L. R., & Milgrom, P. R. (1985). Bid, ask and transaction prices in a specialist market with heterogeneously informed traders. Journal of Financial Economics, 14(1), 71-100. Glosten, L. R. (1987). Components of the bid-ask spread and the
statistical properties of transaction prices. Journal of Finance,
47, 1293-1307.
Halov, N., & Heider, F. (2005). Capital structure, asymmetric information and risk [Working Paper]. Social Science Research Network. Retrieved from http://papers.ssrn.com.
Hausman, J. A. (1978). Specii cation tests in econometrics.
Econometrica, 46, 1251-1271.
Healy, P. M., & Palepu, K. G. (2001). Information asymmetry, corporate disclosure, and the capital markets: a review of the empirical disclosure literature. Journal of Accounting and Economics, 31(1), 405-440.
Healy, P. M., Hutton, A. P., & Palepu, K. G. (1999). Stock performance and intermediation changes surrounding sustained increases in disclosure. Contemporary Accounting Research, 16(3), 485-520.
Hedlin, P. (1999). h e internet as a vehicle for investor relations: the Swedish case. European Accounting Review, 8(2), 373-381. Hel in, F., Shaw, K., & Wild, J. (2005). Disclosure policy and
market liquidity: impact of depth quotes and order sizes.
Contemporary Accounting Research, 22, 829-866. Hoff mann, A. O., Tutic, A., & Wies, S. (2011). h e role of
educational diversity in investor relations. Corporate Communications: An International Journal, 16(4), 311-327. Instituto Brasileiro de Relações com Investidores, & Fundação Instituto de Pesquisas Contábeis, Atuariais e Financeiras. (2015). 7ª Pesquisa IBRI-Fipecafi sobre o perfi l do profi ssional e da área de relações com investidores. Retrieved from http:// www.ibri.com.br/Upload/Arquivos/enquete/3756_7_
Pesquisa_Sobre_Proi ssional_RI.pdf.
Instituto Brasileiro de Relações com Investidores. (2008). Novo guia de relações com investidores. Retrieved from http://www. ibri.com.br.
Jensen, M. C., & Meckling, W. H. (1976). h eory of the i rm: managerial behavior, agency costs and ownership structure.
Journal of Financial Economics, 3(4), 305-360.
Kirk, M. P., & Vincent, J. D. (2014). Professional investor relations within the i rm. Th e Accounting Review, 89(4), 1421-1452. Larcker, D. F., & Rusticus, T. O. (2010). On the use of instrumental
variables in accounting research. Journal of Accounting and Economics, 49(3), 186-205.
Lee, C. M., Mucklow, B., & Ready, M. J. (1993). Spreads, depths, and the impact of earnings information: an intraday analysis.
Review of Financial Studies, 6(2), 345-374.
Lundholm, R. J., Rogo, R., & Zhang, J. L. (2014). Restoring the tower of Babel: how foreign i rms communicate with US investors. Th e Accounting Review, 89(4), 1453-1485. Marston, C. (1996). h e organization of the investor relations
function by large UK quoted companies. Omega, 24(4), 477-488.
McInish, T. H., & Wood, R. A. (1992). An analysis of intraday patterns in bid/ask spreads for NYSE stocks. Th e Journal of Finance, 47(2), 753-764.
Mendes-da-Silva, W., & Magalhães, P. A., Filho (2005). Os determinantes da disseminação voluntária de informações i nanceiras na internet. RAE eletrônica – Revista de Administração de Empresas, 4(2), 1-23.
Mendes-da-Silva, W., & Onusic, L. M. (2014). Corporate e-disclosure determinants: evidence from the Brazilian market. International Journal of Disclosure and Governance,
11(1), 54-73.
Mendes-da-Silva, W., Ferraz-Andrade, J. M., Famá, R., & Maluf, J. A., Filho (2009). Disclosure via website corporativo: um exame de informações i nanceiras e de governança no mercado brasileiro. RAE – Revista de Administração de Empresas, 49(2), 190-205.
Stock, J. H., Wright, J. H., & Yogo, M. (2002). A survey of weak instruments and weak identii cation in generalized method of moments. Journal of Business & Economic Statistics, 20(4), 518-529.
Stoll, H. R. (1989). Inferring the components of the bid-ask spread: theory and empirical tests. Journal of Finance, 44(1), 115-134.
Verrecchia, R. (2001). Essays on disclosure. Journal of Accounting and Economics, 22(1), 97-180.
Welker, M. (1995). Disclosure policy, information asymmetry, and liquidity in equity markets. Contemporary Accounting Research, 11(2), 801-827.
Wooldridge, J. M. (2006). Introdução à econometria: uma abordagem moderna (4a. ed.). São Paulo, SP: Pioneira h omson Learning.
Yoon, H., Zo, H., & Ciganek, A. P. (2011). Does XBRL adoption reduce information asymmetry? Journal of Business Research,
6(2), 157-163.
Correspondence address:
Sandrielem da Silva Rodrigues
Universidade Federal do Rio Grande do Sul, Escola de Administração, Programa de Pós-Graduação em Administração Rua Washington Luiz, 855 – CEP: 90010-460