DOI: 10.1590/1808-057x201703250
Efects of the audit committee and the iscal council on earnings
quality in Brazil*
Vitor Gomes Baioco
Universidade Federal do Espírito Santo, Centro de Ciências Jurídicas e Econômicas, Departamento de Ciências Contábeis, Vitória, ES, Brazil
José Elias Feres de Almeida
Universidade Federal do Espírito Santo, Centro de Ciências Jurídicas e Econômicas, Departamento de Ciências Contábeis, Vitória, ES, Brazil
Received on 02.23.2016 – Desk acceptance on 03.26.2016 – 3rd version approved on 11.21.2016
ABSTRACT
his study evaluates the efects of the audit committee and the iscal council with their diferent characteristics on earnings quality in Brazil. he proxies of earnings quality used are: relevance of accounting information, timeliness, and conditional conservatism. he sample consists of Brazilian companies listed on the Brazilian Securities, Commodities, and Futures Exchange (BM&FBOVESPA) with annual liquidity above 0.001 within the period from 2010 to 2013. Data were collected from the database Comdinheiro and the Reference Forms of companies available on the website of the Brazilian Securities and Exchange Commission (CVM) or the BM&FBOVESPA. he samples used in the study totaled 718, 688, and 722 observations for the value relevance, timeliness, and conditional conservatism models, respectively. he results indicate that diferent arrangements of the iscal council and the existence of the audit committee diferently impact the accounting information properties. he presence of the iscal council positively impacted the relevance of equity, while the presence of the audit committee, the relevance of earnings. Conditional conservatism is evidenced in the group of companies with a permanent iscal council, demonstrating that it is signiicant as a governance mechanism, rather than the installation for temporary operation when asked by shareholders in an ordinary general meeting. he presence of both showed signiicant earnings for the market, but they were not timely, something which exposes restriction to the relevance found. Lastly, the powered iscal council showed a positive association only concerning the relevance of equity.
1. INTRODUCTION
h e quality of accounting i gures is intrinsically linked to the quality of corporate governance (Sloan, 2001). Accounting provides information, among other aspects, concerning executives’ performance that are needed by most corporate governance mechanisms to ef ectively operate in addressing agency problems (Bushman & Smith, 2001; Sloan, 2001).
Previous studies have shown that the board of directors and its structure and composition, as well as that of its committees, af ect the quality of accounting i gures, indicating that good corporate governance practices benei t shareholders (Trapp, 2009; Vafeas, 2000; Xie, Davidson & Dadalt, 2003). In addition, the ef orts to grasp the function of the audit committee, an advisory body of the board of directors directly responsible for the supervision of accounting processes (Instituto Brasileiro de Governança Corporativa [IBGC], 2009, 2010; U.S. Government, 2002) have also increased.
Brazil has a characteristic different from other countries due to the potential presence of the i scal council in companies, according to Law 6,404/1976, the so-called Brazilian Corporate Law (Brasil, 1976). It is a body that can be set up and have its members elected at a shareholders’ general meeting as an instrument to inspect the managers’ acts. Among its functions, the i scal council is responsible for examining and commenting on the i nancial statements audited by an external auditor (Brasil, 1976; IBGC, 2010).
In the Brazilian environment, we may ponder that both the board of directors and its committees and the i scal council have functions that aim at reducing information asymmetry, something which can improve the quality of information disclosed to the market, in addition to provide more effi cient monitoring of executives. h ese bodies can contribute to reduce the agency conl icts highlighted by Jensen and Meckling (1976).
Studies such as Ahmed and Henry (2012), Baxter and Cotter (2009), and Wild (1996) have provided evidence that the audit committee improves the quality of accounting i gures. In Brazil, Trapp (2009) argues that the i scal council is related to lower levels of earnings management.
In this way, investigating and understanding the relation between functions of the i scal council and the audit committee and earnings quality has proved to be a research opportunity poorly addressed by literature and convenient to the Brazilian environment. Also, the Securities and Exchange Commission (SEC), as a
consequence of the Sarbanes-Oxley Act (SOX) (U.S. Government, 2002), which provided for mandatory implementation of an audit committee, authorized the Brazilian companies holding American Depositary Receipts (ADRs) listed on the New York Stock Exchange (NYSE) to structure corporate governance, considering the i scal council with an overlap to the audit committee, i.e. it is up to the i scal council to adapt, also taking the functions of this committee, becoming the so-called ‘powered i scal council.’
The audit committee and the fiscal council have common functions related to the generation and reporting of accounting information, but they are dif erent in many ways, emerging discussions about the establishment of one or the other. h e same applies to the implementation of the powered i scal council (Furuta & Santos, 2010; PricewaterhouseCoopers [PwC], 2007).
h e two bodies should not be regarded as mutually excluding, since their functions, responsibilities, hierarchy, and composition are dif erent. First, they occupy dif erent hierarchical positions in the organization: the audit committee is subordinate to the board of directors, preferably formed by independent representatives of this, while the i scal council is autonomous and not linked to any management body, it consists of shareholders’ representatives. In this way, the independence rules are also dif erent from each other; regarding the functions and competences, the audit committee is delegated with activities specii c to the ‘management’ function, and the i scal council is an institutional tool of the shareholders’ right to exert control over management (Furuta & Santos, 2010; PwC, 2007). In this way, adopting the two bodies in the same organization could contribute to greater transparency in managers’ actions and better corporate governance practices (Santos, 2009).
Thus, considering the corporate governance environment in the Brazilian capital market, this study investigates the following research question: what are the ef ects of the audit committee and the i scal council on earnings quality of public companies listed on the BM&FBOVESPA?
adopted, according to Almeida (2010), Barth, Landsman and Lang (2008), and Lopes and Walker (2008).
h e contribution of this research lies on the fact that there is an extensive international literature on earnings quality and its relation with corporate governance mechanisms, unlike the Brazilian reality. Also, the Brazilian literature is incipient to consolidate the understanding of the relation between the audit committee and the i scal council with i nancial statement quality. Finally, this research brings as a dif erential feature to the international literature the inclusion of the i scal council as a mechanism of corporate governance and its interactions with earnings quality.
h e results indicate dif erent ef ects of the bodies under analysis on earnings quality proxies. h e i scal council, in general, either permanent or temporary, has positive association with the book value relevance and the audit committee with net income. At the same
time, the results for companies that have permanently installed i scal councils show that both the relevance of equity and net income is increased, as well as the timely recognition of economic losses (conditional conservatism), demonstrating the importance of permanent installation of the i scal council to control i nancial report. h e i rms with a powered i scal council showed relevance only for equity among all the earnings quality metrics used, something which contributes to the existing discussion between scholars and professionals about the loss of focus on the attributions of this body: for instance, PwC (2007).
This study is divided, after this Introduction, as follows: 2. h eoretical framework and development of hypotheses; 3. Methodology, where models’ details, sample development, and estimators are presented; 4. Analysis of results by each model and their variations; 5. Robustness analysis; and 6. Final remarks.
2. THEORETICAL FRAMEWORK AND DEVELOPMENT OF HYPOTHESES
Bushman and Smith (2001) argue that corporate governance mechanisms are the means by which controlling agents are disciplined to act in accordance with investors’ interests. Accounting is a part of the set of corporate governance mechanisms, as it promotes greater transparency regarding the i nancial performance of i rms within a period and the dissemination of this information aims to reduce information asymmetry and agency problems (Bushman, Chen, Engel & Smith, 2004).
h ere is no precise and fully reliable metric in the literature to measure earnings quality, as discussed by Dechow, Ge and Schrand (2010), but researchers have developed over the years several models that seek to capture dif erent properties of accounting i gures.
Almeida (2010), Barth et al. (2008), and Lopes and Walker (2008) used similar properties to measure earnings quality, such as relevance, timeliness, and conditional conservatism, the same used in this study.
2.1 Audit Committee
The audit committee is an advisory body of the board of directors consisting, preferably, of independent board members. It assures to the board of directors the control over earnings quality and internal controls, and it is regarded as an essential mechanism in corporate governance (IBGC, 2009).
h e concept of audit committee is not new. Since
recommend setting up audit committees as a response to the case McKesson and Robbins in the late 1930s. In subsequent years, the number of companies with established committees signii cantly increased and the U.S. Congress, the SEC, accountants, and others expressed interest and support for this body (Birkett, 1986).
h e NYSE and National Association of Securities Dealers Automated Quotations (NASDAQ) established, in 1978 and 1989, respectively, as requirements for listing on their stock exchanges, the establishment of an audit committee consisting of fully independent members. In 1999, they jointly developed the Blue Ribbon Committee on Improving the Ef ectiveness of Corporate Audit Committees, with the purpose of making recommendations on the composition and operation of audit committees, subsequently adopted by the SEC.
h e audit committee gained prominence worldwide at er the U.S. scandals, mainly involving Enron and WorldCom, which prompted the SOX enactment by the U.S. Congress, in July 2002. h e SOX introduced corporate governance rules, among others, aiming to ensure greater transparency to i nancial reporting by the companies, also instituting mandatory establishment of this committee.
of Brazil (BACEN), and the National Council of Private Insurance (CNSP).
Accordingly, the audit committee has the function of inspecting the i nancial reporting process (internal process management and integrity and ef ectiveness of internal controls) and internal and external audit, including the resolution of conl icts between executives and auditor.
h e committee ensures the integrity and timeliness of financial information, as well as the interests of shareholders and other stakeholders (IBGC, 2010; U.S. Government, 2002). h erefore, its activities are closely related to the i nancial reporting quality (Klein, 2002; He, Labelle, Piot & h ornton, 2009).
In Brazil, research addressing the inl uence of an audit committee as a governance mechanism on earnings quality is incipient, we may highlight Cunha, Hillesheim, Faveri and Rodrigues (2014) and Filipin (2012).
Cunha et al. (2014) investigated whether characteristics of the audit committee (size, expertise, and independence) rel ect on earnings management by Brazilian public companies listed on the BM&FBOVESPA and they concluded that none of the characteristics under study impacted on earnings management.
Using a portfolio of proxies to measure earnings quality, as in this study, Filipin (2012) sought to verify whether companies with an audit committee listed on the BM&FBOVESPA have better earnings quality; the results for these companies suggested greater relevance of accounting information, but less conservative and persistent net income.
h e international literature is extensive and the authors generally share the same hypothesis about improving i nancial reporting quality (Chtourou, Bédard & Courteu, 2001; Felo, Krishnamurthy & Solieri, 2003; Xie et al., 2003).
Before the audit committee became mandatory in the United States of America (USA), Dechow, Sloan and Sweeney (1996) found evidence that companies that manage their earnings were less likely to have this committee installed than other i rms. Wild (1996) noticed the reaction of the U.S. market to the release of i nancial statements before and after the establishment of an audit committee and found that the market reaction to disclosure of i nancial statements at er the establishment of a committee is greater than in previous periods.
Ahmed and Henry (2012) and Baxter and Cotter (2009) investigated, in Australian companies, whether voluntary installation of the audit committee impacted the earnings quality. Baxter and Cotter (2009) found evidence of reduced earnings management practices, while Ahmed and Henry (2012) showed a positive impact
on unconditional conservatism and a negative impact on conditional conservatism. In this context, the i rst research hypothesis on the presence of an audit committee in companies listed on the BM&FBOVESPA is presented:
H1: the audit committee enhances the i nancial reporting quality.
2.2 Fiscal Council
In Brazil, the i scal council is an organ provided for in Law 6,404/1976 (Brasil, 1976) and the company’s statute will provide for its operation, which may be permanent or installed by the general meeting at shareholders’ request. When installed, it must consist of at least 3 and at most 5 members and substitutes in equal numbers, shareholders or not (Brasil, 1976).
h e i scal council is a body independent from the company’s board and executives and its competences are set in article 163 of Law 6,404/1976 (Brasil, 1976), i.e. it reports directly to the shareholders at the meetings. h is body inspects the actions taken by the company’s board and board of directors, comments on proposals by administration bodies, as well as it examines and comments on the i nancial statements audited by the external audit, seeking to preserve shareholders’ rights.
Both the IBGC, from a professional perspective, and scholars (Carvalhal-da-Silva & Leal, 2005; Tinoco, Escuder & Yoshitake, 2011; Trapp, 2009), regard the i scal council as a part of the corporate governance system in Brazil. h e fact that the i scal council is a direct representative of shareholders inspecting executives’ management can have a great inl uence on the reduction of agency conl ict and informational asymmetry, something which makes it a signii cant control mechanism. Also, Tinoco et al. (2011) claim that the i scal council collaborates with those who are far from control and power (especially minority shareholders).
Trapp (2009) sought to evaluate the direct intersection of a i scal council as a good corporate governance practice to reduce earnings management. Evidence indicates that these factors, considering the existence and qualii cation of the members of a i scal council, are related to lower levels of discretionary accruals.
power from this mechanism in the corporate governance system, mainly by increasing earnings quality.
In this context, the second research hypothesis on the presence of a i scal council in companies listed on the BM&FBOVESPA is presented:
H2: the i scal council enhances earnings quality.
Additionally, to analyze the second hypothesis, we investigate on a methodological basis the various i scal council arrangements (permanent and temporary).
2.3 Powered Fiscal Council
An imposition of the SOX was mandatory installation of the audit committee in companies listed on all the U.S. stock exchanges, something which also af ected foreign companies that issue ADRs in the U.S. market (Furuta & Santos, 2010). In the Brazilian case, at er an agreement between the Brazilian Securities and Exchange Commission (CVM) and the SEC, in 2003, mandatory installation of the audit committee was abolished if the company used the i scal council, adapting it to the functions of a committee, so that the i scal council incorporates new responsibilities and functions (hereat er, powered i scal council).
According to the IBGC (2009), considering the legal attributions of the i scal council provided for in Law 6,404/1976 (Brasil, 1976), the possibility that this body takes any administration activity is excluded. h e creation of a powered i scal council does not contradict this understanding, since the i scal council is careful not to act as an advisor or assessor concerning management decisions. Accordingly, certain activities that cannot be delegated by the board of directors or executives, such as hiring audit and ‘non-audit’ services, should not be assigned to the i scal council, since they are provided for by article 142 of Law 6,404/1976 (Brasil, 1976) as duties of the board of directors.
PwC (2007) discusses the strengths and weaknesses of adopting a powered i scal council. According to this study,
opponents argue that the i scal council is an institutional tool to exert shareholders’ inspection does not serve the purpose of the audit committee to be a management instrument of the board of directors. In addition, the i scal council has functions and duties dif erent from those predicted for the audit committee, such as providing opinions on proposals to change company’s capital, issue debentures, investment plans, or capital budgets, among others, something which can lead to loss of focus on specii c attributions of the audit committee.
According to Santos (2009), many Brazilian companies that issue ADRs still prefer to strictly comply with the SOX requirements and not install the powered i scal council; this is most likely due to a market-driven and strategic issue of making their stocks available in the U.S. market, since the acquirer of these stocks is more familiar with the audit committee than with any other type of monitoring body. However, Calazans (2003) highlights that the constitution of an audit committee in Brazilian companies might increase their cost and this additional cost can ot en be higher than the benei t generated.
Furuta and Santos (2010) investigated the perspective of executives from companies operating in Brazil and issuing ADRs and that of market analysts concerning the formation of an audit committee or a powered i scal council. h e results indicated there was no consensus of opinion that the i scal council is more adaptable than the audit committee to the Brazilian business environment if the functions of these bodies are dif erent and if the costs associated with committee formation are relevant.
It is assumed, then, that the i scal council improves earnings quality, since it absorbs, in addition to the legal functions of the i scal council, the functions of the audit committee, expanding its scope of action. Also, companies with a powered i scal council are listed on the U.S. stock exchanges, something which indicates greater rigor in corporate governance. h us, the third research hypothesis is presented:
2.4 Audit Committee and Fiscal Council
h e i scal council and the audit committee occupy dif erent hierarchical positions in the organization: the second is subordinate to the board of directors, preferably consisting of independent members, while the i rst is set up by the general meeting, a body which represents controlling shareholders and minority shareholders. Unlike the committee, the i scal council is autonomous and is not linked to any organization’s body, and it must report to the shareholders directly at the meetings.
h e bodies also have dif erences in their functions and duties. Audit committees are delegated with activities inherent to the ‘management’ function, i.e. it is an advisory mechanism made available to the board of directors to fuli ll its tasks. Among the legal attributions of the i scal council, the possibility of exercising any activity inherent to management is excluded. h e council activities are carried out according to the role of wide and unrestricted inspection of managers’ legal and statutory duties, at shareholders’ request, as a decision of the general meeting. In this way, it is an institutional mechanism to exert the shareholders’ right of control on the executive’s decision (IBGC, 2009; PwC, 2007).
Among the dif erences between these bodies that may directly interfere with accounting information,
we highlight the fact that the functions of an audit committee are more specii c and focused on the i nancial reporting process, unlike the i scal council, which besides recommending whether the i nancial statements can be approved also inspects the managers’ acts.
Each body has its function in the hypothesis of enhancing i nancial reporting quality, either advising the board of directors (audit committee) or inspecting and reporting to the shareholders (i scal council). In this way, the acceptance of both bodies in the same organization refers to the reasoning that they are not mutually excluding. h is trend might lead to greater transparency of managers’ actions and adoption of better corporate governance practices, since a large number of views on control coexisting in the same environment could contribute to ensure continuity in the organization, regardless of individual or group interests (Santos, 2009).
Based on the assumption that better corporate governance practices in the organization improve the quality of i nancial reporting, it is expected that adopting the two bodies has a positive impact on this relation. h us, the fourth research hypothesis is:
H4: the presence of the audit committee and the i scal council, simultaneously, enhances earnings quality.
3. METHODOLOGY
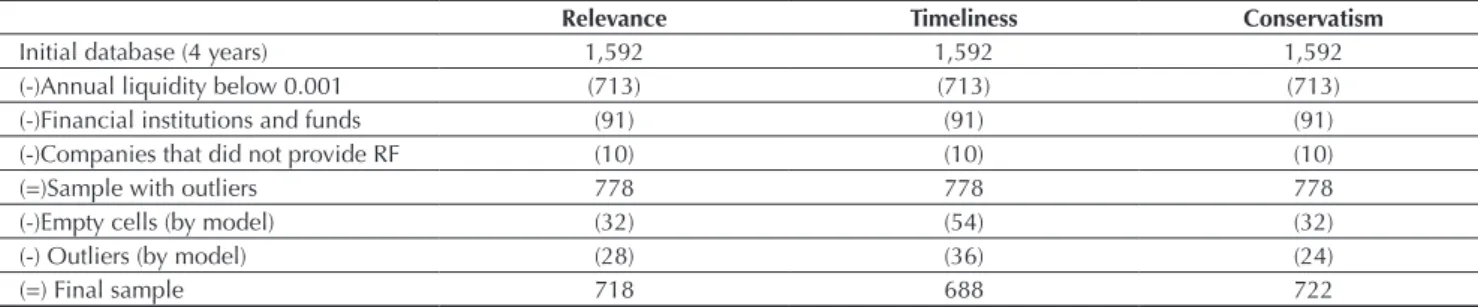
The study population comprises active publicly-traded corporations listed on the BM&FBOVESPA that have data available for the period within 2010 and 2013. To start constructing the sample, only companies with annual liquidity above 0.001 were selected. Financial institutions and funds were excluded from the sample, because they have a specii c accounting standard and regulation. Observations with empty cells, with values equal to 0, and errors in the variables of interest of each model, as well as the companies that did not provide the Reference Form, were also excluded.
h e accounting and market data were obtained from the database Comdinheiro. Information on the i scal
council and the audit committee was obtained from the company Reference Forms, available at the websites of the BM&FBOVESPA and the CVM.
Earnings quality models were estimated using the ordinary least squares (OLS) method, with robust standard errors clustered by i rm. h is estimation method has been widely used in accounting and i nance studies (Almeida, 2010; Giroud & Mueller, 2010; Lopes & Walker, 2008).
Table 1 Sample selection
Relevance Timeliness Conservatism
Initial database (4 years) 1,592 1,592 1,592
(-)Annual liquidity below 0.001 (713) (713) (713)
(-)Financial institutions and funds (91) (91) (91)
(-)Companies that did not provide RF (10) (10) (10)
(=)Sample with outliers 778 778 778
(-)Empty cells (by model) (32) (54) (32)
(-) Outliers(by model) (28) (36) (24)
(=) Final sample 718 688 722
RF = Company Reference Forms.
Source: Prepared by the authors.
Since there is no single way to measure earnings quality, this study was based on the metrics used by Lopes and Walker (2008), which capture earnings quality, based on its properties, among them relevance, timeliness, and conditional conservatism. It is believed, therefore, that more relevant accounting i gures, greater timely loss recognition (bad news), and more timely information correspond to better i nancial reporting process.
h e model that tests the value relevance considers the information content of net income and book value as a
function of share price.
h is study evaluates the ef ect of the existence of a i scal council in Brazilian companies and its variations: general i scal council (when it exists, either on a permanent or temporary basis), permanent, temporary, or powered i scal council, audit committee, of both organs simultaneously and one or the other on relevance. All these combinations are controlled by dummy variables in alternate models. To do this, model 1 was prepared, which has dummy variables and control variables (CV), as follows:
R
i,t= β
0+
β
1.NI
i,t+ β
2.ΔNI
i,t+ β
3.C
n+ β
4.NI
i,t*C
n+ β
5. ΔNI
i,t*C
n+ ∑ .β
n.Control + ε
i,t where: Pi,t is the share price of company i in year t adjustedby dividends and splits (four months at er the end of the year) and scaled by share price in t-1, NIi,t is earnings per share of company i in year t scaled by share price in
t-1, BVi,t is equity per share of company i in year t, scaled by share price in t-1i, Cn is the variable that takes value 1 for FCn, AC, ACFC or ACOFC [where: FCn = dummy variable if i rm i has a general i scal council installed (FC1), a permanent i scal council (FC2), or a powered i scal council (FC3); AC = dummy variable if i rm i has an audit committee installed; ACFC = dummy variable if i rm i has both, i scal council and audit committee installed; ACOFC = dummy variable if i rm i has a i scal
council or an audit committee installed] in each dummy, otherwise it is considered as 0.
h e CVs used in this research were i rm size (S), leverage (LEV), and growth opportunity (GRO) measured by the natural logarithm of total assets, total debt divided by total assets, and percentage growth of net revenues, respectively.
Lopes (2009) states that net income can inl uence price over a long period of time. h us, the model to test timeliness aims at revealing whether net income and its variation can explain stock return. Model 2 is presented below, it has been developed in this research, which sought to identify the ef ect on timeliness.
P
i,t= β
0+
β
1.NI
i,t+ β
2.BV
i,t+ β
3.C
n+ β
4.NI
i,t*C
n+ β
5.BV
i,t*C
n+∑ .β
1n n.Control + ε
i,tn 1
1
where: Ri,t is return on (the most liquid class) share of company i in year t adjusted by dividends and splits (four months at er the end of the year) and scaled by share price in t-1, NIi,t is earnings per share of company i in year t
and scaled by share price in t-1, and ΔBVi,t are changes in net income per share of company i in year t and scaled by share price in t-1 (Cn according to model 1).
h e conditional conservatism model used is that developed by Basu (1997). h e model is based on the concept that net income is, in its nature, conservative in a conditional sense (asymmetric recognition between losses and gains) and it anticipates bad news in relation to good news. h e model relates net income to stock return. Model 3 is presented below:
where: NIi,t is the earnings per share of company i in year t, scaled by share price at t-1, Di,t is the dummy for return, i.e. 1 for negative return and 0 for positive return of company
i in year t, and Ri,t is return on share (the most liquid share class) of company i in year t adjusted by dividends and splits (four months at er the end of the year) and scaled by share price at t-1 (Cn according to model 1).
It is expected that the coeffi cients of variables of interest from interactions with variables related to the existence of the i scal council, audit committee, both of them, one or the other, permanent i scal council and powered i scal council are positive and statistically signii cant in all models.
4. ANALYSIS OF RESULTS
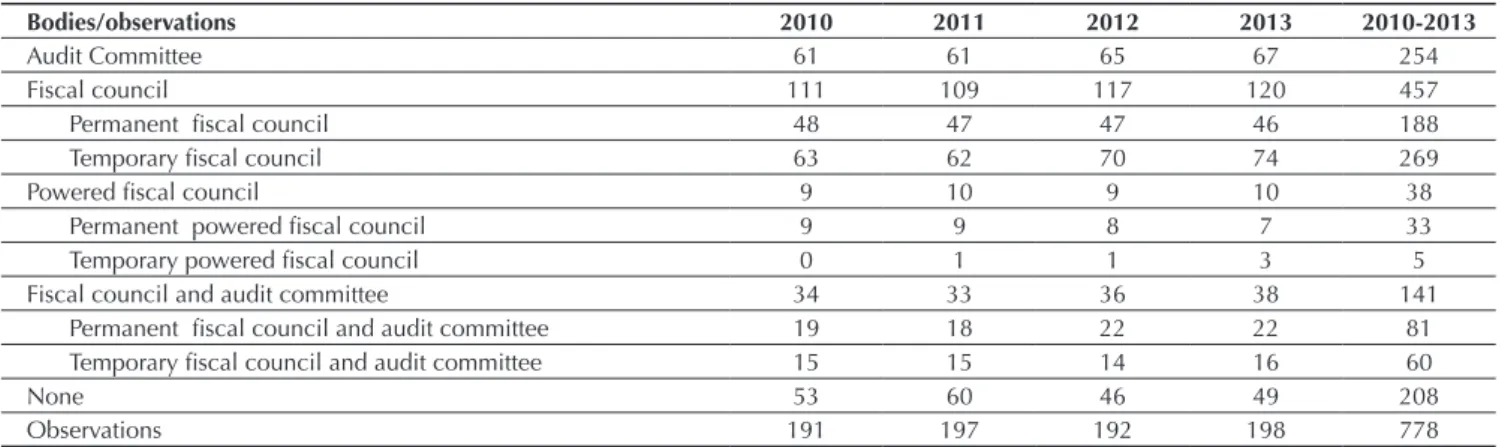
Table 2 shows sample composition according to the existence of the bodies under analysis. h e results are
presented for the total sample (annual stock liquidity above 0.001) without excluding outliers.
Table 2 Global composition of the fi scal council and the audit committee in Brazil between 2010 and 2013
Bodies/observations 2010 2011 2012 2013 2010-2013
Audit Committee 61 61 65 67 254
Fiscal council 111 109 117 120 457
Permanent i scal council 48 47 47 46 188
Temporary i scal council 63 62 70 74 269
Powered i scal council 9 10 9 10 38
Permanent powered i scal council 9 9 8 7 33
Temporary powered i scal council 0 1 1 3 5
Fiscal council and audit committee 34 33 36 38 141
Permanent i scal council and audit committee 19 18 22 22 81
Temporary i scal council and audit committee 15 15 14 16 60
None 53 60 46 49 208
Observations 191 197 192 198 778
Source: Prepared by the authors.
It is verifi ed that the most common practice in Brazil is adopting a fi scal council, since 457 observations (companies-year) had this body installed within the four years surveyed. The presence of a powered fi scal council is noticed in 38 observations of the sample and it corresponds to companies that issue ADR and did not
install the audit committee.
In Brazil, the installation of an audit committee is voluntary, except for financial institutions and insurance companies, so that its existence is found in 254 observations. There are 208 observations from fi rms that have neither installed a fi scal council or an audit
committee, something which may suggest weakness in the corporate governance system and lower monitoring of managers in these companies.
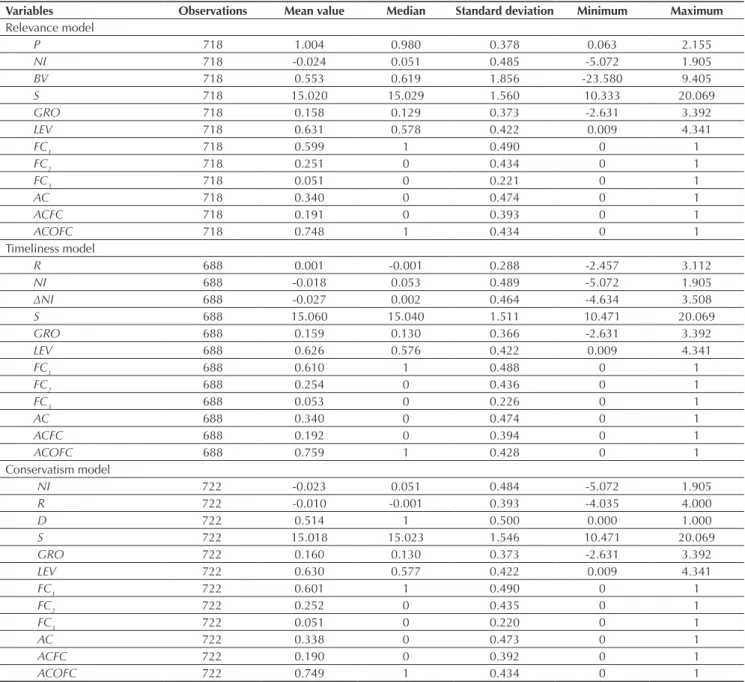
Table 3 displays the descriptive statistics of variables in the earnings quality models explained in the methodology.
Table 3 Descriptive statistics of earnings quality models
Variables Observations Mean value Median Standard deviation Minimum Maximum
Relevance model
P 718 1.004 0.980 0.378 0.063 2.155
NI 718 -0.024 0.051 0.485 -5.072 1.905
BV 718 0.553 0.619 1.856 -23.580 9.405
S 718 15.020 15.029 1.560 10.333 20.069
GRO 718 0.158 0.129 0.373 -2.631 3.392
LEV 718 0.631 0.578 0.422 0.009 4.341
FC1 718 0.599 1 0.490 0 1
FC2 718 0.251 0 0.434 0 1
FC3 718 0.051 0 0.221 0 1
AC 718 0.340 0 0.474 0 1
ACFC 718 0.191 0 0.393 0 1
ACOFC 718 0.748 1 0.434 0 1
Timeliness model
R 688 0.001 -0.001 0.288 -2.457 3.112
NI 688 -0.018 0.053 0.489 -5.072 1.905
∆NI 688 -0.027 0.002 0.464 -4.634 3.508
S 688 15.060 15.040 1.511 10.471 20.069
GRO 688 0.159 0.130 0.366 -2.631 3.392
LEV 688 0.626 0.576 0.422 0.009 4.341
FC1 688 0.610 1 0.488 0 1
FC2 688 0.254 0 0.436 0 1
FC3 688 0.053 0 0.226 0 1
AC 688 0.340 0 0.474 0 1
ACFC 688 0.192 0 0.394 0 1
ACOFC 688 0.759 1 0.428 0 1
Conservatism model
NI 722 -0.023 0.051 0.484 -5.072 1.905
R 722 -0.010 -0.001 0.393 -4.035 4.000
D 722 0.514 1 0.500 0.000 1.000
S 722 15.018 15.023 1.546 10.471 20.069
GRO 722 0.160 0.130 0.373 -2.631 3.392
LEV 722 0.630 0.577 0.422 0.009 4.341
FC1 722 0.601 1 0.490 0 1
FC2 722 0.252 0 0.435 0 1
FC3 722 0.051 0 0.220 0 1
AC 722 0.338 0 0.473 0 1
ACFC 722 0.190 0 0.392 0 1
ACOFC 722 0.749 1 0.434 0 1
Note: Pi,t is the share price of company i in year t adjusted by dividends and splits (four months after the end of the year) and
scaled by share price in t-1, NIi,t is earnings per share of company i in year t scaled by share price in t-1, BVi,t is equity per share of company i in year t, scaled by share price in t-1, R is annual return of fi rm i in period t (four months after the beginning of the year), and ∆NIit is profi t variance per share of fi rm i in period t. The variables P, LPA, PLA, R, ∆LPA are scaled by price in t-1 (four months after the beginning of the year).
ACFC = dummy variable if fi rm i has both, fi scal council and audit committee, installed; AC = dummy variable if fi rm i has an audit committee installed; FCn = dummy variable if fi rm i has a general fi scal council installed (FC1), a permanent fi scal council (FC2), or a powerful fi scal council (FC3); D = dummy variable, considering 1 if the return is negative and 0, otherwise; LEV = leverage of fi rm i in period t; GRO = revenue growth of fi rm i in period t; ACOFC = dummy variable if fi rm i has a fi scal council or an audit committee installed; S = natural logarithm of total assets of fi rm i in period t.
We observe greater data dispersion between the variables NI and GRO in all models, as well as the variables
R and ΔNI in the timeliness model and R in conditional conservatism, since they have a standard deviation above mean value. For the variables body presence and arrangement, extreme values (minimum and maximum
value) are always the same, due to the characteristics of these variables, but they have dif erences in dispersion between the various variables.
Table 4 shows the results referring to regressions for the relevance model.
Table 4 Results of the relevance model
Model 1
Pi,t = β0 +β1.NIi,t + β2.BVi,t + β3.Cn + β4.NIi,t*Cn + β5.BVi,t*Cn + ∑ .βn.Control + εi,t
Column 1 2 3 4 5 6
Variables
General i scal council
Audit
Committee Both
Fiscal council or audit committee
Permanent i scal council
Powered i scal council
C = FC1 C = AC C = ACFC C = ACOFC C = FC2 C = FC3
NI 0.285*** 0.180*** 0.199*** 0.239*** 0.204*** 0.225***
(5.20) (3.41) (3.56) (4.48) (3.59) (3.76)
BV -0.0422*** -0.0217** -0.0239*** -0.0366*** -0.0288*** -0.0306***
(-5.50) (-2.54) (-2.82) (-4.25) (-3.31) (-3.69)
Cn 0.0479 0.0296 0.107* 0.0440 -0.0706* -0.0508
(0.132) (0.67) (1.82) 1.29 (-1.92) (-0.68)
NI*Cn -0.104 0.568*** 0.382*** -0.0328 0.431*** -0.150
(-1.16) (4.08) (3.08) (-0.35) (3.57) (-0.74)
BV*Cn 0.0281** 0.00306 -0.0314 0.0206* 0.0902*** 0.0568**
(2.60) (0.06) (-0.51) (1.76) (3.48) (2.51)
S 0.00479 0.00603 0.00378 0.00514 0.00306 0.00978
(0.50) (0.63) (0.39) (0.54) (0.29) (0.93)
GRO 0.106** 0.0837* 0.0948** 0.102** 0.0968** 0.0982**
(2.20) (1.81) (2.01) (2.01) (2.04) (2.04)
LEV -0.104*** -0.104*** -0.105*** -0.102*** -0.109*** -0.109***
(-2.92) (-2.99) (-2.95) (-2.91) (-3.02) (-2.92)
Const. 0.969*** 0.968*** 0.998*** 0.958*** 1.026*** 0.932***
(6.51) (6.39) (6.51) (6.47) (6.06) (5.57)
R² (%) 10.98 12.5 11.47 10.39 11.82 10.32
F 6.45 9.66 9.57 5.21 10.44 9.75
Prob. F 0.000 0.000 0.000 0.000 0.000 0.000
Clusters (n) 210 210 210 210 210 210
Observations 718 718 718 718 718 718
Note: Pi,t is the share price of company i in year t adjusted by dividends and splits (four months after the end of the year) and scaled by share price in t-1, NIi,t is earnings per share of company i in year t scaled by share price in t-1, BVi,t is equity per share of
company i in year t, scaled by share price in t-1. The fi rst line shows the coeffi cients and the second line, the t statistics. Standard error is robust and clustered by fi rm. The variables P, LPA, and PLA are scaled by price in t-1 (four months after the beginning of the year).
ACFC = dummy variable if fi rm i has both, fi scal council and audit committee, installed; AC = dummy variable if fi rm i has an audit committee installed; FCn = dummy variable if fi rm i has a general fi scal council installed (FC1), a permanent fi scal council
(FC2), or a powerful fi scal council (FC3); Cn = variable that takes values for FCn, AC, ACFC, or ACOFC; LEV = leverage of fi rm i in period t; GRO = revenue growth of fi rm i in period t; ACOFC = dummy variable if fi rm i has a fi scal council or an audit committee installed; S = natural logarithm of total assets of fi rm i in period t.
***, **, *: signifi cant at 1%, 5%, and 10%, respectively.
Source: Prepared by the authors.
In column 1 of Table 4, the result for the ef ect of presence of a general i scal council has a positive and signii cant coeffi cient only for the variable BV*FC1 (0.0281,
t = 2.60). h us, when the company chooses to set up the general i scal council (permanent or temporary), the results suggest that equity is relevant to the market, unlike net income, which has a negative and non-signii cant coeffi cient, partly corroborating the results of Trapp (2009), which associates the i scal council installation in Brazil with lower levels of earnings management.
Column 2 displays the results for the ef ect of an audit committee on relevance. h e results are contrary to those of the general i scal council – the variable NI*AC has a positive and signii cant coeffi cient of 0.568 (t = 4.08) –, suggesting that the presence of this control mechanism has a positive impact on relevance of the reported net income. Interaction with the variable BV is positive, but not signii cant. h ese results corroborate those of Filipin (2012) in Brazil and they are convergent with Baxter and Cotter (2009) and Wild (1996).
h e ef ects of the presence of both (i scal council and audit committee, simultaneously), represented in column 3, show a positive and signii cant coeffi cient only for the variable NI*ACFC (0.382, t = 3.08), highlighting that the implementation of the two bodies, simultaneously, only
af ects net income. Also, in column 4, the existence of one or other body has an impact on equity relevance, since the variable BV*ACOFC has a positive and signii cant coeffi cient of 0.0206 (t = 1.76).
h e ef ects of a permanent i scal council are displayed in column 5. h e results suggest for both the variable
NI*FC2 and BV*FC2 positive and signii cant coeffi cients of 0.431 (t = 3.57) and 0.0902 (t = 3.48), respectively. In this way, the presence of the i scal council on a permanent basis increases the relevance of net income and equity. Such a result confirms that the market recognizes accounting i gures as more relevant information, thus of better quality, when there is a permanent presence of a i scal council in the companies. h is i nding coni rms the claim of Carvalhal-da-Silva and Leal (2005) that permanent i scal councils may be regarded as stronger governance mechanisms than when they are installed only at shareholders’ request.
h e results for the ef ects of the powered i scal council (column 6) have evidence similar to that from the general i scal council: positive and signii cant coeffi cient only for the variable BV*FC3(0.0568, t = 2.51) and negative for net income, although not signii cant, showing impact only on equity relevance.
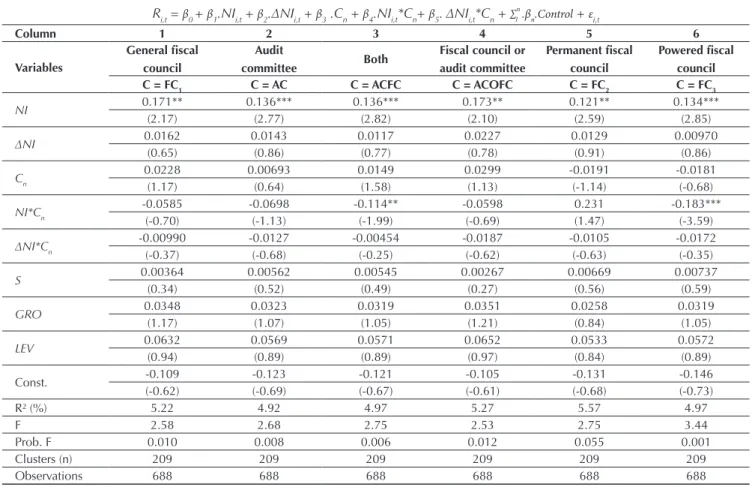
Table 5 Results of the timeliness model
Model 2
Ri,t = β0 + β1.NIi,t + β2.∆NIi,t + β3 .Cn + β4.NIi,t*Cn+ β5. ∆NIi,t*Cn + ∑ .βn.Control + εi,t
Column 1 2 3 4 5 6
Variables
General i scal council
Audit
committee Both
Fiscal council or audit committee
Permanent i scal council
Powered i scal council
C = FC1 C = AC C = ACFC C = ACOFC C = FC2 C = FC3
NI 0.171** 0.136*** 0.136*** 0.173** 0.121** 0.134***
(2.17) (2.77) (2.82) (2.10) (2.59) (2.85)
∆NI 0.0162 0.0143 0.0117 0.0227 0.0129 0.00970
(0.65) (0.86) (0.77) (0.78) (0.91) (0.86)
Cn
0.0228 0.00693 0.0149 0.0299 -0.0191 -0.0181
(1.17) (0.64) (1.58) (1.13) (-1.14) (-0.68)
NI*Cn
-0.0585 -0.0698 -0.114** -0.0598 0.231 -0.183***
(-0.70) (-1.13) (-1.99) (-0.69) (1.47) (-3.59)
∆NI*Cn
-0.00990 -0.0127 -0.00454 -0.0187 -0.0105 -0.0172
(-0.37) (-0.68) (-0.25) (-0.62) (-0.63) (-0.35)
S 0.00364 0.00562 0.00545 0.00267 0.00669 0.00737
(0.34) (0.52) (0.49) (0.27) (0.56) (0.59)
GRO 0.0348 0.0323 0.0319 0.0351 0.0258 0.0319
(1.17) (1.07) (1.05) (1.21) (0.84) (1.05)
LEV 0.0632 0.0569 0.0571 0.0652 0.0533 0.0572
(0.94) (0.89) (0.89) (0.97) (0.84) (0.89)
Const. -0.109 -0.123 -0.121 -0.105 -0.131 -0.146
(-0.62) (-0.69) (-0.67) (-0.61) (-0.68) (-0.73)
R² (%) 5.22 4.92 4.97 5.27 5.57 4.97
F 2.58 2.68 2.75 2.53 2.75 3.44
Prob. F 0.010 0.008 0.006 0.012 0.055 0.001
Clusters (n) 209 209 209 209 209 209
Observations 688 688 688 688 688 688
Note: Ri,t is return on (the most liquid class) share of company i in year t adjusted by dividends and splits (four months after the end of the year) and scaled by share price in t-1, NIi,t is earnings per share of company i in year t and scaled by share price in t-1,
and ∆BVi,t are changes in net income per share of company i in year t and scaled by share price in t-1. In the fi rst line there are
coeffi cients and in the second line, the t statistics. Standard error is robust and clustered by fi rm. The variables R, LPA, and ∆LPA are scaled by price in t-1 (four months after the beginning of the year).
ACFC = dummy variable if fi rm i has both, fi scal council and audit committee, installed; AC = dummy variable if fi rm i has an audit committee installed; FCn = dummy variable if fi rm i has a general fi scal council installed (FC1), a permanent fi scal council
(FC1), or a powerful fi scal council (FC3); Cn = variable that takes values for FCn, AC, ACFC, or ACOFC; LEV = leverage of fi rm i in period t; GRO = revenue growth of fi rm i in period t; ACOFC = dummy variable if fi rm i has fi scal council or audit committee installed; S = natural logarithm of total assets of fi rm i in period t.
***, **, *: signifi cant at 1%, 5%, and 10%, respectively.
Source: Prepared by the authors.
h e models of columns 1, 2, 4, and 5 of Table 5 have, for the variables of interest, coeffi cients with no statistical signii cance, something which indicates that companies with a general i scal council, an audit committee, and a permanent i scal council do not raise market expectations in relation to net income and its contemporary variation to stock return.
Contrary to hypotheses 3 and 4, the results for a powered i scal council and the presence of both have negative and signii cant coeffi cients for the variables
NI*FC3 (-0.183, t = -0.68) and NI*ACFC (-0.114, t = -1.99), showing that their presence does not improve the timeliness of accounting i gures, i.e. the market anticipates net income information content. h is result, as well as the result for relevance, contributes to academic and professional discussions about the overlapping of actions taken by the powered i scal council.
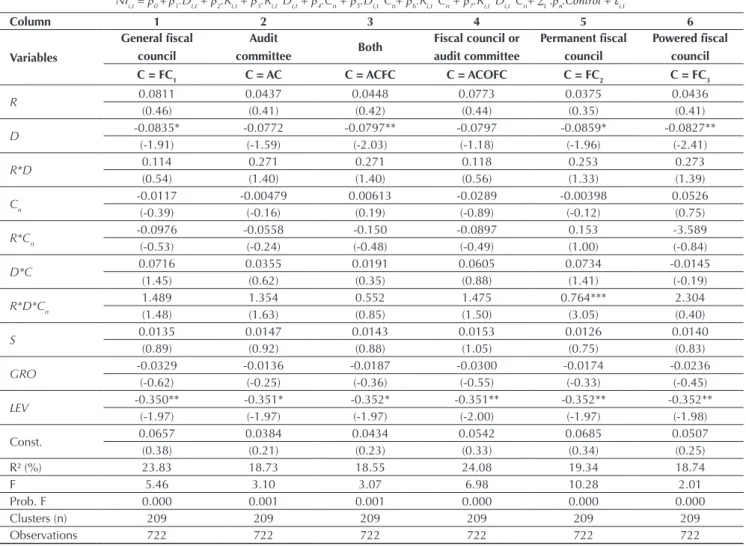
Table 6 shows the results of regressions for the conditional conservatism model.
Table 6 Results of the conditional conservatism model
Model 3
NIi,t = β0 +β1.Di,t + β2.Ri,t + β3.Ri,t*Di,t + β4.Cn + β5.Di,t*Cn+ β6.Ri,t*Cn + β7.Ri,t*Di,t*Cn+ ∑ .βn.Control + εi,t
Column 1 2 3 4 5 6
Variables
General i scal council
Audit
committee Both
Fiscal council or audit committee
Permanent i scal council
Powered i scal council
C = FC1 C = AC C = ACFC C = ACOFC C = FC2 C = FC3
R 0.0811 0.0437 0.0448 0.0773 0.0375 0.0436
(0.46) (0.41) (0.42) (0.44) (0.35) (0.41)
D -0.0835* -0.0772 -0.0797** -0.0797 -0.0859* -0.0827**
(-1.91) (-1.59) (-2.03) (-1.18) (-1.96) (-2.41)
R*D 0.114 0.271 0.271 0.118 0.253 0.273
(0.54) (1.40) (1.40) (0.56) (1.33) (1.39)
Cn -0.0117 -0.00479 0.00613 -0.0289 -0.00398 0.0526
(-0.39) (-0.16) (0.19) (-0.89) (-0.12) (0.75)
R*Cn -0.0976 -0.0558 -0.150 -0.0897 0.153 -3.589
(-0.53) (-0.24) (-0.48) (-0.49) (1.00) (-0.84)
D*C 0.0716 0.0355 0.0191 0.0605 0.0734 -0.0145
(1.45) (0.62) (0.35) (0.88) (1.41) (-0.19)
R*D*Cn 1.489 1.354 0.552 1.475 0.764*** 2.304
(1.48) (1.63) (0.85) (1.50) (3.05) (0.40)
S 0.0135 0.0147 0.0143 0.0153 0.0126 0.0140
(0.89) (0.92) (0.88) (1.05) (0.75) (0.83)
GRO -0.0329 -0.0136 -0.0187 -0.0300 -0.0174 -0.0236
(-0.62) (-0.25) (-0.36) (-0.55) (-0.33) (-0.45)
LEV -0.350** -0.351* -0.352* -0.351** -0.352** -0.352**
(-1.97) (-1.97) (-1.97) (-2.00) (-1.97) (-1.98)
Const. 0.0657 0.0384 0.0434 0.0542 0.0685 0.0507
(0.38) (0.21) (0.23) (0.33) (0.34) (0.25)
R² (%) 23.83 18.73 18.55 24.08 19.34 18.74
F 5.46 3.10 3.07 6.98 10.28 2.01
Prob. F 0.000 0.001 0.001 0.000 0.000 0.000
Clusters (n) 209 209 209 209 209 209
Observations 722 722 722 722 722 722
Note: NIi,t is earnings per share of company i in year t, scaled by share price at t-1, Ri,t is return on share (the most liquid share class) of company i in year t adjusted by dividends and splits (four months after the end of the year) and scaled by share price at t-1 (Cn according to model 1). The fi rst line shows the coeffi cients and the second line, the t statistics. Standard error is robust and clustered by fi rm. The variables LPA and R are scaled by price in t-1 (four months after the beginning of the year).
ACFC = dummy variable if fi rm i has both, fi scal council and audit committee, installed; AC = dummy variable if fi rm i has an audit committee installed; CFn = dummy variable if fi rm i has a general fi scal council installed (FC1), a permanent fi scal council (FC2), or a powerful fi scal council (FC3); Cn = variable that takes values for FCn, AC, ACFC, or ACOFC; D = dummy variable considering 1 if the return is negative and 0, otherwise; LEV = leverage of fi rm i in period t; GRO = revenue growth of fi rm i in period t; ACOFC = dummy variable if fi rm i has a fi scal council or an audit committee installed; S = natural logarithm of total assets of fi rm i in period t.
***, **, *: signifi cant at 1%, 5%, and 10%, respectively.
Source: Prepared by the authors.
h e results point out that only companies with a permanent i scal council installed, according to column 5 of Table 6, have an attribute of conditional conservatism, recognizing in advance their economic losses in net income, since the variable R*D*CF2 has a positive and signii cant coeffi cient of 0.764 (t = 3.05).
h us, there is evidence of a positive ef ect of the presence of a permanent i scal council as a corporate governance mechanism that reinforces the good practices
suggested by Almeida (2010), Bushman and Smith (2001), Lopes and Walker (2008), and Sloan (2001).
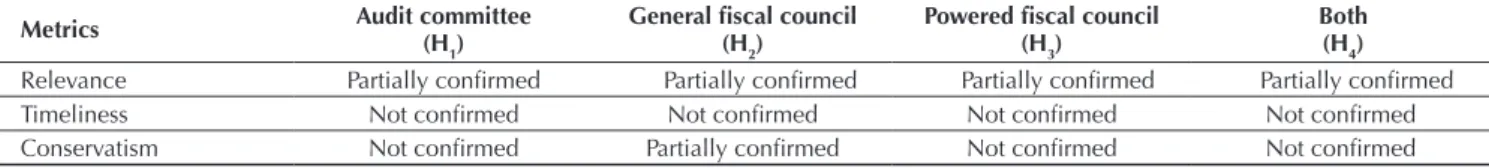
Table 7 summarizes the results found for the H1 hypothesis that the presence in Brazilian companies of an audit committee (H1), a i scal council (H2), an audit committee (H3), and both simultaneously (H4) increases the quality of accounting information disclosed to the market.
5. ROBUSTNESS ANALYSIS
In order to reinforce the evidence found previously, we sought to change the variable of interest presence of an audit committee and a i scal council by the independence degree of their members.
h e i scal council independence was analyzed in two ways: (i) members representing minority shareholders, elected at the general meeting (thus, independence from the controlling shareholders is expected), and (ii) independence with management, verifying present and past relations between the member and the company or economic group by means of item 12.8 of the company Reference Form.
As for independence of the audit committee, we could only use as a proxy member independence from management, because they were not directly elected by shareholders, making it impossible to analyze independence of the controlling shareholders. h e number
of observations in this analysis changed when compared to the previous one is due to the fact that some companies did not provide the full information, in the company Reference Form, of the members’ curricula, both those from the i scal council and the audit committee, something which resulted in a decreased number of observations.
h e variable DIND1 is a dummy variable that takes value 1 when the company has at least one member elected by minority shareholders and 0 otherwise, the variable
IND1 measures the percentage of members elected by minority shareholders, while the variable DIND2 takes value 1 when the company has at least one independent member and 0 otherwise, and the variable IND2 measures the percentage of independent members.
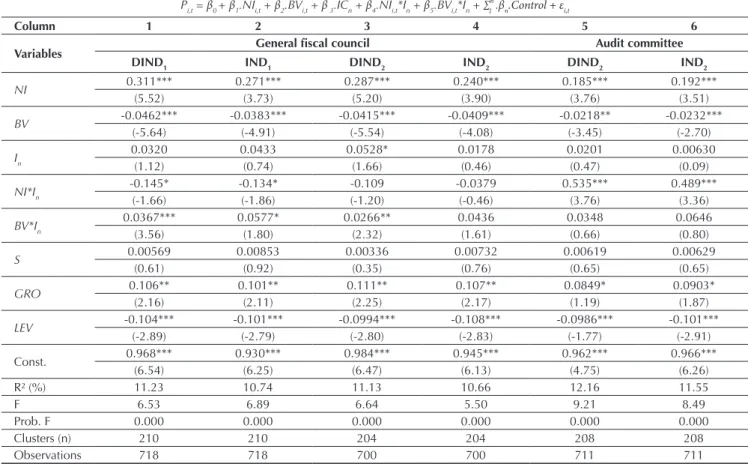
In the same structure, we analyze relevance, timeliness, and conditional conservatism. Table 8 displays results for the relevance model.
Table 7 Summary of results for the research hypotheses
Metrics Audit committee
(H1)
General i scal council (H2)
Powered i scal council (H3)
Both (H4)
Relevance Partially coni rmed Partially coni rmed Partially coni rmed Partially coni rmed
Timeliness Not coni rmed Not coni rmed Not coni rmed Not coni rmed
Table 8 Results of the relevance model (independence)
Model 1
Pi,t = β0 + β1.NIi,t + β2.BVi,t + β 3.ICn + β4.NIi,t*In + β5.BVi,t*In + ∑ .βn.Control + εi,t
Column 1 2 3 4 5 6
Variables General i scal council Audit committee
DIND1 IND1 DIND2 IND2 DIND2 IND2
NI 0.311*** 0.271*** 0.287*** 0.240*** 0.185*** 0.192***
(5.52) (3.73) (5.20) (3.90) (3.76) (3.51)
BV -0.0462*** -0.0383*** -0.0415*** -0.0409*** -0.0218** -0.0232***
(-5.64) (-4.91) (-5.54) (-4.08) (-3.45) (-2.70)
In 0.0320 0.0433 0.0528* 0.0178 0.0201 0.00630
(1.12) (0.74) (1.66) (0.46) (0.47) (0.09)
NI*In -0.145* -0.134* -0.109 -0.0379 0.535*** 0.489***
(-1.66) (-1.86) (-1.20) (-0.46) (3.76) (3.36)
BV*In 0.0367*** 0.0577* 0.0266** 0.0436 0.0348 0.0646
(3.56) (1.80) (2.32) (1.61) (0.66) (0.80)
S 0.00569 0.00853 0.00336 0.00732 0.00619 0.00629
(0.61) (0.92) (0.35) (0.76) (0.65) (0.65)
GRO 0.106** 0.101** 0.111** 0.107** 0.0849* 0.0903*
(2.16) (2.11) (2.25) (2.17) (1.19) (1.87)
LEV -0.104*** -0.101*** -0.0994*** -0.108*** -0.0986*** -0.101***
(-2.89) (-2.79) (-2.80) (-2.83) (-1.77) (-2.91)
Const. 0.968*** 0.930*** 0.984*** 0.945*** 0.962*** 0.966***
(6.54) (6.25) (6.47) (6.13) (4.75) (6.26)
R² (%) 11.23 10.74 11.13 10.66 12.16 11.55
F 6.53 6.89 6.64 5.50 9.21 8.49
Prob. F 0.000 0.000 0.000 0.000 0.000 0.000
Clusters (n) 210 210 204 204 208 208
Observations 718 718 700 700 711 711
Note: P
i,t is the share price of company i in year t adjusted by dividends and splits (four months after the end of the year) and
scaled by share price in t-1, NIi,t is earnings per share of company i in year t scaled by share price in t-1, BVi,t is equity per share of
company i in year t, scaled by share price in t-1. The fi rst line shows the coeffi cients and the second line, the t statistics. Standard error is robust and clustered by fi rm. The variables P, LPA, and PLA are scaled by price in t-1 (four months after the beginning of the year).
DINDn = dummy variable if fi rm i has at least one independent controller member (DIND1) or administration member (DIND2)
in the fi scal council or the audit committee; LEV = leverage of fi rm i in period t; I = variable that takes values for member independence; INDn = percentage of independent controller members (IND1) or administration members (IND2) in the fi scal council or the audit committee in fi rm i; GRO = revenue growth of fi rm i in period t; S = natural logarithm of total assets of fi rm i in period t.
***, **, *: signifi cant at 1%, 5%, and 10%, respectively.
Source: Prepared by the authors.
h e results for relevance indicate that i scal council independence positively impacts equity relevance in the two independence analyses and that of the audit committee only impacts net income relevance, reinforcing
the previous results for relevance of analyzing the presence of these bodies.
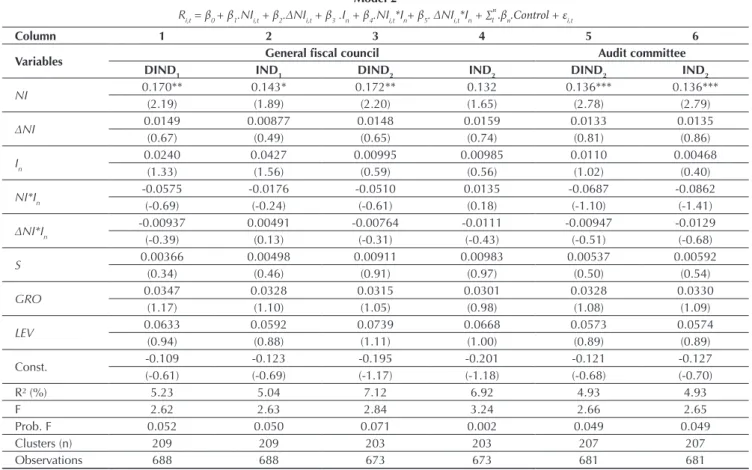
Table 9 displays the results for the timeliness model.
Table 9 Results for the timeliness model (independence)
Model 2
Ri,t = β0 + β1.NIi,t + β2.∆NIi,t + β3 .In + β4.NIi,t*In+ β5. ∆NIi,t*In + ∑ .βn.Control + εi,t
Column 1 2 3 4 5 6
Variables General i scal council Audit committee
DIND1 IND1 DIND2 IND2 DIND2 IND2
NI 0.170** 0.143* 0.172** 0.132 0.136*** 0.136***
(2.19) (1.89) (2.20) (1.65) (2.78) (2.79)
∆NI 0.0149 0.00877 0.0148 0.0159 0.0133 0.0135
(0.67) (0.49) (0.65) (0.74) (0.81) (0.86)
In
0.0240 0.0427 0.00995 0.00985 0.0110 0.00468
(1.33) (1.56) (0.59) (0.56) (1.02) (0.40)
NI*In
-0.0575 -0.0176 -0.0510 0.0135 -0.0687 -0.0862
(-0.69) (-0.24) (-0.61) (0.18) (-1.10) (-1.41)
∆NI*In
-0.00937 0.00491 -0.00764 -0.0111 -0.00947 -0.0129
(-0.39) (0.13) (-0.31) (-0.43) (-0.51) (-0.68)
S 0.00366 0.00498 0.00911 0.00983 0.00537 0.00592
(0.34) (0.46) (0.91) (0.97) (0.50) (0.54)
GRO 0.0347 0.0328 0.0315 0.0301 0.0328 0.0330
(1.17) (1.10) (1.05) (0.98) (1.08) (1.09)
LEV 0.0633 0.0592 0.0739 0.0668 0.0573 0.0574
(0.94) (0.88) (1.11) (1.00) (0.89) (0.89)
Const. -0.109 -0.123 -0.195 -0.201 -0.121 -0.127
(-0.61) (-0.69) (-1.17) (-1.18) (-0.68) (-0.70)
R² (%) 5.23 5.04 7.12 6.92 4.93 4.93
F 2.62 2.63 2.84 3.24 2.66 2.65
Prob. F 0.052 0.050 0.071 0.002 0.049 0.049
Clusters (n) 209 209 203 203 207 207
Observations 688 688 673 673 681 681
Note: Ri,t is return on (the most liquid class) share of company i in year t adjusted by dividends and splits (four months after the
end of the year) and scaled by share price in t-1, NIi,t is earnings per share of company i in year t and scaled by share price in t-1, and ∆BVi,t are changes in net income per share of company i in year t and scaled by share price in t-1 (In according to model 1). The fi rst line shows the coeffi cients and the second line, the t statistics. Standard error is robust and clustered by fi rm. The variables P, LPA, and PLA are scaled by price in t-1 (four months after the beginning of the year).
DINDn = dummy variable if fi rm i has at least one independent controller member (DIND1) or administration member (DIND2)
in the fi scal council or the audit committee; LEV = leverage of fi rm i in period t; I = variable that takes values for member independence; INDn = percentage of independent controller members (IND1) or administration members (IND2) in the fi scal council or the audit committee in fi rm i; GRO = revenue growth of fi rm i in period t; S = natural logarithm of total assets of fi rm i in period t.
***, **, *: signifi cant at 1%, 5%, and 10%, respectively.
Source: Prepared by the authors.
According to the results for timeliness, we cannot attest to the ef ect of member independence on earnings timeliness and its persistence, as well as when analyzing
the presence of these bodies.
Table 10 displays the results for the conditional conservatism model.
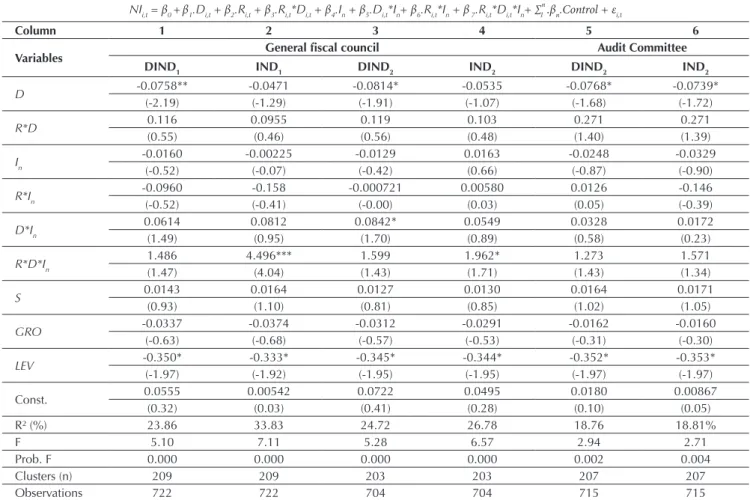
Table 10 Results for the conditional conservatism model (independence)
Model 3
NIi,t = β0 +β1.Di,t + β2.Ri,t + β3.Ri,t*Di,t + β4.In + β5.Di,t*In+ β6.Ri,t*In + β 7.Ri,t*Di,t*In+ ∑ .βn.Control + εi,t
Column 1 2 3 4 5 6
Variables General i scal council Audit Committee
DIND1 IND1 DIND2 IND2 DIND2 IND2
D -0.0758** -0.0471 -0.0814* -0.0535 -0.0768* -0.0739*
(-2.19) (-1.29) (-1.91) (-1.07) (-1.68) (-1.72)
R*D 0.116 0.0955 0.119 0.103 0.271 0.271
(0.55) (0.46) (0.56) (0.48) (1.40) (1.39)
In -0.0160 -0.00225 -0.0129 0.0163 -0.0248 -0.0329
(-0.52) (-0.07) (-0.42) (0.66) (-0.87) (-0.90)
R*In -0.0960 -0.158 -0.000721 0.00580 0.0126 -0.146
(-0.52) (-0.41) (-0.00) (0.03) (0.05) (-0.39)
D*In 0.0614 0.0812 0.0842* 0.0549 0.0328 0.0172
(1.49) (0.95) (1.70) (0.89) (0.58) (0.23)
R*D*In 1.486 4.496*** 1.599 1.962* 1.273 1.571
(1.47) (4.04) (1.43) (1.71) (1.43) (1.34)
S 0.0143 0.0164 0.0127 0.0130 0.0164 0.0171
(0.93) (1.10) (0.81) (0.85) (1.02) (1.05)
GRO -0.0337 -0.0374 -0.0312 -0.0291 -0.0162 -0.0160
(-0.63) (-0.68) (-0.57) (-0.53) (-0.31) (-0.30)
LEV -0.350* -0.333* -0.345* -0.344* -0.352* -0.353*
(-1.97) (-1.92) (-1.95) (-1.95) (-1.97) (-1.97)
Const. 0.0555 0.00542 0.0722 0.0495 0.0180 0.00867
(0.32) (0.03) (0.41) (0.28) (0.10) (0.05)
R² (%) 23.86 33.83 24.72 26.78 18.76 18.81%
F 5.10 7.11 5.28 6.57 2.94 2.71
Prob. F 0.000 0.000 0.000 0.000 0.002 0.004
Clusters (n) 209 209 203 203 207 207
Observations 722 722 704 704 715 715
Note: NIi,t is earnings per share of company i in year t, scaled by share price at t-1 and Ri,t is return on share (the most liquid share class) of company i in year t adjusted by dividends and splits (four months after the end of the year) and scaled by share price at t-1 (Cn according to model 1). The fi rst line shows the coeffi cients and the second line, the t statistics. Standard error is
robust and clustered by fi rm. The variables LPA and R are scaled by price in t-1 (four months after the beginning of the year). D = dummy variable considering 1 if the return is negative and 0, otherwise; DINDn = dummy variable if fi rm i has at least one independent controller member (DIND1) or administration member (DIND2) in the fi scal council or the audit committee; LEV = leverage of fi rm i in period t; I = variable that takes values for member independence; INDn = percentage of independent
controller members (IND1) or administration members (IND2) in the fi scal council or the audit committee in fi rm i; GRO =
revenue growth of fi rm i in period t; S = natural logarithm of total assets of fi rm i in period t. ***, **, *: signifi cant at 1%, 5%, and 10%, respectively.
Source: Prepared by the authors.
According to the results presented in Table 10, the percentage of independent members in the i scal council, either elected by minority shareholders or independent members, has an impact on reported proi t conservatism. However, the results do not point out an association between member independence in the audit committee
and the practice of conditional conservatism.
h erefore, we notice that member independence in the i scal council managed to change the impact of the presence of this body on conditional conservatism. h e results for audit committee independence reinforce the evidence found for its presence.
6. FINAL REMARKS
h is study evaluated the ef ects of the presence of the audit committee and the i scal council and their various arrangements on earnings quality of Brazilian public companies listed on the BM&FBOVESPA from 2010 to 2013. h e metrics to assess earnings quality were: relevance, timeliness, and conditional conservatism. h e motivation for conducting this research focused on the perspective of these bodies functioning as a mechanism of corporate governance, especially in the functions of supervision and inspection of the i nancial reporting process.
In general, the results indicated that the bodies under study have an ef ect on the quality of accounting i gures. However, a conclusion must be drawn according to each research hypothesis, body coni gurations, and accounting information properties.
h e results for the audit committee and the general i scal council indicated impacts only on the relevance of accounting information: impact on net income, for the audit committee, and on equity, for the general i scal council, partially coni rming the hypotheses H1 e H2.
In parallel, the results pointed out a high impact of the audit committee on net income relevance (high coeffi cient and signii cance). h is evidence may be explained by the specii city of the functions of the committee in the i nancial reporting process, coming from internal controls to internal and external audit inspection, while the i scal council has broader functions/powers, but it has the possibility of accessing information from the auditors and the audit committee when inspecting audited i nancial statements and the executives’ acts.
h e fact that the general i scal council has had a positive and signii cant ef ect only on equity relevance and a negative ef ect on earnings relevance (although not signii cant) may indicate a greater concern of the i scal council in protecting the shareholders’ equity, while the concern of the audit committee may be greater in ensuring more reliable data on managers’ performance (contained in the income statements).
It is worth highlighting that this assumption is that the concerns might be dif erently evidenced in each body (greater focus on one or another goal, based on its functions and hierarchies). Objectively, if net income is relevant to an investor, then the audit committee acts by improving i nancial reporting quality, since its members,
directly or indirectly, were nominated by controlling and minority shareholders, while the i scal council members are predominantly elected by controlling shareholders or a group of shareholders, detaching small investors and shareholders, and giving greater emphasis to equity, as the i scal council members are elected and directly report to shareholders at meetings.
It was expected that the presence of both in the same organization might improve the financial reporting process. h e evidence showed an increase in net income relevance, but the results for timeliness pointed out negative ef ects. h us, in this scenario, net income is relevant to the market, but not in a timely way, something which exposes a restriction to the relevance found. Also, the existence of one or the other body, in contrast to none, only impacted equity relevance.
h e results obtained in this research pointed out higher relevance of net income and equity in companies with a permanent i scal council installed, as well as higher conditional conservatism, something which rel ects the i nancial reporting function as a contractual mechanism. h ese results are mutually related, since early recognition of economic losses in earnings (conditional conservatism) tends to make this information more relevant to the market. Such evidence has indicated that i scal councils permanently installed may be considered as more effi cient corporate governance mechanisms than when installed only at shareholders’ request.
We also found a positive impact of a powered i scal council only on equity relevance. h is evidence suggests that poor association of a powered i scal council with earnings quality metrics may be a rel ection of the various functions of this body, and this can af ect its focus. Such a result may be useful for regulators, market players, and shareholders when discussing better corporate governance models.