Bull Pan Am Health Organ 16(3), 1982
CAUSES OF DEATH
IN TEN ENGLISH-SPEAKING
CARIBBEAN
COUNTRIES
AND TERRITORIES’
N. D. McGlashan*
This article presents a preliminary comparison of mortality data from 10 island
countries and territories in the Caribbean Major dtyerences were observed be- tween the mortality on dzyerent islands ascribable to the four causes of death assessed-these being cancer, ischemic heart disease, diabetes mellitus, and automobile accidents.
Introduction
The English-speaking West Indian islands could conceivably provide an ideal “labora- tory” for the epidemiologic study of causes of death. However, to date analyses have been hampered by the possible noncomparability of mortality data arising from lack of standard- ized procedures for making diagnoses and compiling cause of death data. Such analyses have also been hampered, to a lesser extent, by the fact that census information about the populations at risk on different islands has been of variable quality.
For some years the Ministers of Health of the various countries and territories involved have recognized the handicap created by this lack of comparative information. As a result, at the 1979 Ministers’ Conference on Anti- gua, the Pan American Health Organization was asked to initiate an enquiry to establish whether any sources of quantitative informa- tion could be utilized for comparative study. This article reports the preliminary findings of a partial evaluation of that question carried out through a geographic pathology survey in the autumn of 1980 with the financial support of the Commonwealth Foundation in Lon- don. More detailed age-adjusted analyses, corrected for the effects of chance upon small numbers of occurrences, will be reported
‘Also appearing in Spanish in the Boletin de la Ofiina Sanitaria Panamericana.
%enior Lecturer, Department of Geography, Uni-
versity of Tasmania, Hobart, Australia.
later, as will analyses of possible relationships between cause-specific mortality patterns and socioeconomic and dietary data.
Materials and Methods
Personal visits, made between September and December 1980, were used to collect data on causes of death, as codified in the Interna- tional Classification of Diseases, from health department records in each of 10 island na- tions and territories of the English-speaking Caribbean. These were Antigua, Barbados, Dominica, Grenada, Jamaica, Montserrat, St. Kitts-Nevis, Saint Lucia, St. Vincent, and Trinidad and Tobago.
Mortality data for each sex were collected. These included data on four major causes of death (all cancers, ischemic heart disease, diabetes mellitus, and motor vehicle acci- dents) as well as deaths from all causes, each type of data being broken down into 17 five- year age groups. The four causes of death listed were selected because they were of spe- cial concern to the Ministers of Health, were numerically major causes of death, or were especially apt to be correctly diagnosed and reported on death certificates.
In order to stabilize the mortality figures, annual averages were calculated. These aver- ages were based on three years’ data (1976 on- wards) for Jamaica and Trinidad and Tobago; on four years’ data (1975 onwards) for Bar- bados, Saint Lucia, and St. Vincent; and on five years’ data (1975 onwards) for Antigua,
McGlashan l CAUSES OF DEATH IN THE CARIBBEAN 213
Dominica, Grenada, Montserrat, and St. Kitts-Nevis.
For each island, official estimates of male and female populations (by 17 five-year age groups) were recorded, each estimate being for the midyear of the respective mortality in- formation period. In most cases the estimates were corrected projections based on the 1970 census, though in some cases straight-line in- terpolations between the 1970 census and the new 1980 census were available. On four is- lands (Grenada, Jamaica, St. Kitts-Nevis, and Saint Lucia), information on age-specific deaths was available only by ten-year age groups for individuals over 20 years of age; in these cases an estimating procedure based on data from the overall study area was used. In- accuracies in these population estimates pre- sumably had some effect on rates derived from what appear to be reasonably accurate fatality data. However, in practical terms these pop- ulation errors could have made only slight dif- ferences in the direct inter-island comparison of crude cause-specific mortality that follows.
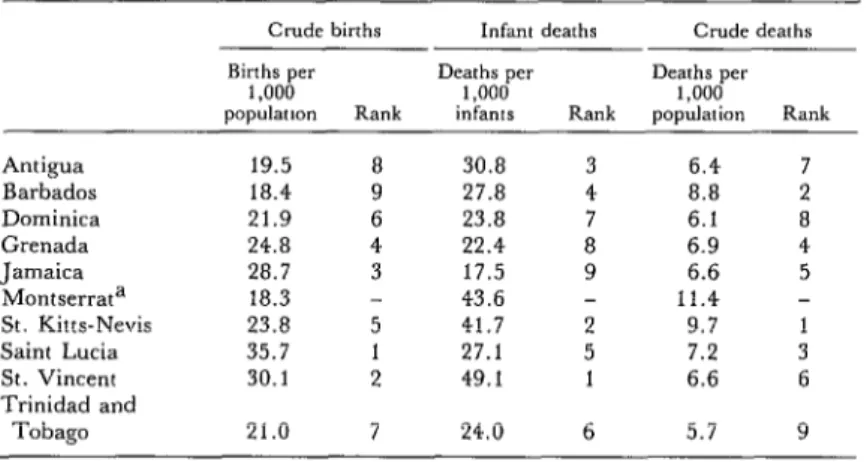
The crude birth rates, infant death rates, and crude death rates used were based on live- year aggregations of data in order to remove the worst effects of random fluctuations. These rates (Table 1) thus represent averages about a 1977 midpoint.
It should also be emphasized that the mor- tality information utilized in this study is based upon causes of death cited in locally issued death certificates. These certificates necessarily have lower diagnostic reliability than pathology reports, but they also con- stitute the only source of data suitable for comparison and capable of providing wide geographic coverage.
Results
All Causes gf Death
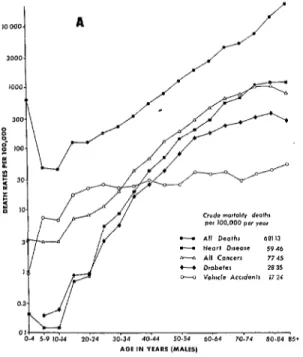
The graph of overall age-specific mortality among males (Figure 1A) shows a crude an- nual mortality from all causes of 681 deaths per 100,000, which includes the relatively high average rate of 621 deaths per 100,000 in the O-4 age group. The graph also shows a rel- atively high rate of 123-124 deaths per 100,000 among males 15-24 years of age; it is felt that trauma must be responsible for a large share of these deaths.
The corresponding graph for females (Fig- ure 1B) shows lower death rates at all ages. A numerical comparison of these rates is pro- vided in Table 2.
Figure 2 shows the percentages of male and female mortality attributable to each of the
Table 1. Annual rates of birth, death, and infant death per 100,000 individuals in 10 English-speaking Caribbean countries and territories, showing the relative
ranking of each. (Figures based on averages of 1975-1979 data.)
Crude births Infant deaths Crude deaths
Births per Deaths per Deaths per
1,000 1,000 1,000
population Rank infants Rank population Rank
Antigua Barbados Dominica Grenada Jamaica Momserrata St. Kim-Nevis Saint Lucia St. Vincent Trinidad and
Tobago
19.5 8 30.8 3
18.4 9 27.8 4
21.9 6 23.8 7
24.8 4 22.4 8
28.7 3 17.5 9
18.3 - 43.6 -
23.8 5 41.7 2
35.7 1 27.1 5
30.1 2 49.1 1
21.0 7 24.0 6
6.4 7
8.8 2
6.1 8
6.9 4
6.6 5
11.4 -
9.7 1
7.2 3
6.6 6
5.7 9
214 PAHO BULLETIN l vol. 16, no. 3, 1982
Figure 1. Crude annual mortality among the study area population, with data for males (A) and females (B) showing the contributions made by each of the four cause8 studied.
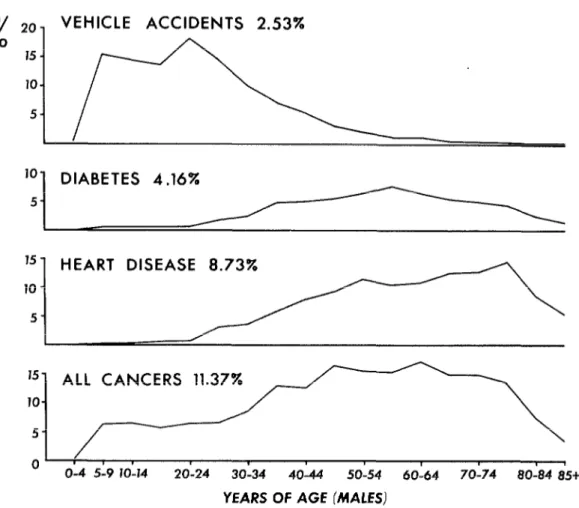
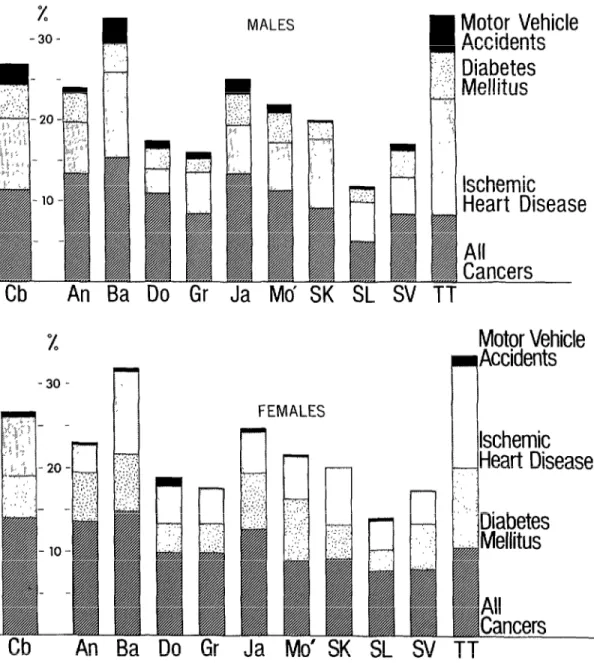
four selected causes of death, by age group, while Figure 3 shows the percentages of total male and female mortality attributable to each of the four selected causes in each of the 10 countries and territories studied.
Cancer
Deaths from all malignant neoplasms rep- resented 11.4 and 11.9 per cent of total mor- tality among males and females, respectively, the crude annual mortality figures showing 77.5 cancer deaths per 100,000 for males and 75.3 cancer deaths per 100,000 for females. By international standards these are remark- ably low figures. For instance, to cite a strong- ly contrasting example, the crude annual can- cer mortality figures for all United States male residents are over twice as high as these Carib-
bean figures. Data for these various popula- tions, by age group, are presented in Table 2.
The age-specific data in Figure 1 show the expected fairly regular rise in cancer death rates above age 20. However, there is a note-
worthy difference between male and female cancer mortality when the contribution of cancer to all deaths is considered. That is, as Figure 2 shows, the percentage of all male deaths attributed to cancer reaches a “pla- teau” of about 15 per cent that extends from 45 to 74 years of age. In the case of females, the 15 per cent mark (extending from 25 to 64 years of age) is reached sooner, and the per- centage of all female deaths attributed to can- cer varies more sharply with age. Among other things, it should be noted that cancer ac- counts for over 25 per cent of all female deaths in the 45-49 age group.
McGlashan l CAUSES OF DEATH IN THE CARIBBEAN 215
Table 2. Age-specific mortality from all causes and from cancer in the 10 areas studied, by sex, and age-specific cancer mortality iq the United States among
the general population and U.S. whites. Caribbean data based on latter 1970s death certificate information.
Age
gro”P
0 - 4 years 621 492
5-9 ” 48 38
10-14 ” 45 35
15- 19 ” 124 73
20-24 ” 123 82
25-29 ” 174 104
30-34 ” 224 203
35-39 ” 329 252
40-44 ” 526 455
45-49 ” 770 540
50-54 ” 1,205 894
55-59 ‘* 1,877 1,222
60-64 ” 2,609 1,909
65-69 ” 4,279 3,084
70-74 ” 5,032 4,354
75-79 ” 7,191 5,931
80-84 ” 13,237 10,264
285 ” 21,321 14,491
All ages 681 630
Data from the 10 areas studied Deaths from all Cancer deaths per causes per 100,000 100,000 inhabitants inhabitants per year per year
U.S. data= Cancer deaths per 100,000 inhabitants
per year
Males Females General
White M&S Females population population
3 3 11 10
3 3 9 7
3 2 7 5
7 9 9 6
8 10 11 7
11 15 15 13
20 38 21 25
43 55 34 49
67 95 62 89
127 139 116 145
186 196 214 214
285 262 359 293
455 332 559 387
643 418 788 505
761 473 1,053 663
985 528
991 823 I 1,455 935
-
759 889 1,799 1,231
78 75 174 130
aFrom T. J Mason, ct al., Atlas ofCancnMor&lilyfor U.S. Counties, 1959-1969, DHEW Publica- tmn No. NIH 75-780, U.S. Department of Health, Education, and Welfare, Washington, D.C., 1975.
and Jamaica (for the Kingston metropolitan area only) could have had a noteworthy effect; and while such registries might not be ex- pected to greatly alter the specific causes re- corded on death certificates directly, they could be expected to have helped focus more local medical attention on malignancy as a cause of death.
Nevertheless, the percentages of all deaths due to cancer on different islands show little sign of correlation with the size of locally available medical facilities (Table 3). Accord- ing to these figures, the relative role of cancer was greatest on Barbados (where it accounted for 15.3 per cent of male mortality and 14.9 per cent of female mortality), least on Saint Lucia (where it accounted for 6.6 per cent of male mortality and 7.9 per cent of female mortality), and about the same as for the
whole area studied in Jamaica (where it ac- counted for 13.3 per cent of male mortality and 12.8 per cent of female mortality). Whether these place-to-place variations are statistically significant has not yet been deter- mined, but they are clearly of a high magni- tude.
Ischebemic Heart Disease
216 PAHO BULLETIN l vol. 16, no. 3, 1982
Figure 2a. The percentages of crude annual mortality among males due to each of the specific causes examined in the study area, by age.
/ 0 0
20- VEHICLE
ACCIDENTS
2.53%
15 -
IO- 5-
lo-
DIABETES
4.16%
5-
‘5- HEART DISEASE 8.73% 10 -
5-
15- ALL CANCERS
11.37%
IO- 5-
0 I
o-4 5-9 IO-14 20-24 3034 40-44 SO-54 60-64 70-74 80-84 8% YEARS OF AGE (MALES)
was higher than female mortality from this cause in virtually all age groups, and in many age groups was nearly twice as high (see Fig- ure 2 and Table 4). The percentage of all male deaths attributed to this cause reached a pla- teau of more than 10 per cent around age 50, a gently sloping plateau that rose slowly to a peak of 14.5 per cent in the 70-74 age group. The pattern among females was less regular, but only in the 65-69 age group did ischemic heart disease account for over 10 per cent of all deaths.
As Table 3 and Figure 3 indicate, the per- centage of all deaths caused by ischemic heart disease was found to vary greatly from place to place. Trinidad and Tobago showed by far the
McGlashan l CAUSES OF DEATH IN THE CARIBBEAN 217 Figure 2b. The percentages of crude annual mortality among females due to each
of the specific causes examined in the study area, by age.
0 /
IS-
VEHICLE
ACCIDENTS
0.66%
O lo-
5-
lo - HEART DISEASE
7.01%
s-
“-
DIABETES 7.05%
10- 5-
25- ALL CANCERS
11.94%
20- 15 - 10- 5-
0 ,
o-4 5-9 10-74 20-24 30-34 40-44 SO-54 60-64 70-74 80-84 85+ YEARS OF AGE (FEMALES)
Diabetes Mellitus
Diabetes mellitus caused the death of more women than men in the area studied. In fact, diabetes in women (producing a crude annual mortality of 44.4 deaths per 100,000) out- stripped heart disease (producing a crude an- nual mortality of 44.2 deaths per lOO,OOO), and in older age groups approached the mor- tality caused by all cancers (see Figure 1B). The impact of diabetes, expressed as the per- centage of deaths from all causes that were due to diabetes, was greatest in the 55-59 age group for both males and females, the disease accounting for 7.8 per cent of all male deaths
and 13.9 per cent of all female deaths in this age group (see Figure 2).
Regarding variations by area, Trinidad and Tobago registered the highest overall percent- age of diabetes-caused deaths, followed by Barbados and Jamaica. Saint Lucia and Gre- nada showed the lowest overall percentages of diabetes-caused deaths in both sexes.
Motor Vehicle Accidmh
218 PAHO BULLETIN l vol. 16, no. 3, 1982
Figure 3. The percentage contributions of each of the four causes to overall mortality in each of the countries and territories studied, by sex. (Cb = Overall Caribbean study area, An = Antigua, Ba =
Barbados, Do = Dominica, Gr = Grenada, Ja = Jamaica, M6 = Montserrat data too limited for confidence in statistical reliability, SK = St. Kitts-Nevis, SL = Saint Lucia,
SV = St. Vincent, and TT = Trinidad and Tobago.) %
-3O-
MALES
Cb
An
%
Gr Ja Mo’ SK SL SV
!
FEMALESTT
Motor Vehicle
n
Accidents
H
lschemic
Heart Disease
country and territory. However, these certifi- jurisdiction to make any statement about how cates list medical diagnoses, and so they may an injury was caused.
Table 3. Percentages of all deaths due to cancer, ischemic heart disease, diabetes mellitus, and motor vehicle accidents, by sex, in each of the 10 areas studied, showing the relative ranking of each area. Data are based on latter 1970s death certificate information.
Data for males Data for females
Ischemic heart Diabetes
cancera disease mellitus Motor vehicle accidents CalXd Ischemic heart disease Diabetes mellitus Motor vehicle accidents % of all Area % of all Area % of all Area % of all Area % ofall Area % of all Area % of all Area % ofall Area
deaths rank deaths rank deaths rank deaths rank deaths rank deaths rank deaths rank deaths rank
Y
Barbados Dominica Grenada Jamaica Montserratb
St. Kitts-Nevis
Saint Lucia St. Vincent Trinidad and
Tobago Average
(weighted for
population) 11.4 8.7 4.2 2.5 11.9 7.0 7.1 0.7
13.2 3 6.5 4 3.5 3’ 0.7 6c 13.6 2 3.3 9 5.9 4 0.3 5
15.3 1 10.6 2 3.5 3c 3.1 2 14.9 1 9.8 2 6.8 2 0.4 3c
10.9 4 3.0 9 2.6 6 0.8 5 10.0 5c 4.4 5 3.5 7 1.1 2
8.3 7c 5.2 6 1.6 8’ 0.7 6c 10.0 5c 4.3 6 3.4 8 0.1 7c
13.3 2 6.0 5 3.8 2 1.8 3 12.8 3 4.9 4 6.7 3 0.4 3c
11.2 - 5.9 - 3.6 - 1.0 - 9.0 - 5.1 - 7.3 - 0.3 -
9.1 5 8.6 3 2.1 7 0.1 9 9.3 7 6.9 3 4.0 6 - 9
6.6 9 4.9 7 1.6 8c 0.3 8 7.9 9 3.5 8 2.6 9 0.2 6
8.4 6 4.5 8 3.3 5 0.9 4 8.1 8 3.9 7 5.4 5 0.1 7c
8.3 7’ 14.4 1 5.7 1 4.5 1 10.7 4 11.8 1 9.6 1 1.4 1
=All malignant neoplasms.
220 PAHO BULLETIN l vol. 16, no. 3. 1982
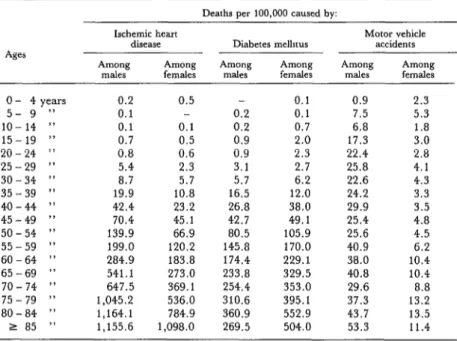
Table 4. Age-specific mortality from ischemic heart disease, diabetes mellitus, and motor vehicle accidents in different age groups of the whole study area population, by sex.
Deaths per 100,000 caused by:
Ages
Ischemic heart disease
Among Among
males females
Diabetes melbtus
Among Among
males females
Motor vehicle accidents
Among Among
males females
0- 4years 0.2
5-9 " 0.1
lo- 14 ” 0.1
15- 19 ” 0.7
20-24 ” 0.8
25-29 ” 5.4
30-34 ” 8.7
35-39 ” 19.9
40-44 ” 42.4
45-49 ” 70.4
50-54 ” 139.9
55-59 ” 199.0
60-64 ” 284.9
65-69 ” 541.1
70-74 ” 647.5
75-79 ” 1,045.Z
80-84 ” 1,164.l
285 ” 1,155.6
0.5 - 0.1 0.5 0.6 2.3 5.7 10.8 23.2 45.1 66.9 120.2 183.8 273.0 369.1 536.0 784.9 1,098.O 0.2 0.2 0.9 0.9 3.1 5.7 16.5 26.8 42.7 80.5 145.8 174.4 233.8 254.4 310.6 360.9 269.5
0.1 0.9 2.3
0.1 7.5 5.3
0.7 6.8 1.8
2.0 17.3 3.0
2.3 22.4 2.8
2.7 25.8 4.1
6.2 22.6 4.3
12.0 24.2 3.3
38.0 29.9 3.5
49.1 25.4 4.8
105.9 25.6 4.5
170.0 40.9 6.2
229.1 38.0 10.4
329.5 40.8 10.4
353.0 29.6 8.8
395.1 37.3 13.2
552.9 43.7 13.5
504.0 53.3 11.4
medically specific, usually classifying victims only as children under 15 or as male or female adults. Subsequent determination of the vic- tims’ ages from these records is therefore not possible.
To maintain comparability with the other three causes of death, the motor vehicle data shown in Figures 1 through 3 and in Tables 3 and 4 were derived from death certificates. These data show sex and age-related patterns that are quite different from those found for the three other causes of death. Specifically, as Table 4 and Figure 1 show, beyond age nine death rates were generally much higher among men than among women. For women, relatively high risk was experienced by the 5-9 year age group (5.3 deaths per 100,000); and while this rate was generally exceeded above age 55, it was not equalled by any group be- low that age. In sharp contrast, the early 5-9 male peak of 7.5 deaths per 100,000 was greatly exceeded by a rate of 17.3 in the 15-19 group, and the rate continued high thereafter, ranging from 22.4 deaths per 100,000 in the
20-24 age group to 53.3 in the group over 84 years old.
McGlashan l CAUSES OF DEATH IN THE CARIBBEAN 221
of motor vehicle mortality upon younger age groups is shown graphically in Figure 2.
Regarding geographic variations, Figure 3 indicates that Trinidad and Tobago again had the highest recorded mortality of the areas studied, and that Barbados was again in sec- ond place. The lowest recorded rates were found in St. Kitts-Nevis and Saint Lucia.
Information obtained from police reports, the alternative data source, is shown in Table 5. Except on Trinidad and Tobago, police in- variably recorded more road accident fatalities than were recorded as being due to this cause on death certificates. For the whole study area population, the ratio of police report mortality to death certificate mortality was 166: 100, the crude annual mortality indicated by the police report data being 17.5 deaths per 100,000 and that indicated by the death certificate data be- ing 10.6 per 100,000. In each case, the local differences permit an estimation of the degree of inaccuracy in the local compilations, since ideally the correlation between the two sets of data should be nearly perfect. Regarding the largest islands, the observed differences were small in the case of Trinidad and Tobago and relatively large in the case of Jamaica. Con- sidering the study area as a whole, however, a significant degree of correlation was observed between the two sets of data from the various localities studied (r = 0.764, p. <O.Ol). The ratio of police-reported injuries to certificated deaths was found to be 1,938:100, or 19.4 in- juries for each fatality. Overall, there appears to be a significant degree of correlation (r = 0.781, p<O.Ol) between the two sets of data from the 10 areas studied.
The degree of disagreement between the police reports and death certificates permits assessment of the reliability of the data ob- tained on any given island. The combined data also indicate the places with the most se- rious traffic accident problems. Specifically, regardless of which data are used, Trinidad and Tobago and Barbados emerge as having the highest rates of vehicular injury and death. Montserrat also appears to have a fairly
high rate of vehicular injury, but the vehicular death rate is relatively low. In contrast, the data give Jamaica the appearance of having a high vehicular death rate and a low rate of vehicular injury-a finding which suggests that routine traffic accidents in Jamaica, es- pecially those causing only slight injuries, are underreported. Several of the smaller islands (Dominica, Grenada, St. Kitts-Nevis, Saint Lucia, and St. Vincent) apparently have lower rates of injurious or fatal motor vehicle accidents per 100,000 inhabitants than the other areas studied.
Conclusions
In 1971 Omran (4) described a continuum of change in the mortality patterns for nations in various stages of development that theoret- ically permits the overall health status of each country to be assessed. For instance, Saint Lucia has a very high birth rate, very low cancer mortality, and low rates of death from heart disease, diabetes, and vehicular acci- dents. This implies quite a different set of vital circumstances than that prevailing on Trini- dad and Tobago, where the data indicate low crude birth and death rates but very high mor- tality from heart disease and vehicular acci- dents-the latter two being commonly asso- ciated with “modernization” and “develop- ment.”
Table 5. Data on average annual automobile accident fatalities and injuries derived from death certificates and police reports, by area.
Police report data Death certificate data
Adults killed Children Serious mju- Slight inju-
Average Crude annual per year killed per year Crude annual ties per year ries per year No. injured Population (in no. killed mortality (per (1975-1980
1oo,ooo)aBb
(1975-1980 mortality (1975-1980 (1975-1980 WltWOy
thousands) per year average) average) (per 100,000)= averagey average) per 100,000b
Antigua 72.3 2.2 3.04 5 4 12.4 49 131 248.8
Barbados 244.8 36.5 14.91 39 11 20.4 224 800 418.2
Dominica 80.0 4.6 5.75 8 5 16.2 26 27 66.2
Grenada 108.1 2.8 2.59 4 1 4.6 12 100 103.6
Jamaica 2,081.3 14.5 6.97 313 69 18.4 1,545 2,024 171.5
Montserrat 11.5 0.8 6.96 1 a.7 21 22 374.1
St. Kitts-Nevis 49.7 0.2 0.40 3 1 8.1 43 89 265.9
Saint Lucia 117.5 2.25 1.91 11 1 10.2 60 95 131.9
St. Vincent 113.2 3.25 2.87 5 1 5.3 50 103 135.1
Trinidad and
Tobago 1,098.2 223.33 20.34 179 36 19.6 877 4,770 514.2
Total 3,976.7 420.92 10.59 568 129 17.5 2,907 8,161 278.3
aCorrelation between coIumns 3 and 6 (crude annual mortality): r = 0.764, p<O.Ol.
McGlashan l CAUSES OF DEATH IN THE CARIBBEAN 223
ACKNOWLEDGMENTS
Financial support provided by the Com- sistance of Dr. P. J. S. Hamilton of the Ca- monwealth Foundation, leave of absence ribbean Epidemiology Center, Port-of-Spain, granted by the University of Tasmania, and and of Dr. M. U. Henry of the Pan American the cooperation extended by the West Indies Sanitary Bureau, Bridgetown, was particu- Health Statisticians and Medical Officers are larly valuable.
all gratefully acknowledged. The personal as-
SUMMARY - A preliminary comparison was made of mortality
from all causes and from four specific causes in 10 English-speaking countries and territories of the Caribbean. The death certificates and police re- ports used to gather data on overall mortality and mortality from cancer, ischemic heart disease, dia- betes mellitus, and automobile accidents demon- strated marked differences between the places stud- ied. For example, crude annual cancer mortality among males ranged from 132 deaths per 100,000 on Barbados to 51 deaths per 100,000 on Saint Lu- cia; similarly, crude annual cancer mortality among females ranged from 133 deaths per 100,000 on Barbados to 51 deaths per 100,000 on Saint Lu- cia. Male deaths from ischemic heart disease went from 100 per 100,000 on Trinidad and Tobago to 15 on Dominica, while female deaths from the same
cause went from 87 per 100,000 on Barbados to 21 on Antigua. Male diabetes mellitus mortality var- ied from 41 deaths per 100,000 on Montserrat to 11 on Granada, and female diabetes mellitus mortality varied from 85 deaths per 100,000 on Montserrat to 17 on Saint Lucia. The rate of road accident deaths was notably lower among women than among men; but the death rates in different places also varied widely-male mortality ranging from 32 deaths per
100,000 on Trinidad and Tobago to 1 on St. Kitts- Nevis, and female mortality ranging from 9 deaths per 100,000 on Trinidad and Tobago to none on St. Kitts-Nevis. It is suggested that these data might be used to position the different areas involved along a continuum of changing mortality patterns that par- allel the different areas’ varying degrees of socio- economic development.
REFERENCES
(1) Pan American Health Organization. Health Switzerland, 1980.
Conditions in the Americas, 1973-1976. PAHO Sci- (3) McGlashan, N. D. Alcohol-related MoTtalig in entific Publication No. 364. Washington, D.C., Tammnia, 1970, 1976. The Alcohol and Drug De-
1978. pendency Board of Tasmania; Hobart, Australia,
(2) World Health Organization. Sixth Report on the 1979.