Me asure me nt o f the ultraso nic
pro pe rtie s o f human co ro nary
arte rie s
in vitro
with a 50-MHz
aco ustic micro sco pe
1Programa deEngenharia Biomédica, CO PPE, Universidade Federal do Rio de Janeiro,
Rio de Janeiro, RJ, Brasil
2Sunnybrook and Women’s College Health Sciences Centre,
Department of Medical Biophysics, University of Toronto, Toronto, O ntario, Canada 3Vascular Research Laboratory, Department of Laboratory Medicine and Pathobiology,
Banting and Best Diabetes Centre, The Toronto Hospital Research Institute, University of Toronto, Toronto, O ntario, Canada
J.C. Machado1, F.S. Foster2 and A.I. Gotlieb3
Abstract
Ultrasonic attenuation coefficient, wave propagation speed and inte-grated backscatter coefficient (IBC) of human coronary arteries were measured in vitro over the -6 dB frequency bandwidth (36 to 67 MHz) of a focused ultrasound transducer (50 MHz, focal distance 5.7 mm, f/number 1.7). Corrections were made for diffraction effects. Normal and diseased coronary artery sub-samples (N = 38) were obtained from 10 individuals at autopsy. The measured mean ± SD of the wave speed (average over the entire vessel wall thickness) was 1581.04 ± 53.88 m/s. At 50 MHz, the average attenuation coefficient was 4.99 ± 1.33 dB/mm with a frequency dependence term of 1.55 ± 0.18 determined over the 36- to 67-MHz frequency range. The IBC values were: 17.42 ± 13.02 (sr.m)-1 for thickened intima, 11.35 ± 6.54 (sr.m)-1 for fibrotic intima, 39.93 ± 50.95 (sr.m)-1 for plaque, 4.26 ± 2.34 (sr.m)-1 for foam cells, 5.12 ± 5.85 (sr.m)-1 for media and 21.26 ± 31.77 (sr.m)-1 for adventitia layers. The IBC results indicate the possibility for ultra-sound characterization of human coronary artery wall tissue layer, including the situations of diseased arteries with the presence of thickened intima, fibrotic intima and plaque. The mean IBC normal-ized with respect to the mean IBC of the media layer seems promising for use as a parameter to differentiate a plaque or a thickened intima from a fibrotic intima.
Co rre spo nde nce
J.C. Machado
Programa deEngenharia Biomédica CO PPE, UFRJ
Caixa Postal 68510 21945-970 Rio de Janeiro, RJ Brasil
Fax: + 55-21-2562-8591 E-mail: jcm@ peb.ufrj.br
Research supported by PRO NEX/ FINEP, CAPES, Universidade Federal do Rio de Janeiro, and the Medical Research Council of Canada. F.S. Foster is a Terry Fox Scientist of the National Cancer Institute of Canada.
Received August 29, 2001 Accepted May 29, 2002
Ke y words
•Acoustic microscopy •Coronary artery wall •Ultrasound tissue
characterization •Integrated backscatter
coefficient
Intro ductio n
Atherosclerosis, a disease of the arterial wall, is the most common vascular disease in Western society. It is characterized by the formation of plaques that range from early stage lesions or fatty streaks to complex late stage lesions that may contain fibrous tissue,
occlusion, most commonly due to the forma-tion of thrombus after plaque fracture or rupture (2).
The procedure to treat diseased arteries with atherosclerotic plaque requires not only visualization of the lesion, but also charac-terization of the plaque contents. Conven-tional approaches such as X-ray contrast angiography permit excellent visualization of the lumens of critical arteries such as the coronaries but provide limited information on the structure and properties of any plaque that may be present (3). On the other hand, considerable evidence now exists to con-clude that intravascular ultrasound imaging is a more sensitive indicator of calcium con-tent, residual plaque burden, tissue trauma, and final lumen dimensions than angiogra-phy (4,5).
Ultrasonic characterization of vascular tissue has evolved from the use of frequen-cies between 4 and 15 MHz, (6-8) to the 20-to 27-MHz range (9,10), and more recently between 25 and 65 MHz (11-13). The bene-fits of using higher frequencies are the im-provement of image quality as well as of the characterization of the layered structure of the vessel wall and consequently of the ath-erosclerotic plaque. Although most of the current intravascular ultrasound machines operate close to 30 MHz, recent commercial prototype systems offer the option to operate at both 30 and 40 MHz (14).
Despite the development of intravascular ultrasound machines operating at frequen-cies higher than 30 MHz, our understanding of the scattering and attenuation processes in normal and diseased coronary arteries is very limited. Also, the relative levels of backscat-ter from critical structures such as early and late thrombus, soft or fibrous plaque, blood, and intima, media and adventitia layers are not well understood, particularly in the high frequency range. Previous studies refer to in
vitro characterization of human carotid (11)
and femoral arteries (11,13,15) and to the quantification of the lipid-rich intima layer
of atherosclerotic rabbit aortas (12). The present study reports absolute meas-urements of ultrasonic backscattering prop-erties of human coronary artery walls, by means of the integrated backscatter coeffi-cient (IBC) as a function of depth in the vessel wall. The IBC reflects the acoustic characteristic of the tissue related to its ca-pacity of sending backwards an acoustic power in response to an incident wave.
A recent study by Machado and Foster (16) developed the basic formulation and the setup used for experimental measurement of the IBC profile of human coronary arteries
in vitro. The method was tested with three
samples of vessel wall. The present study applies the method to a larger number of vessel samples, including different types of plaque on the arterial wall.
Data were obtained at 50 MHz and with a population of 38 vessel wall samples of ex vivo coronary arteries containing histologi-cal findings of thickened intima, fibrotic intima, plaques and foam cells. Appropriate diffraction correction was implemented to compensate for the diffraction effects im-posed by the spherically focused ultrasonic transducer operating with a center frequency of 50 MHz and an f/number of 1.7. Data for average wave speed and average attenuation coefficient, at 50 MHz, across the vessel wall are also presented.
Mate rial and Me thods
Sample preparation
formalin and paraffin embedded, and sec-tions were stained with Movat stain for his-tological analysis. Photographs of the sec-tions, printed with a magnification close to the ultrasound biomicroscope (UBM) im-ages, were prepared for comparison with the ultrasound images and for determination of the layers present on the wall.
Prior to the ultrasound measurements, the samples were brought to room tempera-ture and a sub-sample measuring approxi-mately 2 x 3 mm was cut and placed in the sample holder. Table 1 presents a list of all the samples together with the sub-samples they provided. The histological result for each sub-sample is also given in the table.
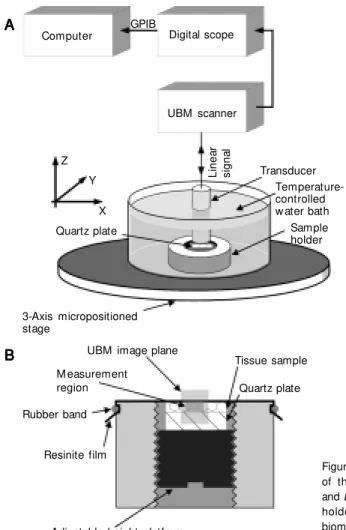
Measurement system
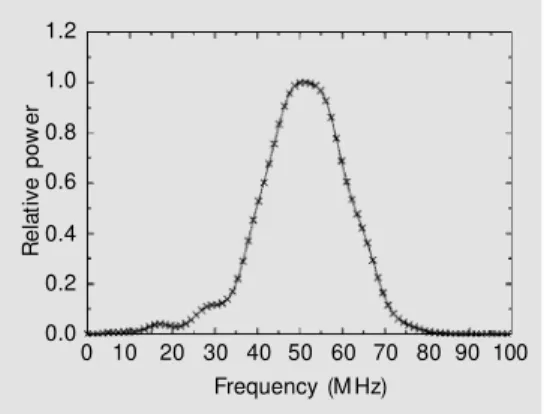
An overview block diagram depicting the experimental setup is presented in Figure 1A, whereas the details of the sample holder are shown in Figure 1B. The measurement system consisted of a UBM working with a focused polyvinylidene fluoride transducer (receiving solid angle of 0.27 sr, aperture of 3.1 mm, focal depth of 5.7 mm, center fre-quency ƒc = 50 MHz and -6 dB frequency bandwidth of 36 to 67 MHz). Figure 2 shows the frequency spectrum of the pulse trans-mitted by the transducer which was obtained from the echo from a quartz plate positioned at the focus and perpendicular to the beam axis. A review of ultrasound biomicroscopy is given by Foster et al. (19).
A temperature-controlled microposi-tioned tissue cell was used for data collec-tion. The artery samples, placed over a flat quartz plate with the intima layer upwards, were covered with a 15-µm thick resinite membrane (AEP Industries Inc., West Hill, ON, Canada) and immersed in saline at 37ºC. The adjustable height platform allowed ad-justment of the necessary contact pressure between the sample and the membrane to anchor the sample and maintain a flat sur-face. Prior to data acquisition, the UBM
Table 1. Coronary artery samples used in the present study w ith patient age and related sub-samples, defined by a number, classified according to their histological results.
Sample Age Sub-sample number and histological result Ns
(years)
Thickened Fibrotic Plaque Foam cell intima intima presence presence
I 77 1, 2 25, 26, 27, 28 25, 26, 27, 28 6
II 39 3, 4, 5, 6 29 5
III 38 7, 8, 9, 10, 11, 12 30, 31 8
IV 64 13, 14, 15, 16, 17 13, 14, 15 13, 14, 15 5
V 73 18, 19 34, 35 19 4
VI 67 20 20 1
VII 73 21, 22 36 37 4
VIII 73 23, 24 2
IX 79 32, 33 33 2
X 88 38 1
Amount 25 12 12 3 38
Ns = the number of sub-samples from the same sample. Right coronary arteries are: I,
II, III, IV, IX, and left anterior descending coronary arteries are: V, VI, VII, VIII, X.
A AA A A
B BB B B
Temperature-controlled w ater bath Transducer
Sample holder
L
in
e
a
r
s
ig
n
a
l
3-Axis micropositioned stage
Digital scope Computer
GPIB
UBM scanner
Z
Y
X
UBM image plane
M easurement region
Rubber band
Resinite film
Adjustable height platform for tissue sample
Figure 1. A, Block diagram of the experimental setup and B, detail of the sample holder. UBM , ultrasound biomicroscope; GPIB, gen-eral purpose interface bus. Tissue sample
from a region inside the sample and at a depth
r
( = ct/2 and c = wave speed) is proportional to the mean rf-backscattered power signal, and is determined as:8 8 2
1 1
1
( ) ( , , )
64
s s i j
i j
V r U x y r
= =
=
å å
Equation 1The IBC as a function of depth,
IBC
(
r
)
, is obtained from Equation 1 afternormaliz-ing 2
( ) s
V r with the transducer receiver solid
angle, the diffraction correction function, the acoustic wave speed and the incident acoustic energy. After normalization, the re-sult must also be corrected for the effects of a focused beam reflected on a flat plane. Details about the calculation of IBC(r)
from 2
( )
s
V r are presented in Ref. 16.
Wave speed, sample thickness and at-tenuation coefficient were calculated using the approaches previously described by Lockwood et al. (11) and Ye et al. (20). The mean values of the wave speed along the sample wall, of the wall thickness and of the attenuation coefficient were obtained by av-eraging the corresponding values obtained from the 64 measurements.
For most soft tissues and body liquids, the frequency dependence of attenuation α(ƒ) can be expressed as:
0 0
( )
cc
f
f
f
f
f
γγ γ
α
=
α
=
α
æ
ç
ö
÷
è
ø
Equation 2where ƒ is the ultrasonic frequency, α0 is the
attenuation coefficient at 1 MHz and γ is the frequency dependence, usually between 1 and 2. The attenuation coefficient at trans-ducer center frequency is αc = α0ƒ
y c.
Re sults
The IBC profile was obtained for the 38 coronary artery sub-samples presented in Table 1. Three examples of the plots for the IBC are presented: one with a mildly thick-ened intima, in Figure 3a, one with both scanner provided overview images of the
membrane to insure the flatness of its sur-face and of the tissue microstructure to pro-vide accurate targeting of homogeneous tis-sue regions for quantitative analysis. The front end of the UBM scanner was fixed to a three-axis micropositioning system to per-mit accurate data acquisition.
The rf signals resulting from reflections on the membrane and quartz surface plus backscattering from the tissue were recorded using a digital oscilloscope and collected from 64 positions over an 8 x 8 matrix with a 50-µm separation. In order to collect the rf signal over the sample thickness, the signal window on the oscilloscope was 1 µs (≅ 787.5 µm) for narrow samples, and 2 µs (≅ 1575 µm) for wider ones. These settings provided sampling frequencies of 1000 and 500 MHz, respectively. The sampled rf sig-nals were transferred by a general purpose interface bus to the microcomputer for fur-ther processing and calculations.
The rf-backscattered signals were com-pensated for attenuation using an inverse attenuation filter as described by D’Astous and Foster (17). The resulting signal Vs(t) was squared and the product passed through a 4th order low-pass Butterworth filter (cut-off at 50 MHz) to eliminate the high fre-quency components. The filter output pro-vided 64 signals of the Us(xi,yj,t) form with coordinates xi and yj (l≤i,j≤8) on a plane perpendicular to the transmitted beam z-axis. The mean acoustic power backscattered
R
e
la
ti
v
e
p
o
w
e
r
1.2
1.0
0.8
0.6
0.4
0.2
0.0
0 10 20 30 40 50 60 70 80 90 100 Frequency (M Hz)
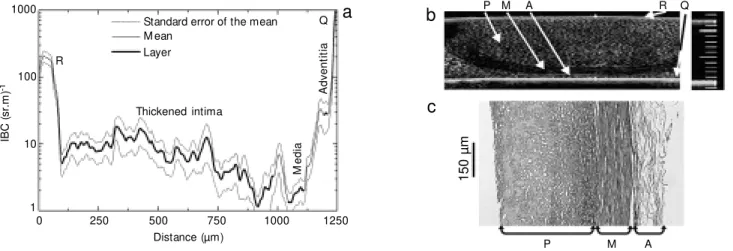
thickened intima and a plaque, Figure 4a, and the third one, in Figure 5a, with a highly significantly thickened intima. Figures 3b-5b and 3c-5c correspond to the UBM and histological images, respectively. In both fig-ures, the segment of the IBC plot corre-sponding to either a plaque or a tissue wall layer contains a darker line. Localization and definition of the length of each segment were determined considering the relative di-mensions of each layer in both UBM and histological images. In most situations, the media layer was the easiest to identify due to the marked peaks caused by the strong back-scattering from both the internal and exter-nal elastic lamina at the IBC plots.
The results for the IBC layer segment of each sub-sample were determined and are reported as mean ± SD. In Figure 6A they are presented for the intima, media and adventi-tia layers of the 24 sub-samples containing only thickened intima. Similar results are also presented in Figure 6B for the 12 sub-samples containing a fibrotic intima. Figure 6C contains similar plots for the plaque, media and adventitia layers of the 12 sub-samples with plaque, and Figure 6D illus-trates the results for plaque containing foam cells, media and adventitia layers of sub-samples 13, 14 and 15.
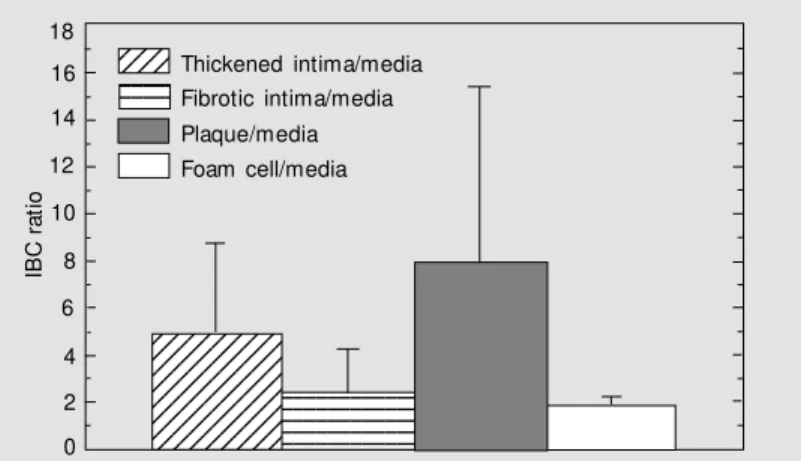
The ratio between the mean IBC for one of the innermost layers (thickened intima, fibrotic intima, plaque or foam cell) and the mean IBC of the media layer belonging to the same sub-sample was calculated. The result, presented in Figure 7, is expressed in terms of the mean and standard deviation of the IBC ratio distribution for each group: thickened intima, fibrotic intima, plaque and foam cells. These results allow us to com-pare the scattering strength of one of the innermost layer to the media layer of the same sub-sample, independently of the indi-vidual artery samples. On average, the plaque layer scatters 8 times more than the media layer, the thickened intima 5 times more, the fibrotic intima 2.5 times more and the foam
cells 1.9 times more.
Wave speed (c), attenuation coefficient at 50 MHz (αc) and the frequency depend-ence term (γ) of the attenuation coefficient did not present any correlation with the pres-ence or abspres-ence of thickened intima, fibrotic intima, plaque or foam cells on the artery wall. Mean ± SD for c, αc, and γ were measured over the sub-sample population (N = 38) and the results were 1581.04 ± 53.88 m/s, 4.99 ± 1.33 dB/mm and 1.55 ± 0.18, respectively.
D iscussio n
Ultrasound was used at 50 MHz to char-acterize the tissue wall of ex vivo human coronary arteries. The results, presented in terms of ultrasound wave speed, attenuation coefficient and frequency dependence term of the attenuation coefficient, did not show a clear distinction between the presence of different types of intima layer disease: thick-ened intima, fibrotic intima, plaque and foam cell. Nevertheless, a more realistic differen-tiation was obtained with the IBC plots, as presented in Figures 3a-5a. It is possible to differentiate the backscattering characteris-tics between the layers that constitute the vessel wall. A strong backscattering from both the internal and external elastic lamina was noticed in almost all of the sub-samples. With disease progression, the reflections from the internal and external elastic lamina be-came less pronounced and the differentia-tion between media and adventitia and in-tima became more difficult, as shown in Figure 5a. The IBC varied not only in the same layer, but also among the sub-samples from the same individual sample and, of course, among the samples from different individuals. Table 2 summarizes the IBC values (mean and standard deviation) for all layers.
co-Figure 5. Same as in co-Figure 3, but for a severely diseased coronary artery. The intima layer is absent and plaque (P) is present. The IBC plot is confined laterally by the reflections from the resinite membrane (R) and quartz plate (Q) show n in a. Scale for UBM : 1 div. = 100 µm.
Figure 4. Same as in Figure 3, but for a diseased coronary artery w ith intimal thickening and deposited plaque (P). Reflection from the resinite membrane is not present in a. Scale for UBM : 1 div. = 100 µm.
Figure 3. a, Integrated backscatter coefficient (IBC) profile across the vessel w all layers; b, ultrasound biomicroscope (UBM ) image; c, histological image of an artery w all including the intima (I) at an early stage of thickening, media (M ), adventitia (A), internal (IEL) and external (EEL) elastic lamina. The IBC plot is confined laterally by the reflections from the resinite membrane (R) and quartz plate (Q) show n in a. Scale for UBM : 1 div. = 100 µm.
b
c
P M A
P M A R Q
IB
C
(
s
r.
m
)
-1
1000
Standard error of the mean M ean
Layer IEL
R
EEL
Adventitia
M edia Thickened intima
Q
100
10
1
0 100 200 300 400 500 600
Distance (µm)
a
IB
C
(
s
r.
m
)
-1
1000
a
Standard error of the mean M ean
Layer
IEL
EEL
Adventitia M edia
Thickened intima
Q
100
10
1
0 100 200 300 400 500 600 Distance (µm) Plaque
700 800
IB
C
(
s
r.
m
)
-1
1000
a
Standard error of the mean M ean
Layer R
A
d
v
e
n
ti
ti
a
Thickened intima
Q
100
10
1
0 250 500 750 1000 1250
Distance (µm)
M
e
d
ia
c
IE
L
E
E
L
5
0
µ
m
I M A
b
b
c
I M A
P
1
5
0
µ
Figure 6. A, Bar graph for the integrated backscatter coefficient (IBC) (mean ± SD) of thickened intima, media and adventitia layers of sub-samples 1-24.
B, Bar graph for the IBC (mean ± SD) of fibrotic intima, media and adventitia layers of sub-samples 25-36. C, Bar graph for the IBC (mean ± SD) of plaque, media and adventitia layers of sub-samples 13-15, 19-20, 25-28, 33, and 37-38. D, Bar graph for the IBC (mean ± SD) of foam cell, media and adventitia layers of sub-samples 13-15.
Figure 7. Bar graph for the integrated backscatter coefficient (IBC) ratio (mean ± SD) betw een thickened intima, fibrotic intima, plaque and foam cell layers and the media layer of corresponding sub-samples.
Table 2. Integrated backscatter coefficient (IBC) for the different layers of the coronary artery sub-samples.
Layer IBC (sr.m)-1 N
Thickened intima 17.42 ± 13.02 24 Fibrotic intima 11.35 ± 6.54 12
Plaque 39.93 ± 50.95 12
Foam cell 4.26 ± 2.34 3
M edia 5.12 ± 5.85 38
Adventitia 21.26 ± 31.77 38
Data are reported as means ± SD. N represents the amount of sub-samples in each layer.
Sub-sample number 12 12 12 12 12 12 1 1 1 1 1 1 1 1 1 1 1 1 1 1 12 12 12 12 12 12 12 1 1 1 1 1 1 1 1 1 1 1 1 1 1 1 1 1 1 1 1 1 1 1 12 12 12 12 12 1 1 1 1 1 1 1 1 1 1 1 1 12 12 12 12 12 12 12 1 1 1 1 1 1 1 1 12 12 12 1 1 1 1 1 1 12 12 12 12 12 12 1 1 1 1 1 1 1 1 1 1 1 1 1 1 12 12 12 12 12 12 1 1 1 1 1 1 1 1 12 12 12 12 12 12 1 1 1 1 1 1 1 1000 IB C ( s r. m ) -1 100 10 1 1234 1234 1234 Thickened intima M edia Adventitia
0 2 4 6 8 10 12 14 16 18 20 22 24 Sub-sample number 1000 100 10 1 12 12 12 12 12 12 12 12 12 12 12 12 12 12 12 12 12 12 12 12 12 12 12 12 12 12 12 12 12 12 12 12 12 12 12 12 12 12 12 12 12 12 12 12 12 12 12 12 12 12 12 12 12 12 12 12 12 12 12 12 12 12 12 12 12 12 12 12 12 12 12 12 12 12 12 12 12 12 12 12 12 12 12 12 123 123 Fibrotic intima M edia Adventitia
24 25 26 27 28 29 30 31 32 33 34 35 36 37 Sub-sample number 1000 100 10 1 1 1 1 1 1 1 1 1 1 1 1 1 1 1 1 1 1 1 1 1 1 1 1 1 1 1 1 1 1 1 1 1 1 1 1 1 1 1 1 1 1 1 1 1 1 1 1 1 1 1 1 1 1 1 1 1 1 1 1 1 1 1 1 1 1 1 1 1 1 1 1 1 1 1 1 1 1 1 1 123 123 123 Plaque M edia Adventitia
13 15 17 19 21 23 25 27 29 31 33 35 37 39
18 16 14 IB C r a ti o 1234567890123 1234567890123 1234567890123 1234567890123 1234567890123 123456789 123456789 123456789 123456789 123456789 123456789 123456789 123456789 1234 1234 1234 123456 123456 123456 Thickened intima/media Fibrotic intima/media Plaque/media Foam cell/media 12 10 8 6 4 2 0 A B C 1234 1234 M edia 1000 100 10 1 1234 1234 1234 12 12 12 123 123 123 123 123
12 13 14 15 16
Sub-sample number
D Foam cell
efficients of the wall layers. The plaque layer backscatters more signal than all other lay-ers. On the other hand, the media and foam cell layers backscatter less than the other ones. In fact, out of 38 sub-samples only 4 (numbers 7, 8, 9 and 10 in Figure 6A) pro-vided an IBC larger than that for the adven-titia layer and only 2 (numbers 31 and 33 in Figure 6B) provided higher IBC than that of the fibrotic intima layer. The IBC for the media layer of human coronary arteries were slightly lower with previous measurements of 20 (sr.m)-1 obtained in vitro and at 50
MHz by Lockwood et al. (11) for the media layer of human femoral arteries.
The data presented in Table 2 agree with the results shown in Figure 7, which indicate that the normalization of the IBC from one layer with the IBC of the media layer of the same sub-sample tends to compensate for the differences in the backscattering charac-teristics among sub-samples.
The t-test (P<0.05) applied to the data of Figure 7 resulted in significantly different
means for the IBC ratio of thickened intima/ media and fibrotic intima/media. The same result applies to the means of the IBC ratio of fibrotic intima/media and of plaque/media. On the other hand, there was no significant difference between the means of the IBC ratio for the thickened intima/media and for the plaque/media. The test was not applied to the IBC ratio of foam cell/media because of the small number, only three, of experi-mental results.
In conclusion, this work presented the measurements for the IBC profile of human coronary arteries and the results indicate the possibility to characterize the wall tissue layer by ultrasound.
Ackno wle dgm e nts
The authors are grateful to Kasia A. Harasiewicz and Peter Faure for technical support, and to the Toronto Hospital for the tissue samples supplied.
Re fe re nce s
1. Cotran RS, Kumar V & Robbins SL (1989). Blood vessels. In: Robbins SL (Editor),
Robbins Pathologic Basis of Disease.4th edn. W.B. Saunders, Philadelphia, PA, USA.
2. Stary HC (1989). Evolution and progres-sion of atherosclerotic leprogres-sions in coronary arteries of children and young adults. Ar-teriosclerosis,9 (Suppl I): I-19-I-32. 3. Eusterman JH, Achor RWP, Kincaid OW
& Brow n Jr AL (1962). Atherosclerotic dis-ease of the coronary arteries: A patho-logic-radiologic study. Circulation, 26: 1288-1295.
4. M intz GS, Popma JJ, Pichard AD, Kent KM , Salter LF, Chuang YC, Griffin J & Leon M B (1996). Intravascular ultrasound predictors of restenosis after percutane-ous transcatheter coronary revasculariza-tion. Journal of the American College of Cardiology, 27: 1678-1687.
5. M intz GS, Popma JJ, Pichard AD, Kent KM , Salter LF, Chuang YC, DeFalco RA & Leon M B (1996). Limitations of
angiogra-phy in the assessment of plaque distribu-tion in coronary artery disease: a system-atic study of target lesion eccentricity in 1446 lesions. Circulation, 93: 924-931. 6. Landini L, Sarnelli R, Picano E & Salvador
M (1986). Evaluation of frequency de-pendence of backscatter coefficient in normal and atherosclerotic aortic w alls.
Ultrasound in M edicine and Biology, 12: 397-401.
7. Barzilai B, Saffitz JE, M iller JG & Sobel BE (1987). Quantitative ultrasonic character-ization of the nature of atherosclerotic plaques in human aorta. Circulation Re-search, 60: 459-463.
8. Greenleaf JF, Duck FA, Samayoa WF & Johnson SA (1974). Ultrasound data ac-quisition and processing system for ath-erosclerotic tissue characterization. Ultra-sonics Symposium Proceedings, 1: 738-743.
9. De Kroon M G, Van Der Wal LF, Gussen-hoven WJ & Bom N (1991). Angle-de-pendent backscatter from the arterial w all.
Ultrasound in M edicine and Biology, 17: 121-126.
10. Potkin BN, Keren G, Bartorelli AL, M intz GS & Leon M B (1992). M orphologic char-acterization of human coronary athero-sclerosis by high-frequency intravascular ultrasound. In: Tobis JM & Yock PG (Edi-tors), Intravascular Ultrasound Imaging. Churchill Livingstone, New York, NY, USA.
11. Lockw ood GR, Ryan LK, Hunt JW & Fos-ter FS (1991). M easurement of the ultra-sonic properties of vascular tissues and blood from 35-65 M Hz. Ultrasound in M edicine and Biology, 17: 653-666. 12. Shepard RK, M iller JG & Wickline SA
(1992). Quantification of atherosclerotic plaque composition in cholesterol-fed rab-bits w ith 50-M Hz acoustic microscopy.
Art eriosclerosis and Throm bosis, 12: 1227-1234.
using backscattered radio frequency sig-nals (25-56 M Hz) from human aortae in vitro. Ultrasound in M edicine and Biology, 23: 215-229.
14. Foster FS, Knapik DA, M achado JC, Ryan LK & Nissen SE (1997). High frequency intracoronary ultrasound imaging. Semi-nars in Interventional Cardiology, 2: 33-41.
15. Bridal SK, Tousaint JF, Raynaud JS, Fornès P, Willig AL & Berger G (1998). US backscatter and attenuation 30 to 50 M Hz and M R T2 at 3 tesla for differentiation of atherosclerotic artery constituents in vi-tro. IEEE Transactions on Ultrasonics
Fer-roelectrics and Frequency Control, 45: 1517-1525.
16. M achado JC & Foster FS (2001). Ultra-sonic integrated backscatter coefficient profiling of human coronary arteries in vi-tro. IEEE Transactions on Ultrasonics Fer-roelectrics and Frequency Control, 48: 17-27.
17. D’Astous FT & Foster FS (1986). Fre-quency dependence of ultrasound attenu-ation and backscatter in breast tissue. Ul-trasound in M edicine and Biology, 12: 795-808.
18. Foster FS, Strban M & Austin G (1984). The ultrasound microscope: initial studies
of breast tissue. Ultrasound Imaging, 6: 243-261.
19. Foster FS, Pavlin CJ, Harasiew icz KA, Christopher DA & Turnbull DH (2000). Ad-vances in ultrasound biomicroscopy. Ul-trasound in M edicine and Biology, 26: 1-27.