BIODIVERSITY ANALYSES
DINIZ-FILHO, J. A. F.1,2 and TÔRRES, N. M.3
1Departamento de Biologia Geral, ICB, Universidade Federal de Goiás, C. P. 131, CEP 74001-970, Goiânia, GO, Brazil 2Departamento de Biologia, MCAS/PROPE, Universidade Católica de Goiás, Goiânia, GO, Brazil
3Programa de Pós-Graduação em Biologia Animal, UnB, Brasília, DF, Brazil
Correspondence to: José Alexandre F. Diniz-Filho, Dept. de Biologia Geral, ICB, Universidade Federal de Goiás, CEP 74001-970, Goiânia, GO, Brazil, e-mail: [email protected]
Received July 13, 2004 – Accepted December 15, 2004 – Distributed August 31, 2006 (With 2 figures)
ABSTRACT
Although in most recent broad-scale analyses, diversity is measured by counting the number of species in a given area or spatial unity (species richness), a ‘top-down’ approach has been used sometimes, counting higher-taxon (genera, family) instead of species with some advantages. However, this higher-taxon approach is quite empirical and the cut-off level is usually arbitrarily defined. In this work, we show that the higher-taxon approach could be theoretically linked with models of phenotypic diversification by means of phylogenetic autocorrelation analysis in such a way that the taxonomic (or phylogenetic) rank to be used could not be necessarily arbitrary. This rank expresses past time in which taxa became independent for a given phenotypic trait or for the evolution of average phenotypes across different traits. We illustrated the approach by evaluating phylogenetic patches for 23 morphological, ecological and behavioural characters in New World terrestrial Carnivora. The higher-taxon counts at 18.8 mya (SL) defined by phylogenetic correlograms are highly correlated with species richness (r = 0.899; P < 0.001 with ca. 13 degrees of freedom by taking spatial autocorrelation into account). However, SL in North America is usually larger than in South America. Thus, although there are more species in South and Central America, the fast recent diversification that occurred in this region generated species that are “redundant” in relation to lineages that were present at 18.8 my. BP. Therefore, the number of lineages can be comparatively used as a measure of evolutionary diversity under a given model of phenotypic divergence among lower taxonomic units.
Keywords: higher-taxon approach, species richness, phylogenetic diversity, phylogenetic autocorrelation, phenotypic evolution, Carnivora.
RESUMO
Autocorrelação filogenética e a interpretação evolutiva para análise de número de taxa em análises de biodiversidade
levando em consideração a autocorrelação espacial). O número de linhagens foi maior na América do Norte, de modo que embora haja mais espécies na região tropical, estas representam eventos recentes de diversificação, com espécies redundantes em relação às linhagens que existiam há 18,8 milhões de anos atrás. O número de linhagens definido por autocorrelação pode ser utilizado como uma medida de diversidade evolutiva sob um dado modelo de divergência fenotípica.
Palavras-chave: riqueza de espécies, autocorrelação, diversidade fenotípica, carnivora, número de linhagens, hierarquia taxonômica.
spatial patterns of diversity are shifted from current processes to past (historical) explanations, with some loss of information. Thus, the main problem with this higher-taxon approach is the choice of the rank, that is completely arbitrary most of the time, and then interpretations should be made carefully (Williams & Gaston, 1994).
In this paper, we show that the higher-taxon approach could be theoretically linked with models of phenotypic diversification in such a way that the taxonomic (or phylogenetic) rank to be used could not necessarily be arbitrary or used only empirically. This rank can express the past time at which taxa become independent for a given phenotypic trait or for the evolution of average phenotypes across different traits. Taking this into account, the number of lineages (and not arbitrarily defined higher level taxonomic groups) can be comparatively used as a measure of evolutionary diversity under a given model of phenotypic divergence among species.
THEORETICAL BACKGROUND Different “types” of phenotypic traits (e.g., morphological, behavioral, life-history) tend to possess distinct evolutionary patterns, reflecting distinct microevolutionary processes explaining interspecific variation (e.g. Gittleman et al., 1996). Various phylogenetic comparative methods have been designed to understand these variations, both theoretically and analytically.
Using simulation procedures, Diniz-Filho (2001) showed that phylogenetic autocorrelation analysis could be useful to detect variations in patterns and processes underlying phenotypic variation (see also Gittleman & Kot, 1990; Gittleman et al., 1996). Phylogenetic autoco-rrelation (usually estimated using Moran’s I coefficient) measures the correlation between pairs of taxa situated at a given phylogenetic distance, for a given phenotypic trait. The relationship between INTRODUCTION
In most recent broad-scale analyses, diversity is measured by counting the number of species in a given area or spatial unity (species richness). In some instances, however, a ‘top-down’ approach (Williams & Gaston, 1994; Gaston, 1997) has been used, counting higher-taxon (genera, family) instead of species, with some advantages. Most of all, since many groups of organisms are poorly known at species level, it would be cheaper and more reliable to count genera or families, and not species. Consequently, analytical efforts could increase and it would be possible and feasible to map biodiversity patterns for many diversified taxonomic groups on global scales. Many previous studies (e.g., Balmford et al., 2000; Grelle, 2002, and references therein) showed that these counts are a good surrogate for species richness in such a way that higher-taxon estimates of biodiversity could be used for understanding broad-scale diversity patterns and for conservation applications.
Moran’s I and time from divergence is called a phylogenetic correlogram. The first distance class in the correlogram usually contains most of the variation at lower taxonomic levels (i.e., among species within a genus or within closely related genera), whereas the last distance class contains the divergence among higher clades of the group (i.e., distantly related families). Diniz-Filho (2001) proposed that changes in the correlogram profiles reduces the phylogenetic distance at which the correlogram profile crosses the value of Moran’s I under the null hypothesis of no-autocorrelation, called the “phylogenetic patch”, in an interpretation analogous of the one in spatial autocorrelation analyses (see Sokal & Jacquez, 1991; Diniz-Filho & Telles, 2002).
This phylogenetic patch can be interpreted as the distance in time above in which it is not possible to predict the trait value of one species based on the trait value in related taxa. It decreases as the evolutionary process becomes more conservative in terms of generating phenotypic diversification, or when traits evolve so fast that even closely related species are not similar for this trait. We propose here that this phylogenetic patch can be used as a cut-level to the level at which higher-taxon analysis should be conducted by considering the kind of ecological and evolutionary process that one wishes to conserve.
If a trait evolves quite fast under divergent adaptive processes in distinct lineages, it should retain no phylogenetic signal, and the phylogenetic patch tends to be zero, indicating that the similarity between closely related species is expected only if these species diverged very recently because the phylogenetic signal tends to be lost quickly under gradually higher restraining forces in the adaptive processes (Hansen & Martins, 1996). Taking this into account, the number of independent lineages for the trait under study tends to be actual species richness. Therefore, in a general sense, species richness is then the number of lineages at a phylogenetic patch of zero. On the other hand, more neutral traits tend to have a high phylogenetic signal, and thus would be relatively similar even when comparing pairs of closely related species, therefore a phylogenetic patch should be around t/2, where t is the time from root to tips (see Diniz-Filho, 2000, 2001).
In all cases above, the number of lineages at the phylogenetic patch will provide the number of independent lineages that must be conserved to maximize interspecific divergence for a given phenotypic trait and diversification model, in relation to ‘redundancy’ within these lineages. Thus, it provides a measure of the relative amount of evolutionary diversification for this phenotype and enables us to compare regions in terms of which one has more independent lineages and less redundancy below a given patch. This is the kind of information that is captured by the phylogenetic patch, and an average value calculated across different traits must express how the mean phenotype evolved. Another advantage of using the phylogenetic patch is that the unit for measuring evolutionary diversity (number of lineages) is directly comparable through time and with species richness.
APPLICATION
Data
Basic data used in this paper consist of 23 morphological, ecological and behavioral traits (Table 1) measured for the 70 species of New World terrestrial Carnivora (“Fissipeds”) (Mammalia), compiled from many distinct sources (see Diniz-Filho & Tôrres, 2002 and Tôrres & Diniz-Diniz-Filho, 2004 for details). The geographic range size of each 70 species (extend of occurrence) was determined by redrawing distribution maps of each species on a cylindrical equal-area projection map. After that, it is possible to obtain the presence-absence data for each of the 279 quadrats in a grid of 250 km of sides covering the New World (the ‘worldmap’ grid – Williams, 1992) and we counted both the species richness and any higher-taxon richness further defined (see below).
Methods
years, were defined by calibrating the tree using the best estimation of the age of each node. Due to different sample sizes (species) for each trait, different numbers of classes were used for each trait. Moran’s I at each phylogenetic distance class was given as:
I
y y
y y y y W
Sn
i i
i j i j i j
2 R RR = -- -b _ _ ` l i i j R T S S S V X W W W (1)
where n is the number of the species, yi and yj are the values of the trait in the species i and j, y is the average of y, Wij is the element of the matrix W, that assumes the value of one if the pair i,j of species is within the phylogenetic distance class interval. S is given by the count of these connections among species in W for each class interval. The value expected under the null hypothesis of absence of phylogenetic autocorrelation is given as – 1/ (n-1). Detailed computations of the standard error of this coefficient are given in Sokal & Oden (1978a,b) and Legendre & Legendre (1998). The phylogenetic correlograms were implemented in the program AUTOPHY, written in Basic language and available from the main author upon request (see also Diniz-Filho, 2001).
The phylogenetic patches for these traits were estimated by visual inspection of each correlogram obtained for the 23 life-history traits, and an average value was calculated. Crudely, the correlograms can be visually grouped into four profiles (see Diniz-Filho, 2001):
I. Clinal with stabilization, when there are only positive autocorrelations in the first distance classes, that decrease and afterwards stabilize (i.e., tends to be close to null expectation); II. Clinal correlograms with positive and
negative autocorrelations in the first and last distance classes, respectively, with values decreasing linearly or monotonically, showing a ‘gradient’ pattern across the phylogeny; III. Long distance differentiation (with negative
autocorrelations only in the last distance classes) showing that the most distantly related species have a tendency to be the most distinct in the clade. In this case, patch size was set to zero, since closely related species tend to be independent for the character analyzed; and
IV. Correlograms without a significant Moran’s I coefficient, showing that the character variability is randomly distributed along the phylogeny, and therefore there is no phylogenetic pattern (patch’s size is then zero and the number of lineages converge to the number of species).
For each of the 279 quadrats covering the New World, we counted the number of lineages (SL) at the average phylogenetic patch estimated by the correlograms of the traits analyzed, using the “supertree” as a reference for worldwide Carnivora (Bininda-Emonds et al., 1999). A Pearson product-moment correlation between species richness and number of lineages at this phylogenetic patch was calculated, across the quadrats, but because of the inherent spatial autocorrelation among quadrats due to the overlap of geographic ranges or because of the spatial gradients in factors determining species richness (see Diniz-Filho et al., 2003), we used Dutilleul’s (1993) procedure to estimate the appropriate number of degrees of freedom for the correlation analyses.
Results
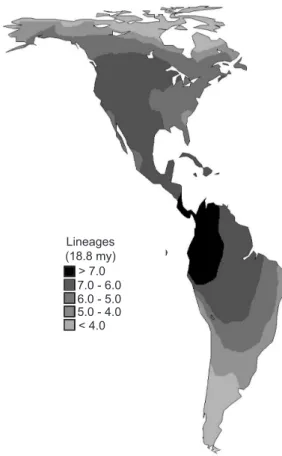
Out of the 23 characters analyzed, 11 showed profiles of Types III and IV (Table 1), with a phylogenetic patch statistically equal to zero. The average patch for all profiles was estimated as 18.8 million years before the present (BP), and so this was the level used to cut the Carnivore supertree to obtain a higher-taxon counts (number of lineages SL).
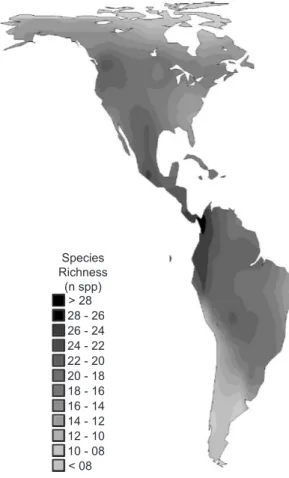
Species richness in Carnivora across the New World followed the expected pattern, with more species concentrated in Tropical regions, decreasing in directions to higher latitudes (Fig. 1) (see Whittaker et al., 2001 and Willig et al., 2003, for recent reviews). The higher-taxon counts at 18.8 mya (SL) have a very similar pattern (Fig. 2), and indeed the correlation between richness and number of lineages at this patch was equal to 0.899 (P < 0.001 with ca. 13 degrees of freedom by Dutileull’s [1993] method) (Fig. 3). The SL values ranged from 2 to 8 across the entire continent.
historical processes related to current diversity of Carnivora in New World. Thus, although there are more species in the Tropical regions of Central and South America, this fauna is composed by more recently derived species, which originated after the Great Faunal Interchange around 5-8 my. ago. A fast diversification occurred, in such a way that, although there are more species in the Tropics, they are “redundant” in relation to taxa whose lineages were present at 18.8 my BP, so at this SL there is more diversification in North America. Therefore, autocorrelation analyses of some phenotypic traits reveal that, at a patch of around 19 my. BP, an average based on different phenotypic traits, more evolutionary diversification (in the sense of minimizing redundancy among recently derived species) occurs in North America.
DISCUSSION
Using evolutionary measures is certainly a strategy that may circumvent the sometimes arbitrary decision about what taxonomic units are to be the basis for conservation efforts. It also puts less emphasis on ‘counting up’ taxonomic units and more on representativeness of a cladistic hierarchy and, consequently, on evolutionary processes (May, 1990; Crozier, 1997; Mace et al., 2003). In this sense, higher-taxon counts are part of the same overall problem of establishing a cut-off point in an evolutionary continuum.
Indeed, for New World Carnivora, our analyses showed a high correlation between the higher taxon richness (SL) and species richness, as found in many previous studies (see Grelle, 2002 and references therein). However, differences between TABLE 1
Ecological, morphological and behavioral characters studied for Carnivora species in the New World, the respective number of species for which trait data was available, phylogenetic patch (in millions of years, m.y.) and the correlogram
profile (see text for detail).
Characters N. species Patch (m.y.) Profiles
Body weight 70 32.9 I
Geographic range 70 0.0 IV
Female brain weight 29 36.1 I
Average brain weight of adult male and adult female 38 39.0 I
Litter size 35 33.0 II
Gestation length 31 0.0 IV
Birth weight 25 0.0 III
Weaning age 21 0.0 IV
Longevity 13 0.0 IV
Age of sexual maturity 22 36.20 I
Inter-birth interval 20 0.0 IV
Body length 43 39.7 I
Parental care 19 44.8 II
Eyes open 23 29.0 II
Day range length 13 0.0 IV
Number of prey 18 0.0 III
Average height of olfactory bulb 42 39.2 I Average width of olfactory bulb 42 0.0 III Average length of olfactory bulb 42 37.0 I Average skull length of adult male and female 31 39.3 I
Basicranial axis length 31 0.0 III
these levels are clearly related to biogeographical and historical processes of colonization of the entire continent, and so conservation units that have more species should not necessarily contain more information about diversification processes at different hierarchical levels.
The use of higher-taxon richness as an estimate of wholesale biodiversity appears attractive because it should be substantially cheaper to identify specimens from survey samples to the level of higher-taxon than to the level of species. Moreover, previous studies showed that it could be used as a surrogate for species richness (Grelle, 2002). However, the problems of arbitrariness concerning the choice of the higher hierarchical level to be adopted and the lack of meaning in interpreting these estimates in an evolutionary context still persist. In this study, we showed that this higher-taxon approach can be based on
phylogenetic autocorrelation analyses of phenotypic evolution, which indicates that a cutting level of nearly 19 my. BP in Carnivora clade produced units (lineages) approximately independent considering the average model of phenotype diversification. This time level, for Carnivora, broadly corresponds to the family or subfamily taxonomic level.
This new application of phylogenetic autocorrelation analysis can be viewed in two slight, but not mutually exclusive, ways. First, phylogenetic patches provide a more objective way to define higher-levels to be used as a surrogate to species richness, in the same way the standard higher-taxon approach does (see Grelle, 2002). Secondly, it can provide a simple measure of evolutionary or phylogenetic diversity under specific models of phenotypic evolution, following the background proposed by Faith (1992, 1994) (see also Sechrest et al., 2002, Mace et al., 2003 Fig. 1 — Spatial patterns of species richness in New World terrestrial Carnivora.
Species Richness (n spp)
Fig. 3 — Relationship between richness and higher-taxon counts for New World terrestrial Carnivora.
Species richness
Higher-taxon count
1 2 3 4 5 6 7 8 9
2 8 14 20 26 32
Fig. 2 — Spatial patterns of higher-taxon richness (number of lineages at 18.8 million years) for New World terrestrial Car-nivora.
Lineages (18.8 my) > 7.0 7.0 - 6.0 6.0 - 5.0 5.0 - 4.0 < 4.0
and Diniz-Filho, 2004 for recent applications and discussions).
Therefore, this second interpretation of patch size enables the higher-taxon approach to
equal to half of the age of the clade under study, variations in higher-taxon counts among regions will reflect variation in phenotypic traits diverging approximately under a neutral process with constant rates. On the other hand, if a trait evolves quite fast, then its phylogenetic patch will tend to be zero and therefore evolutionary diversity must be assessed at species level in order to conserve all these processes. Thus, linking phylogenetic patches with a higher-taxon approach, as performed here, allows for an explicit interpretation to conserve evolutionary processes in a more complex way, taking into account phenotypic models (Crandall et al., 2000; Owens & Bennett, 2000; Diniz-Filho, 2004).
Of course, different traits will have different patches (see Table 1), and choosing among various possible patches is not trivial. This choice depends on which level the researcher is interested in conserving evolutionary and phenotypic diversity. In this study, for example, only the average patch for different traits was used, for illustrative purposes. However, if one is interested in conserving, for example, specific adaptations of different South American canids to open areas (using as a trait, for example, more detailed morphological variations among these species), then the level used here is probably not “correct”, since closely related species will have different morphs (and therefore a phylogenetic patch will tend to be zero) and therefore much evolutionary information would be lost if these ‘redundant’ species are not taken into account, or only a few species within each clade are prioritized. Hence, it is important to stress that these recent interspecific variations should be considered as only redundancy of the same phenotypes (i.e., the overall traits “defining” the canids) by assuming a patch of ca. 19 million years, which is not valid for all traits.
Note also that this interpretation of phyloge-netic patches is possible even in the absence of a detailed phylogenetic tree. When using, for example, a family as a level to establish the higher-taxon to count, an analysis of variance among species or individuals within this level, for various traits (see Harvey & Pagel, 1991), will reveal which part of phenotypic diversity is being conserved (different higher taxa) and which will be considered redundant (within these higher taxa). Although it will be not possible to establish the cut-off under an explicit phenotypic diversification model, at least it will be possible to know which traits are
considered “redundant” at the hierarchical level used. Of course, it may be necessary to take into account, when comparing very different groups, the problem that the same rank (i.e., family) may have very different evolutionary meanings.
Finally, Tôrres & Diniz-Filho (2004) recently showed that higher-taxon counts are also strongly correlated with Faith’s (1992, 1994) phylogenetic diversity index, for terrestrial Carnivora across New World conservation units. Phylogenetic diversity indexes (see also Crozier 1997) measure the amount of evolutionary history (sum of branch lengths) represented in a given area, and if branch lengths are expressed in terms of the amount of phenotypic evolution (e.g, by transforming time obtained using molecular data under a given model of phenotypic divergence), these more complex patterns will be represented (Diniz-Filho, 2004). Faith’s index is now widely recognized as an effective solution where limited resources imply that priorities must be placed on the conservation of different species, and it was indeed used to establish priorities for Carnivora and Primate conservation in biodiversity hotposts worldwide, based on evolutionary diversity (Sechrest et al., 2002). One possible advantage of the approach used here, apart from the biological interpretation of the cut-off point to establish the higher taxon count, is that its scale of measurement (i.e., the number of lineages – SL) is more familiar and intuitive, and directly linked with the common approach based on species richness.
Acknowledgments — We would like to thank L. M. Bini and
an anonymous reviewer for critically reading previous versions of this manuscript and L. Silveira for help with the Canivore dataset. We would also like to thank T. F. L.V. B. Rangel for help in drawing the maps. J. A. F. Diniz-Filho was supported by a CNPq grant (300762/94-1) and Natália M. Tôrres by a CAPES master fellowship.
REFERENCES
BALMFORD, A., LYON, A. J. E. & LANG, R. M., 2000, Testing the higher-taxon approach to conservation planning in a megadiverse group: the macrofungi. Biological Conservation, 93: 209-217.
BININDA-EMONDS, O. R. P. & GITTLEMAN, J. L., 2000, Are pinnipeds functionally different from fissiped carnivores? The importance of phylogenetic comparative analysis. Evolution, 54: 1011-1023.
BININDA-EMONDS, O. R. P., GITTLEMAN, J. L. & PURVIS, A., 1999, Building large trees by combining phylogenetic information: a complete phylogeny of the extant Carnivora (Mammalia). Biological Review, 74: 143-175.
CRANDALL, K. A., BININDA-EMONDS, O. R. P., MACE, G. M. & WAYNE, R. K., 2000, Considering evolutionary processes in conservation biology. Trends in Ecology & Evolution, 15: 290-295.
CROZIER, R. H., 1997, Preserving the information content of species: genetic diversity, phylogeny and conservation worth. Annu. Rev. Ecol. Syst., 28: 243-268.
DINIZ-FILHO, J. A. F., 2000, Métodos Filogenéticos Comparativos, Holos Editora, Ribeirão Preto.
DINIZ-FILHO, J. A. F., 2001, Phylogenetic autocorrelation under distinct evolutionary processes. Evolution, 55: 1104-1109. DINIZ-FILHO, J. A. F., 2004, Phylogenetic diversity and
conservation priorities under distinct models of phenotypic evolution. Conservation Biology, 18: 698-704.
DINIZ-FILHO, J. A. F & TÔRRES, N. M., 2002, Phylogenetic comparative methods and the geographic range size – body size relationship in new world terrestrial Carnivora.
Evolutionary Ecology, 16: 351-367.
DINIZ-FILHO, J. A. F. & TELLES, M. P. C., 2002, Spatial autocorrelation analysis and the identification of operational units for conservation in continuous populations.
Conservation Biology, 16: 924-935.
DINIZ-FILHO, J. A. F., BINI, L. M. & HAWKINS, B. A., 2003, Spatial autocorrelation and red herrings in geographical ecology. Global Ecology & Biogeography, 12: 53-64 DUTILLEUL, P., 1993, Modifying the t test for assessing the
correlation between two spatial processes. Biometrics, 49: 305-314.
FAITH, D. P., 1992, Conservation evaluation and phylogenetic diversity. Biological Conservation, 61: 1-10.
FAITH, D. P., 1994, Genetic diversity and taxonomic priorities for conservation. Biological Conservation, 68: 69-74.
GASTON, K. J., 1997, Biodiversity. Blackwell, London. GEFFEN, E. et al., 1996, Size, life-history traits and social
organization in the canidae: a reevaluation. American Naturalist, 147: 140-160.
GITTLEMAN, J. L. et al., 1996, Phylogenetic lability and rates
of evolution: a comparison of behavioral, morphological and life-history traits. In: Martins, EP (ed.) Phylogenies and the comparative method in Animal Behavior. Oxford University Press, Oxford, pp. 166-205.
GITTLEMAN, J. L. & KOT, M., 1990, Adaptation: statistics and a null model for estimating phylogenetic effects. Systematic Zoology, 39: 227-241.
GRELLE, C. E. V., 2002, Is higher-taxon analysis a useful surrogate of species richness in studies of Neotropical mammal diversity? Biological Conservation, 108: 101-106.
HANSEN, T. F., & MARTINS, E. P., 1996, Translating between microevolutionary process and macroevolutionary patterns: the correlation structure of interspecific data. Evolution, 50: 1404-1417.
HARVEY, P. & PAGEL, M., 1991, The comparative method in evolutionary biology. Oxford University press, Oxford. LEGENDRE, P. & LEGENDRE, L. 1998. Numerical Ecology.
Elsevier, Amsterdan.
MACE, G., GITTLEMAN, J. L. & PURVIS, A., 2003, Preserving the tree of life. Science, 300: 1707-1709. MAY, R. M., 1990, Taxonomy as destiny. Nature, 347:129-130.
OWENS, I. P. F. & BENNETT, P. M., 2000, Quantifying biodiversity: a phenotypic perspective. Conservation Biology, 14: 1014-1022.
SECHREST, W. et al., 2002, Hotspots and the conservation of
evolutionary history. P. Natl. Acad. Sci. USA, 99: 2067-2071.
SOKAL, R. R. & ODEN, N. L., 1978a, Spatial autocorrelation in biology. 1. Methodology. Biological Journal of Linnean Society, 10: 199-228.
SOKAL, R. R. & ODEN, N. L., 1978b, Spatial autocorrelation in biology. 2. Some biological implications and four applications of evolutionary and ecological interest.
Biological Journal of Linnean Society, 10: 229-249. SOKAL, R. R. & JACQUEZ, G. M., 1991, Testing inferences
about microevolutonary processes by means of spatial autocorrelation analysis. Evolution, 45: 152-168.
TÔRRES, N. M. & DINIZ-FILHO, J. A. F., 2004, Phylogenetic autocorrelation and evolutionary diversity of Carnivora (Mammalia) in Conservation Units of the New World.
Genetics & Molecular Biology, 27(4) (in press).
WHITTAKER, R. J., WILLIS, K. J. & FIELD, R., 2001, Scale and species richness: towards a general, hierarchical theory of species diversity. Jounal of Biogeography, 28: 453-470.
WILLIG, M. R., KAUFMAN, D. M. & STEVENS, R. D., 2003, Latitudinal gradients of biodiversity: pattern, process, scale and synthesis. Annu. Rev. Ecol. Syst., 34: 273-309. WILLIAMS, P. H. & GASTON, K. J., 1994, Measuring more of
biodiversity: can higher-taxon richness predict wholesale species richness? Biological Conservation, 67: 211-217.
WILLIAMS, P. H., 1992, Worldmap: priority areas for biodiversity (demonstration program). Privately distributed, London.