ORIGINAL
RES
EAR
CH
Correspondence to: Márcio Vinícius Fagundes Donadio. Instituto de Pesquisas Biomédicas (IPB) – Centro Infantil – Avenida Ipiranga, 6690, 2º andar – CEP 90610-000 – Porto Alegre (RS), Brazil – E-mail: [email protected]
Presented: May 2013 – Accepted for publication: Oct. 2013 – Financing source: FAPERGS, CAPES and CNPq. – Conflict of interests: nothing to declare.
ABSTRACT | The aim of the present study was to compare
the results of standardization of ventilatory muscle strength data using three international reference values and one Brazilian reference in children and adolescents with cystic fibrosis (CF). This was a retrospective study, which included patients with CF aged 8 to 12 years and in regular follow-up at an outpatient facility. Demographic and anthropometric data were collected. All patients included in the sample should have had ventilatory muscle strength and lung function mea-sured in the past 12 months. The standardization of the results was made using predicted values from each equation. Data were compared using one-way ANOVA. We included 24 pa-tients, 62.5% males, with mean age of 10.5±1.53 years, height 138.0±0.08 cm, weight 34.6±7.9 kg, FEV1 93.29±29.02% and FVC 103.78±26.12%. The maximum inspiratory (MIP) and expi-ratory (MEP) pressures (cmH2O) observed were 92.1±22.8 and 98.9±24.5, respectively. After standardization by the different equations, we found that the international reference tend to overestimate the findings. The Brazilian equation showed val-ues significantly lower (p<0.05) for MIP and MEP compared to international reference equations, and these would consider MIP values above normal (>100%) in 91.6, 79.1, and 75.0% of the subjects and MEP in 66.6, 87.5 and 50% of them, while using the national equation only 50.0 and 37.5% of subjects were above 100%, respectively. The results of standardization of ventilatory muscle strength in children and adolescents with CF aged 8 to 12 years using international equations overesti-mate the values of maximal respiratory pressures.
Keywords | Muscle Strenghth; Respiratory Muscles; Cystic Fibrosis.
International equations overestimate the
respiratory muscle strength in children and
adolescents with Cystic Fibrosis
Equações internacionais superestimam a força muscular
ventilatória em crianças e adolescentes com Fibrose Cística
Ecuaciones internacionales sobreestiman la fuerza
muscular ventilatoria en niños y adolescentes con Fibrosis Quística
João Paulo Heinzmann-Filho1,Mauro Henrique Moraes Vargas1, Taila Cristina Piva1, Fernanda Maria
Vendrusculo1, Leonardo Araújo Pinto1, Paulo José Cauduro Marostica2, Márcio Vinícius Fagundes Donadio1
Study conducted at the Cystic Fibrosis Outpatient Facility of Hospital São Lucas, Pontifícia Universidade Católica do Rio Grande do Sul (PUCRS) – Porto Alegre (RS), Brazil.
1PUCRS – Porto Alegre (RS), Brazil.
2Universidade Federal do Rio Grande do Sul (UFGRS) – Porto Alegre (RS), Brazil.
RESUMO | O objetivo deste estudo foi comparar os
INTRODUCTION
Cystic ibrosis (CF) is a genetic progressive disease associated with impairment of the respiratory func-tion1. he course of the disease is inluenced by chro-nic inlammation of the airways and recurrent bacterial infections that predispose the patient to airlow limi-tation and change their respiratory system compliance, causing ventilatory muscle weakness2.
Many studies conducted with pediatric samples have shown contradictions in the assessment of ven-tilatory muscle strength, with results varying from de-crease3,4 to increase1,5 in strength. Some papers report that hyperinlation combined with malnutrition may be a factor predisposing to ventilatory muscle
weake-ning4,6,7. On the other hand, chronic cough and
increa-se in ventilatory efort increa-seem to favor muscle strength5,8. In the last decade, some national studies assessing ven-tilatory muscle strength in CF patients1,9,10 also showed conlicting results.
Currently there are three international equations used for standardization of results in evaluations of ventilatory muscle strength of children under the age of 1211-13; however, the use of such equations may not relect the actual ventilatory condition of patients, for they under- or overestimate the indings. Our study group has recently published reference values for ven-tilatory muscle strength in healthy preschool Brazilian children14. his study showed that international equa-tions compared to local reference values overestimate
the ventilatory muscle strength of healthy children and adolescents, suggesting that the standardization of in-dings in subjects with changes in the respiratory system may not relect the actual conditions of these muscles.
Considering the wide range of diferences in evi-dence regarding ventilatory muscle strength in CF patients and the usual use of international reference values for standardization of indings, we raised the hypothesis that the appliance of a national equation could show the behavior of these muscles more ac-curately. he purpose of this paper was, therefore, to compare results of data standardization regarding ven-tilatory muscle strength using one national and three international reference equations in children and ado-lescents with CF.
METHODOLOGY
his was a retrospective observational study based on a secondary database research. Patients diagnosed with CF by sweat or genetic test, aging from 8 to 12 years old, in outpatient follow-up at Hospital São Lucas (Pontifícia Universidade Católica do Rio Grande do Sul – PUCRS) were included in the sample. All sub-jects should have been submitted to ventilatory muscle strength and spirometry tests in the 12 months prior to the study. Patients whose data were not available on the database were excluded from the sample. he research com FC utilizando-se equações internacionais superestimam os
valores das pressões respiratórias máximas.
Descritores | Força Muscular; Músculos Respiratórios; Fibrose Cística.
RESUMEN | El objetivo de este estudio fue comparar los resulta-dos de la normalización de los datos de fuerza muscular ventilato-ria utilizando tres ecuaciones de referencia internacionales y una nacional en niños y adolescentes con fibrosis quística (FC).Estudio retrospectivo, en el cual fueron incluidos pacientes con FC, edad entre 8 y 12 años y control ambulatorio regular. Fueron colecta-dos datos demográficos y variables antropométricas. Tocolecta-dos los pacientes incluidos deberían haber realizado test de fuerza mus-cular ventilatoria y espirometría en los últimos 12 meses. La nor-malización de los resultados fue realizada utilizando las variables predictoras requeridas en cada ecuación estudiada. Los datos fueron comparados utilizando una ANOVA de una vía. Fueron in-cluidos 24 pacientes, 62,5% masculinos, media de edad 10,5±1,53
años, estatura 138,0±0,08 cm, masa corporal 34,6±9,07 kg, VEF1 93,29±29,02% y CVF 103,78±26,12%. Las presiones (cmH2O) ins-piratoria (PIMAX) y exins-piratoria (PEMAX) máximas encontradas fueron 92,1±22,8 y 98,9±24,5, respectivamente. Después de la normalización por las diferentes ecuaciones, se demostró que las internacionales tienden a sobreestimar los hallazgos para nuestra población. La ecuación nacional presentó valores medios previs-tos significativamente (p<0,05) menores para PIMAX y PEMAX en comparación con las ecuaciones internacionales, siendo que es-tas clasificarían la PIMAX como encima de lo normal (>100%) en 91,6, 79,1, y 75,0% de los sujetos y la PEMAX en 66,6, 87,5 y 50%, mientras la ecuación nacional estimaría apenas 50,0 y 37,5% de los individuos, respectivamente. La normalización de los resulta-dos de fuerza muscular ventilatoria en niños y adolescentes entre 8 y 12 años con FC utilizando ecuaciones internacionales sobrees-timan los valores de las presiones respiratorias máximas.
was approved by the Ethics Committee of the institu-tion (08/04102).
Data regarding identiication (such as name, birth date, genre), body mass index, height, spirometry and ventilatory muscle strength were collected. he spiro-metric features assessed (KOKO spirometer, Louisville, CO, EUA) included forced vital capacity (FVC), forced expiratory volume in one second (FEV1) and mid-breath forced expiratory low in measurements of FVC (FEF 25–70%). All procedures were performed in complian-ce with pre-established guidelines15, and values expres-sed were absolute and predicted. Manovacuometry test was made using a digital manovacuometer (MVD500, Globalmed, Porto Alegre, RS, Brazil). he maximum inspiratory (MIP) and expiratory (MEP) pressures15 were measured with patients sitting down, wearing a nose clip, and holding irmly the equipment in their lips to prevent escaping air. MIP was measured by residual volumes, and MEP by total lung capacity (TLC).
During the last maneuver, patients were supposed to put their hands on their cheeks to avoid air accu-mulation inside their mouth. All measures were taken at maximum efort and sustained for at least 1 second. Patients should perform at least three and at most nine maneuvers, being three acceptable (without air esca-pe) and two reproducible (variance <10% between two measures). he value could not be higher than the pre-cedent13,15, so the inal result would be the highest mea-sure obtained.
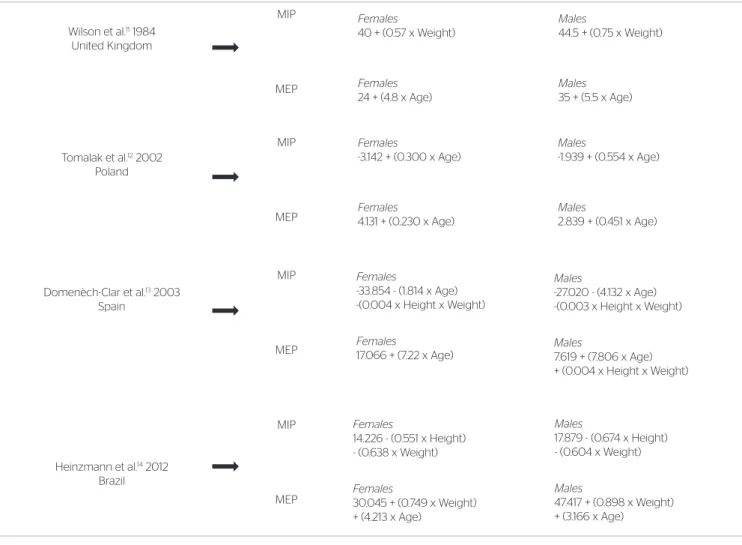
Standardization of the results was made by using diferent reference equations (one national and three international) according to the predictor factors requi-red by each of them. Reference equations were named after the irst letter of the study author’s name, being the national equation (2012)14 named H, and the in-ternational ones (1984, 2002 and 2003) W, T and D, respectively11-13 (Chart 1).
After data standardization, three cut of points were established: muscle strength above normality (100% of predicted values), values between 80 and 100% of pre-diction, and values below 80% of the prediction. To de-ine the sample size, MIP was the variable of choice. Considering a 5% alpha error and 80% power, and ai-ming at detecting a variation of two standard deviations, the sample size was estimated in roughly 20 individuals. he variables were assessed by the Shapiro-Wilk test and expressed as mean and standard deviation. Spirometric data and results of the ventilatory mus-cle strength were expressed as absolute and predicted values. Comparisons between equations were made by
one-way ANOVA (Bonferroni post-test). All analy-zes were made in the software SPSS 18.0 (SPSS Inc., EUA), with signiicance level set at 5%.
RESULTS
Twenty-four patients were included in the samples, being 9 females. Spirometry values, maximal respira-tory pressures and sample characterization are shown in Table 1.
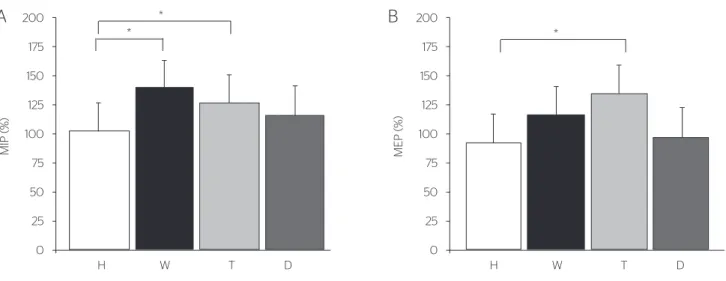
After data standardization, it was shown that inter-national equations tend to overestimate the indings in our sample. Considering that there were no signii-cant diferences regarding gender, data are presented in group. he national equation (H) had mean predicted values for MIP signiicantly lower (p=0.0003) compa-red to equations W and T (Figure 1A). On the other hand, predicted MEP in equation H was signiicantly lower (p<0.0001) compared to equation T (Figure 1B).
Using 100% of the prediction as cut of point, in-ternational equations would classify MIP as above nor-mality (>100%) in 91.6, 79.1, and 75% of subjects (in W, T and D, respectively), and MEP in 66.6, 87.5 and 50% of subjects, while the national equation would only overestimate 50 and 77.5% of individuals, respectively. When data below 80% of the prediction were assessed, only 4.1, 8.3 and 12.5% (MIP) and 12.5, 4.1 and 29.1% (MEP) of the patients were classiied in this range, while the national equation estimated a higher per-centage, 16.6 and 29.1%, respectively. Finally, 4.1, 12.5, 12.5% (MIP) and 20.8, 8.3 e 20.8% (MEP) of patients had values between 80 and 100% of the international equations’ prediction, while the national equation esti-mated 33.3% for both respiratory pressures. hese in-dings are shown in Figure 2.
DISCUSSION
represent the actual conditions of ventilatory muscles in our population.
A previous study16 assessed healthy Brazilian chil-dren and showed signiicant diferences between mean values obtained by them in the tests compared to MIP and MEP means values established in international equations17, rather than other equations11,13. However, it is worth noting the small sample for a study with healthy individuals and the comparison between mean values without normalization for each equation. ATS recommends the generation of reference values for the spirometric patterns of each region18. Ventilatory mus-cle strength can also be inluenced by demographic dif-ferences, supporting the hypothesis that a distinct equa-tion for each populaequa-tion is the ideal.
Moreover, studies about lung function also showed signiicant diferences in the prediction of spirometric va-riables when using reference equations19,20 and attributed them to many factors, including sample selection criteria, use of diferent equipment and techniques, and biological diferences between populations16,19,20. Overestimation of MIP: maximum inspiratory pressure; MEP: maximum expiratory pressure.
Chart 1. Reference equations used for standardization Wilson et al.11 1984
United Kingdom
Tomalak et al.12 2002 Poland
Domenèch-Clar et al.13 2003 Spain
Heinzmann et al.14 2012 Brazil
MEP MIP MEP MIP MEP MIP MEP
MIP Females
40 + (0.57 x Weight)
Females
24 + (4.8 x Age)
Males
44.5 + (0.75 x Weight)
Males
35 + (5.5 x Age)
Females
-3.142 + (0.300 x Age)
Females
4.131 + (0.230 x Age)
Males
-1.939 + (0.554 x Age)
Males
2.839 + (0.451 x Age)
Females
-33.854 - (1.814 x Age) -(0.004 x Height x Weight)
Females
17.066 + (7.22 x Age)
Males
-27.020 - (4.132 x Age) -(0.003 x Height x Weight)
Males
7.619 + (7.806 x Age) + (0.004 x Height x Weight)
Females
14.226 - (0.551 x Height) - (0.638 x Weight)
Females
30.045 + (0.749 x Weight) + (4.213 x Age)
Males
17.879 - (0.674 x Height) - (0.604 x Weight)
Males
47.417 + (0.898 x Weight) + (3.166 x Age)
Table 1. Sample characteristics
Variables Mean±SD
n=24
Gender
Male (%) 15 (62.5)
Anthropometric variables
Age (years) 10.5±1.53
Height (cm) 138.0±0.08
Body mass (kg) 34.6±9.07
BMI Absolute 17.92±2.84
Percentile 54.25±31.14
Spirometry
FEV1 (L) 1.80±0.62
(%) 93.29±29.02
FVC (L) 2.19±0.65
(%) 103.78±26.12
FEV1/FVC 0.81±0.11
FEF25-75% (L) 1.94±1.07
(%) 78.04±39.63
Manovacuometry (cmH2O)
MIP 92.1±22.8
MEP 98.9±24.5
MIP: maximum inspiratory pressure; MEP: maximum expiratory pressure;
*p<0.05. H: Heinzmann et al.14; W: Wilson et al.11 ;T: Tomalak et al.12; D: Domenèch-Clar et al.13
Figure 1. Comparison between prediction values by diferent reference equations for maximum inspiratory pressure (A) and maximum expiratory pressure (B).
MIP (%
)
200
175
H W T D
* * 150 125 100 75 50 25 0
A
MEP (%) 200 175H W T D
* 150 125 100 75 50 25 0
B
MIP: maximum inspiratory pressure; MEP: maximum expiratory pressure;
H: Heinzmann et al.14; W: Wilson et al.11; T: Tomalak et al.12; D: Domenèch-Clar et al.13. For a better visualization, the results of MIP (absolute) were expressed as positive values in a range of 80 to 100% of the prediction.
Figure 2. Absolute values and percentual of predicted values for maximum inspiratory pressure and maximum expiratory pressure obtained by standar-dization with diferent equations
200 180 160 160 140 140 120 120 100 100
Absolute value (cmH2O)
Equation H % o f p r edic ted 80 80 60 60 40 40 20 20 220 240 200 180 160 160 140 140 120 120 100 100
Absolute value (cmH2O)
Equation W
% of pr
edic ted 80 80 60 60 40 40 20 20 220 240 200 180 160 160 140 140 120 120 100 100
Absolute value (cmH2O)
Equation W
% of pr
edic ted 80 80 60 60 40 40 20 20 220 240 200 180 160 160 140 140 120 120 100 100
Absolute value (cmH2O) Equation D
% of pr
edic ted 80 80 60 60 40 40 20 20 220 240
A
C
B
D
ventilatory muscle strength using international equa-tions may also be related to the distinct prediction va-riables used in each study for maximal respiratory pres-sures, once the way they inluence results may also vary. Wilson et al.11 showed that body mass and age, for MIP and MEP respectively, were the only variables presenting predicted values for both genders. Tomalak et al.12, on the other hand, attested that age was the only variable that could inluence results. Domènech-Clar et al.13 used age, height and body mass to establish MIP in both genders and MEP among males, while among females only age was considered for MEP.
In contrast, a study conducted with Brazilian chil-dren considered height and body mass to predict MIP, and body mass and age to predict MEP14. Besides that, international studies have shown a lower prediction power (R2) (9–51%) when compared to the national equation (46–58%).
Another important factor to justify diferences in value estimative is that ethnics and skin color have not been considered in the evaluation of some studies because samples were homogeneous, including only Caucasian11 or same-origin13 individuals. Ethnic origin has been cited in previous studies as a potential factor inluencing results of ventilatory muscle strength21,22. Although our study included Brazilian children from various ethnic origins, it did not inluence the results of maximal pressure signiicantly14. On the other hand and despite ethnics, diferent social, economic and cultural contexts involving the subjects may also interfere in re-sults, which mean that equations from other countries do not represent global characteristics of children and adolescents, especially considering the interracial and heterogeneous features of the Brazilian people.
Although the inclusion of malnourished patients in our sample may have inluenced results, most subjects presented normal nutritional values. In addition, the study of equation H14 showed that even with healthy children and adolescents, or those presenting preserved nutritional proile, international equations tend to ove-restimate maximal respiratory pressures, which means that this factor is not likely to be relevant. herefore, the use of a national and current equation can better represent and quantify the conditions of ventilator mus-cles in children and adolescents with diferent clinical pictures, avoiding overestimation of results.
Despite the constant use of such method in the assessment and follow-up of CF patients, there is no consensus regarding the expected results of ventilatory muscle strength1,4,5. In our study, the use of international
equations led to the classiication of MEP and MIP above normality in 30% more children compared to the standardization using the national one. Also, interna-tional equations pointed out maximal respiratory pres-sures as decreased in 50% less patients, for they would identify 8% for MIP and 15% for MEP, on average, while the national equation would classify as 16.6 and 29.1%, respectively.
hese indings show that international equations may show a lower rate of children presenting weakening in ventilatory muscles, which delays the diagnosis of potential changes and, consequently, the establishment of treatment, thereby causing patients to be referred to muscle strengthening programs too late, when degrees of muscle weakening are advanced. It is worth empha-sizing that the sample with CF patients was relatively healthy as to lung function and nutritional status pro-bably due to the low mean age and periodical follow-up.
CONCLUSION
he standardization of ventilatory muscle strength values in CF children and adolescents by internatio-nal equations tend to overestimate maximal pressure values. We recommend caution by health professionals when standardizing and interpreting results based on diferent reference values, being necessary an individual assessment of each equation to be used. National and current equation may help to relect actual conditions of ventilatory muscles in Brazilian patients, helping to identify clinical pictures of ventilatory muscle weake-ning more accurately.
ACKNOWLEDGMENTS
he authors thank FAPERGS, CAPES and CNPq for the scholarships.
REFERENCES
1 . Z anc h et R C, Chagas AM, Melo JS, Watanabe PY, Simões-Barbosa
2. Dakin CJ, Numa AH, Wang H, Morton JR, Vertzyas CC, Henry RL. Inflammation, infection, and pulmonary function in infants and young children with cystic fibrosis. Am J Respir Crit Care Med. 2002;165(7):904-10.
3. Keochkerian D, Chlif M, Delanaud S, Gauthier R, Maingourd Y, Ahmaidi S. Timing and driving components of the breathing strategy in children with cystic fibrosis during exercise. Pediatr Pulmonol. 2005;40(5):449-56.
4. Fauroux B, Boulé M, Lofaso F, Zérah F, Clément A, Harf A, et al. Chest physiotherapy in cystic fibrosis: improved tolerance with nasal pressure support ventilation. Pediatrics. 1999;103(3):E32.
5. de Jong W, van Aalderen WM, Kraan J, Koëter GH, van der Schans CP. Inspiratory muscle training in patients with cystic fibrosis. Respir Med. 2001;95(1):31-6.
6. Szeinberg A, England S, Mindorf C, Fraser IM, Levison H. Maximal inspiratory and expiratory pressures are reduced in hyperinflated, malnourished, young adult male patients with cystic fibrosis. Am Rev Respir Dis. 1985;132(4):766-9.
7. Lands L, Desmond KJ, Demizio D, Pavilanis A, Coates AL. The effects of nutritional status and hyperinflation on respiratory muscle strength in children and young adults. Am Rev Respir Dis. 1990;141(6):1506-9.
8. Barry SC, Gallagher CG. Corticosteroids and skeletal muscle function in cystic fibrosis. J Appl Physiol. 2003;95(4):1379-84.
9. Ziegler B, Lukrafka JL, de Oliveira Abraão CL, Rovedder PM, Dalcin PeT. Relationship between nutritional status and maximum inspiratory and expiratory pressures in cystic fibrosis. Respir Care. 2008;53(4):442-9.
10. Cunha MT, Rozov T, de Oliveira RC, Jardim JR. Six-minute walk test in children and adolescents with cystic fibrosis. Pediatr Pulmonol. 2006;41(7):618-22.
11. Wilson SH, Cooke NT, Edwards RH, Spiro SG. Predicted normal values for maximal respiratory pressures in caucasian adults and children. Thorax. 1984;39(7):535-8.
12. Tomalak W, Pogorzelski A, Prusak J. Normal values for maximal static inspiratory and expiratory pressures in healthy children. Pediatr Pulmonol. 2002;34(1):42-6.
13. Domènech-Clar R, López-Andreu JA, Compte-Torrero L, De Diego-Damiá A, Macián-Gisbert V, Perpiñá-Tordera M, et al. Maximal static respiratory pressures in children and adolescents. Pediatr Pulmonol. 2003;35(2):126-32.
14. Heinzmann-Filho JP, Vidal PC, Jones MH, Donadio MV. Normal values for respiratory muscle strength in healthy preschoolers and school children. Respir Med. 2012.
15. Diretrizes para testes de função pulmonar. Jornal de Pneumologia. 2002;28(3):155-65.
16. Nascimento RAD, Campos TF, Melo JBDC, Borja RDO, Freitas DAD, Mendonça KMPPD. Obtained and predicted values for maximal respiratory pressures of brazilian children. Journal of Human and Growth and Development. 2012;22(2):166-72.
17. Szeinberg A, Marcotte JE, Roizin H, Mindorf C, England S, Tabachnik E, et al. Normal values of maximal inspiratory and expiratory pressures with a portable apparatus in children, adolescents, and young adults. Pediatr Pulmonol. 1987;3(4):255-8.
18. Lung function testing: selection of reference values and interpretative strategies. American Thoracic Society. Am Rev Respir Dis. 1991;144(5):1202-18.
19. Pereira CA, Sato T, Rodrigues SC. New reference values for forced spirometry in white adults in Brazil. J Bras Pneumol. 2007;33(4):397-406.
20. Duarte AA, Pereira CA, Rodrigues SC. Validation of new brazilian predicted values for forced spirometry in caucasians and comparison with predicted values obtained using other reference equations. J Bras Pneumol. 2007;33(5):527-35.
21. Matecki S, Prioux J, Jaber S, Hayot M, Prefaut C, Ramonatxo M. Respiratory pressures in boys from 11-17 years old: a semilongitudinal study. Pediatr Pulmonol. 2003;35(5):368-74.