O
RIGINALA
RTICLE Revista Brasileira de FisioterapiaEffects of sensor, trials and knee joint variables
on electrogoniometric gait recordings
Efeitos das variáveis sensor, coleta e articulação do joelho nos registros
eletrogoniométricos da marcha
Carnaz L1, Oliveira AB1, Sato TO1, Hansson G-A2,Coury HJCG1
Abstract
Introduction: Different sources of variations, such as electrogoniometer characteristics and procedures, may affect the accuracy and precision of movement measurements during gait. Objective: To quantify the variations and compare the effects produced by different sources of variation in electrogoniometric gait recordings: the sensors, procedures (trials) and the knee joint. Methods: Knee flexion/ extension and valgus/varus movements were recorded during gait on the treadmill. The recordings were partitioned into strides and normalized in time using a routine developed in MatLab. Mean curves for the knee during gait were derived from 50 strides, and seven conditions were evaluated: one comparing pairs of sensors; two comparing pairs of different trials (including variations due to sensors); and four comparing the right and left knees (including variations due to sensors and trials). Mean standard deviations of the differences were calculated. To estimate the variations relating to the trial and the knee joint, the compound standard deviations were transformed into variances and split into their components. Results: The variation introduced by pairs of sensors in the same model applied in one trial was smaller than the variation introduced by the same sensor used in two consecutive trials. Furthermore, the variation introduced by the difference between the right and left knees was greater than the variation introduced by the difference between sensors (A and B) and trials (1 and 2). Conclusions: It is, therefore, preferable to use different sensors in the same data recording (simultaneous) than use the same sensor in two different recordings (consecutive).
Key words: movement; measurement error; gait.
Resumo
Introdução: Diferentes fontes de variação, tais como características do eletrogoniômetro e procedimentos podem afetar a acurácia
e precisão das medidas do movimento durante a marcha. Objetivo: Quantificar a variação e comparar o efeito das diferentes fontes de variação nos registros eletrogoniométricos da marcha: os sensores, os procedimentos (coletas consecutivas) e a articulação do joelho. Métodos: Movimentos de flexo-extensão e valgo-varo do joelho foram registrados durante a caminhada na esteira. Os registros foram divididos em passadas e normalizados no tempo usando uma rotina desenvolvida em MatLab. As curvas médias do joelho durante a marcha foram derivadas de 50 passadas, e sete condições foram avaliadas: uma para comparar dois sensores; duas para comparar duas diferentes coletas (incluindo a variação do sensor), e quatro para comparar os joelhos direito e esquerdo (incluindo a variação dos sensores e coletas). Os desvios-padrão médios das diferenças foram calculados. Para estimar as variações devido às coletas e à articulação do joelho, os desvios-padrão compostos foram transformados em variâncias e seus componentes isolados.
Resultados: A variação introduzida por dois sensores do mesmo modelo aplicados em uma coleta foi menor do que a variação introduzida pelo mesmo sensor usado em duas coletas consecutivas. Ainda, a variação introduzida pela diferença entre os joelhos direito e esquerdo foi maior do que a variação introduzida pela diferença entre os sensores (A e B) e as coletas (1 e 2). Conclusões:
Assim, é preferível usar diferentes sensores na mesma coleta de dados (simultânea) do que usar o mesmo sensor em dois registros diferentes (consecutivos).
Palavras-chave: movimento; erro de medida; marcha.
Received: 12/12/2007 – Revised: 25/06/2008 – Accepted: 10/09/2008
1 Department of Physical Therapy, Universidade Federal de São Carlos (UFSCar), São Carlos (SP), Brazil 2 Division of Occupational and Environmental Medicine, Lund University Hospital, Lund, Sweden
Correspondence to: Helenice Jane Cote Gil Coury, Departamento de Fisioterapia da Universidade Federal de São Carlos, Rodovia Washington Luis, km 235, CP 676, CEP 13565-905, São Carlos (SP), Brazil, e-mail: [email protected]
Introduction
Physical therapists require quantitative, reliable and precise methods of evaluating impairments, disabilities and handicaps and also determining rehabilitation outcomes. Because of the feasibility of lexible electrogoniometers, they have been used to record functional movements1-6. However, diferent sources of variation can afect the accuracy and precision of the mea-surements, such as the diferent characteristics of particular goniometers, misalignment of the endblocks relative to the planes of movement, limited reproducibility of the application of the endblocks, vague deinition that might lead to imprecise recordings of the reference position7-9 and diferences between bilateral joints such as the knees during normal gait10,11.
Several studies have analyzed the diferent sources of variation that can afect wrist and forearm electrogoniometric recordings7,12. Nevertheless, few studies have applied lexible electrogoniometers to the evaluation of gait, and none of them evaluated the sources of variation in this application.
To estimate the variation in electrogoniometric gait record-ings, particularly due to sensors, procedures and knee joints, we must consider diferent ways to isolate each efect. One way to determine the efect of the sensors would be to record the same knee, using diferent sensors, in the same trial (e.g. two similar goniometers attached to each other with double-sided adhesive tape), i.e. simultaneous measurements. To evaluate the diference between right and left knee movements, data collection could be simultaneous using diferent sensors, or consecutive using the same sensor. hus, it would be possible to decide whether it is preferable to use diferent sensors in the same data recording (simultaneous) or the same sensor in two diferent recordings (consecutive), in order to achieve the smallest variation.
he objective of this study was to quantify the variations and compare the efects produced by diferent sources of varia-tion in electrogoniometric gait recordings: the sensors, proce-dures (trials) and the knee joint.
Methods
Subjects
Eight healthy males (age 21.6±3.5 years; height 170±3cm; weight 66.4±7.0kg) participated in the study. hey did not present any mus-culoskeletal injuries, balance disorders or symptoms. Subjects pre-senting any lower-limb postural deviation were excluded in order to ensure that only subjects presenting symmetrical lower limbs were included. Furthermore, since electrogoniometer recordings are anthropometry-dependent, the subjects were selected within the height range of 165 to 175cm. Sixty healthy males were evaluated
but only eight subjects were included because our inclusion criteria were strict and made it very diicult to ind subjects. his study was developed with approval from the Ethics in Human Research Committee of Universidade Federal de São Carlos (Approval report number 035/04) and the subjects signed a consent form.
Equipment
Knee lexion/extension (F/E) and valgus/varus (V/V) move-ments were recorded using two biaxial lexible electrogoniom-eters (M110, Biometrics Ltd., Gwent, UK) and an acquisition unit (Data Logger 1001, Biometrics Ltd., Gwent, UK). he two sensors were named A and B. he sampling frequency was 1,000Hz.
Procedures
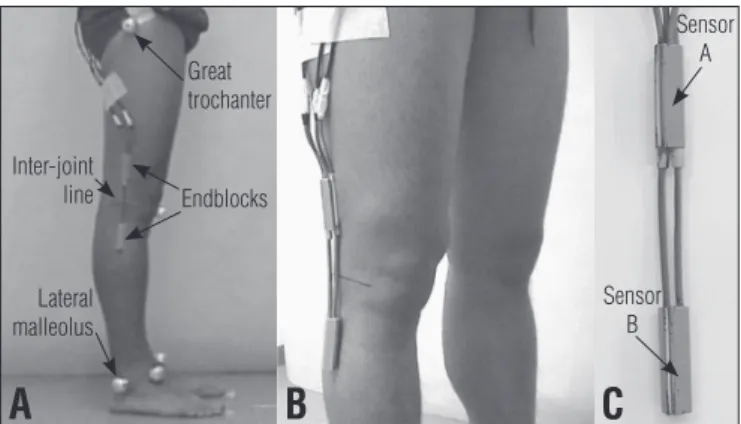
For two of the three trials, bilateral recordings of F/E and V/V were performed. One of the goniometers (A or B) was attached to the shaved lateral face of each knee with the subjects standing in anatomical position. he center of the inter-joint line was taken to be the common reference for the leg and thigh. he center of the sensor spring coincided with this line, and the endblocks were aligned over the axis of the thigh and leg, with the greater trochanter and lateral malleolus as the reference points (Figure 1). To avoid kinematic crosstalk, the aim in the alignment was to take the “true” lexion axis13. A single physical therapist was responsible for attaching the sensors. he area reserved for the sensors was marked out using a dermographic pen to allow pre-cise reproduction of the attachments in the subsequent trials. he knee angles when standing were taken to be the reference position and the recordings of these angles were subtracted from the subsequent gait recordings. For the third trial, the goniom-eters were attached to one another using double-sided adhesive tape (Figure 1) then attached to the right knee.
hree gait trials were performed on each subject. he irst trial was done with sensor A on the left knee (recording AL1)
Figure 1. (A) Electrogoniometer attachment in the first and second
trials; (B) and (C) Sensors A and B attached to each other, for attachment to the right knee in the third trial.
Great trochanter
Sensor A
Inter-joint
line Endblocks
Sensor B Lateral
malleolus
A
B
C
and sensor B on the right knee (BR1); the second trial was done with sensor A on the right knee (AR2) and sensor B on the left knee (BL2); and the third trial was done with both sensors (A and B) on the right knee (AR3 and BR3, respectively). he se-quence of the trials was randomized between the subjects and there was a ive-minute interval between trials. For each trial, after recording the reference position, the subjects were gradu-ally familiarized with a treadmill, walking at 5km/h, and knee movements were recorded for 90 seconds.
A pilot test had been previously conducted to investigate the efects of varying the position of the goniometer. he same trained physical therapist performed palpation and attached the goniometer to the subject’s knee twice. he maximum variation due to sensor replacement was 1.1° for F/E and 3.6° for V/V movements. Schwartz, Trost and Wervey14 evaluated a similar efect and, although these authors did not show these results explicitly, it can be inferred from their graphs that they found errors ≤4° for F/E and ≤2° for V/V movements.
Data analysis
Data processing was performed using a routine developed in MatLab version 6.5 (MathWorks Inc., Natick, MA, USA). hrough this routine, all the data were iltered using a low-pass, second-order, zero-lag Butterworth ilter at 10Hz. he record-ing was partitioned into strides, which were deined as the time between two consecutive heel strikes. he heel strike was taken to be the irst minimum after a maximum lexion15. he central 50 strides (corresponding to about 60 seconds of recording) for each knee were selected, and were normalized in time for both F/E and V/V, represented by 101 data points (one for each per-cent of the stride). Mean F/E and V/V curves were derived from these 50 strides, and were used for the subsequent analysis.
From these data, seven diferences were calculated: one comparing sensors A and B (AR3-BR3); two measurements comparing trials 1 and 2 (including the variation due to the sensor: BR1-AR2 and AL1-BL2); and four measurements com-paring the right and left knees (including the variation due to the sensor: BR1-AL1 and AR2-BL2; and the variation due to the trial: AR2-AL1 and BR1-BL2).
For each comparison described above, the mean value of the diference between the two curves for the 101 points was calculated. his value was taken to be the ofset and was sub-tracted from each of the 101 points on one curve. Hence, any systematic shift in F/E and V/V, between the two recordings compared, was disregarded.
After ofset subtraction, the mean standard deviation (SD) between the two knee curves was calculated to obtain a summary measurement of the diference, using the formula below16.
2 1
1
µ
µ
µ
µ
¶
´
¦
¦
¦
¦
§
¥
¤
= k
SD2
SD
mean=
k
i
i
where SDmean is the mean of the individual point - by - point standard deviation values across all instants (k=101) that make up the curve, and SDi is the standard deviation value for the ith instant.
he standard deviations obtained were used to estimate the size of the diferent sources of variation. Since the variations due to the sensor, trial and knee joint can be regarded as inde-pendent, their contributions to the compound variations are cumulative, provided that the variations are expressed as vari-ances. hus, a hierarchical analysis of variance was applied; the SDs were squared, i.e. transformed into variances, and calcu-lated for each subject and movement (F/E and V/V), separately. he variance due to the sensor was directly extracted from the condition AR3-BR3. he variance due to the trial was derived by subtracting the variance due to the sensor from the variance due to the trial plus the sensor (BR1-AR2 and AL1-BL2), and the mean value of these two estimates was used. he variance due to the knee joint was derived by subtracting the variance due to the sensor from the variance due to the knee joint plus the sen-sor (BR1-AL1 and AR2-BL2), and by subtracting the variance due to the trial from the variance due to the knee joint plus the trial (AR2-AL1 and BR1-BL2); and the mean value of these four estimates was used. he SDs (i.e. the square roots of the vari-ances) were then calculated and presented in tables and igures (Figure 2 and 3). Since the data depicted in Figure4 did not present normal distribution, the Kruskal-Wallis test was run to evaluate the diferences in F/E and V/V relating to the sensor, trial and knee joint conditions. he post-hoc Dunn test was ap-plied when statistical diferences were identiied.
Results
he eight subjects and the three trials presented a mean peak amplitude of 53.3° (SD=1.5°) for F/E, with a mean peak lexion of 56.2° (1.6°) and mean peak extension of 2.9° (1.3°). he V/V movements were smaller: mean peak amplitude of 12.0° (1.7°), mean peak valgus of 9.5° (2.7°) and mean peak varus of -2.5° (1.5°). he lexion and valgus peaks were reached during the swing phase, and the extension and varus peaks occurred during the stance phase.
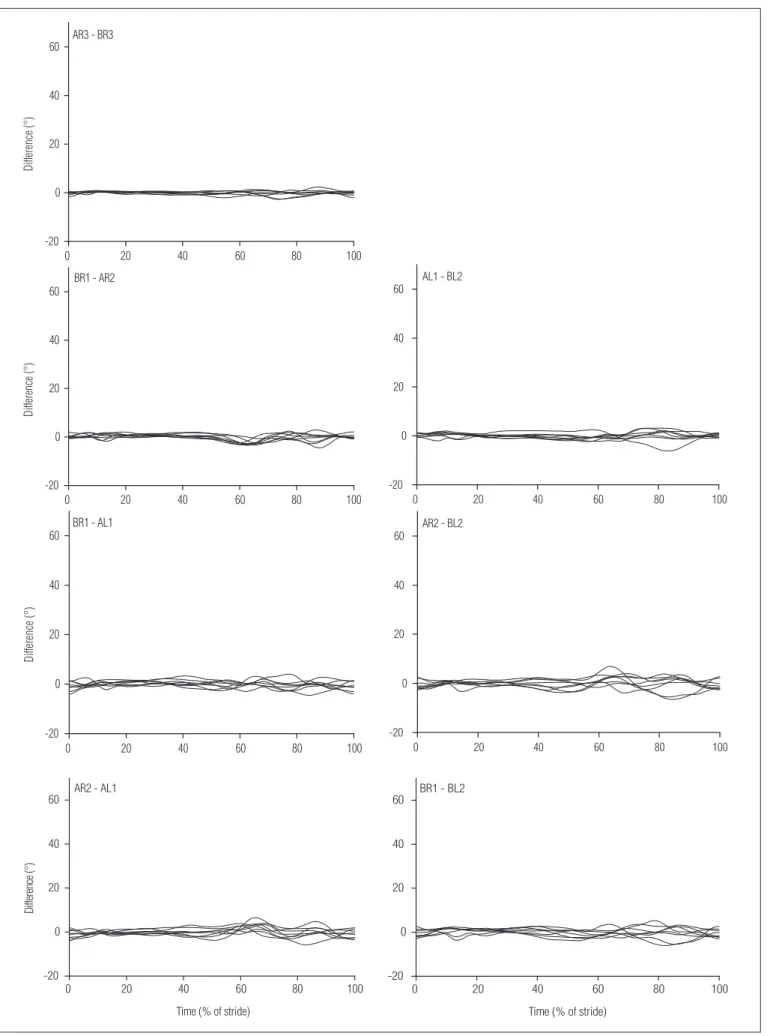
Figure 2. Difference curve graphs for all subjects in regards to each comparison of knee flexion-extension during gait.
0 20 40 60 80 100
-20 0 20 40
60 AR3 - BR3
Di
ffe
re
nc
e
(°)
0 20 40 60 80 100
-20 0 20 40
60 BR1 - AR2
Di
ffe
re
nc
e (°)
0 20 40 60 80 100
-20 0 20 40
60 BR1 - AL1
Di
ffe
re
nc
e
(°
)
0 20 40 60 80 100
-20 0 20 40
60 AR2 - AL1
Di
ffe
re
nc
e (
°)
Time (% of stride)
0 20 40 60 80 100
-20 0 20 40
60 AL1 - BL2
0 20 40 60 80 100
-20 0 20 40
60 AR2 - BL2
0 20 40 60 80 100
-20 0 20 40
60 BR1 - BL2
Time (% of stride)
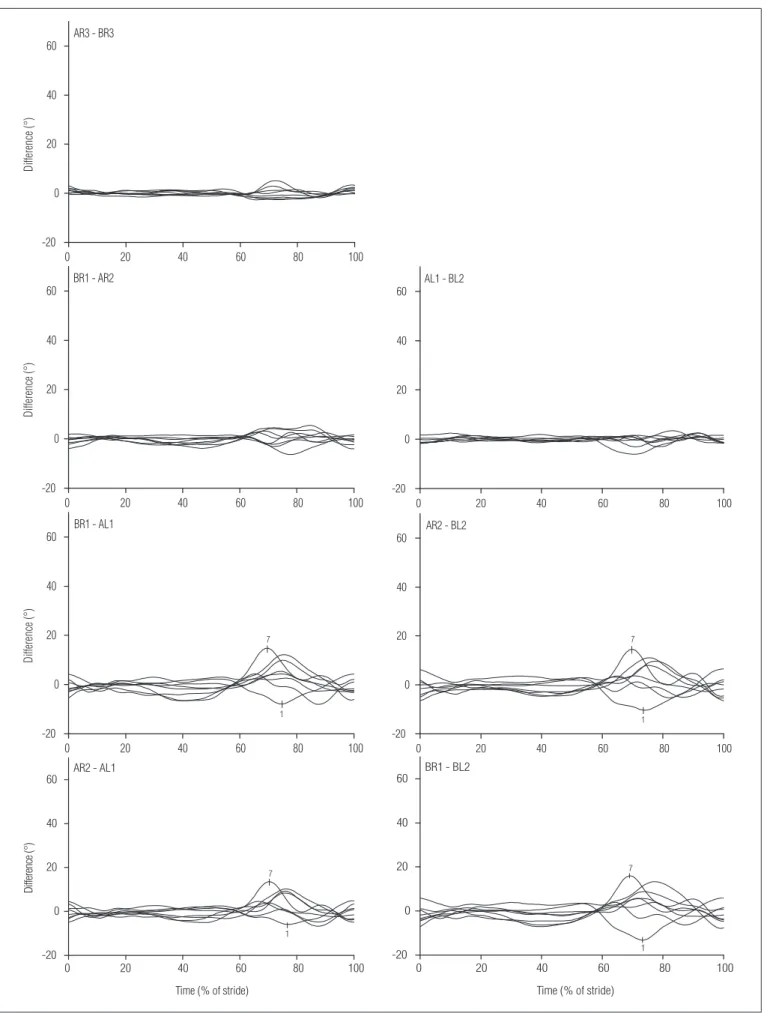
Figure 3. Difference curve graphs for all subjects, in regards to each comparison of knee valgus-varus during gait. In the knee joint comparisons
(knee joint plus sensor and knee joint plus trial), it can be seen that subjects 1 and 7 presented marked differences.
0 20 40 60 80 100
-20 0 20 40
60 AR3 - BR3
Di
ffe
re
nc
e
(°
)
0 20 40 60 80 100
-20 0 20 40
60 BR1 - AR2
Di
ffe
re
nc
e
(°
)
0 20 40 60 80 100
-20 0 20 40
60 AL1 - BL2
0 20 40 60 80 100
-20 0 20 40 60
1 7
BR1 - AL1
Di
ffe
re
nc
e
(°
)
0 20 40 60 80 100
-20 0 20 40 60
1 7
AR2 - BL2
0 20 40 60 80 100
-20 0 20 40 60
1 7
AR2 - AL1
Di
ffe
re
nc
e (
°)
Time (% of stride)
0 20 40 60 80 100
-20 0 20 40 60
1 7
BR1 - BL2
Time (% of stride)
Table 1. Variations (standard deviation – SD;°) due to sensor, trial and knee joint. Mean values relating to eight males are shown, for both flexion/
extension and valgus/varus movements. Nonparametric analysis of variance was applied, and if the results were significant (p<0.05), the Dunn test was applied to test for significant differences (*) between sensor, trial and knee joint.
Sensor Trial Knee joint
Flexion/extension Mean SD 0.48 0.72 1.05
Dunn test sensor - NS *
trial NS - NS
Valgus/varus Mean SD 0.76 0.54 2.22
Dunn test sensor - NS *
trial NS - *
NS – statistically non-significant.
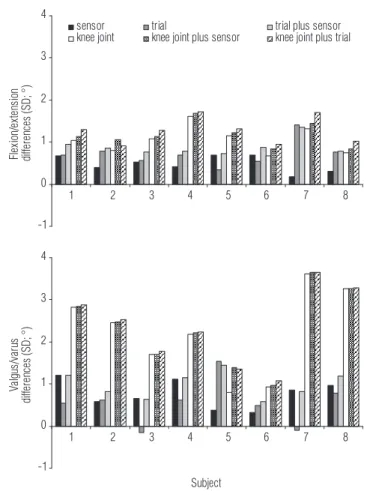
Figure 4. Compound variations (trial plus sensor, knee joint plus sensor
and knee joint plus trial) and separate variations (sensor, trial and knee joint) in flexion/extension and valgus/varus for each subject (SD; °).
-1 0 1 2 3 4
1 2 3 4 5 6 7 8
Fl
ex
io
n/
ex
te
ns
io
n
di
ffe
re
nc
es
(SD
; °
)
sensor trial trial plus sensor
knee joint knee joint plus sensor knee joint plus trial
-1 0 1 2 3 4
1 2 3 4 5 6 7 8
Subject
Va
lg
us
/v
ar
us
di
ffe
re
nc
es
(SD
; °
)
Figures 2 and 3 show the diference curves, for each subject and comparison. For all comparisons, the variation was gener-ally higher for V/V than for F/E. For both F/E and V/V, and for all comparisons, the diferences were more pronounced during the swing phase, i.e. 60 to 100% of stride. Sensor comparisons (AR3-BR3) for both F/E and V/V movements presented smaller deviations from zero values, and the knee curves (plus sensor and plus trial) showed larger deviations from zero, especially for V/V movements. Some subjects showed a diference be-tween the knee joints, which, for all combinations of knee joint plus trial and knee joint plus sensor, was obvious in the graphs. For example, Figure 3 shows that, at the beginning of the swing phase (at about 70% of stride), the valgus angle for the right knee is about 15° greater than for the left knee for subject 7. A diference of similar size, but in the reverse direction and some-what later in the swing phase, can be seen for subject 1.
All sources of variation, presented as SDs, are plotted in Figure 4. In general, the sensors represented the smallest source of variation for both F/E and V/V. Variation due to the trial showed values with greater luctuation than did the varia-tion due to the sensor. For F/E, these variavaria-tions were roughly at the same level, while for V/V, the variation due to the trial was smaller than the variation due to the sensor, for most of the subjects. As expected, the variation due to the trial plus the sensor was greater than the variation due to either the sensor or the trial alone, except for a few instances caused by random efects. he variations due to knee joints presented higher val-ues, and these were generally considerably higher for V/V than for F/E. Of course, the combined variations (knee joint plus sensor and knee joint plus trial) were greater than the knee joint variations alone. However, these diferences were small, especially for V/V, i.e. the relative inluence of sensor and trial on the recording of the knee joint variation was small.
Table 1 shows that, for F/E, the variation due to the sen-sor was smaller than the variation due to the trial (statistically non-signiicant), while the variation due to the knee joint was greater than the variation due to the trial, and signiicantly greater than the variation due to the sensor (p<0.05). For V/V,
the variation due to the trial showed the smallest value and the variation due to the knee joint was signiicantly greater than the variation due to the sensor (p<0.05) and the trial (p<0.05).
Discussion
he knee joint variable had more inluence in determining variation in the results than did the sensor and trial variables, for most of the subjects. Furthermore, the variation was much
greater between the knee joints for V/V than for F/E move-ments. For all sources, the variation was generally greater for the swing phase than for the stance phase.
Individual sensors of the same model can produce difer-ent outcomes in a jig, where no other source of variation that would usually be present in functional situations can occur. Shiratsu and Coury9 reported up to 3° diference between in-dividual sensors (Biometrics Ltd.; XM150B) attached to a jig that reproduced full-range amplitudes for F/E movements and deviations. In the present study, the variations (in SD) intro-duced by the sensors ranged from 0.48° to 0.76°. Considering the diferent measurements for characterizing the diferences between sensors, this is consistent with the above-mentioned study, thus indicating that this source has a small efect on knee joint measurements during gait. However, some crosstalk efect from the sensors can be expected.
Crosstalk, i.e. erroneous recordings of V/V movements dur-ing F/E movements, and vice versa, can occur for three reasons: (1) mechanical deviations in the geometrical properties of the goniometer sensing elements; (2) misalignment of one of the endblocks, resulting in axial rotation of the goniometer; or (3) mounting the goniometer outside of the principal plane of the movement. he irst type of crosstalk is an inherent property ( ingerprint) of the particular goniometer and is of signiicance only for high F/E angles. his error presumably contributes to-wards the diference between the sensors that is observed in the V/V movements during high lexion movements, i.e. dur-ing the swdur-ing phase. he second type of crosstalk will occur if the endblock on the shank is not aligned with the sagittal plane. In this case, pure F/E movements will cause an errone-ous recording of V/V that is proportional to the F/E amplitude7. Prior awareness of this potential source of error was the reason for ensuring strict and careful attachment of the endblocks in the present study. However, for comparisons between the knee joints, the efect of sensor positioning cannot be disregarded. he third source of crosstalk will occur if both endblocks are misaligned in relation to the sagittal plane. If the goniometer were to be placed in the frontal plane, i.e. at the front or back of the knee (although in reality this position is practically impos-sible), the F/E angle would appear in the channel that would record the V/V angle if the goniometer were to be placed in the sagittal plane. Hence, placing the goniometers in any plane that is intermediate between the sagittal and frontal planes will result in crosstalk. For example, to obtain an erroneous re-cording of 12° of V/V with an F/E range of 56°, a misalignment of 26° of one of the endblocks is required12.
Another source of variation is the occurrence of soft tis-sue artifacts due to the relative displacement between the electrogoniometer attachments and the anatomical reference
points that are used to represent the joint angle in the static position8,17,18. Moreover, any angular diferences between the endblocks will be compensated by recording a reference posi-tion (and subtracting the F/E and V/V angles from the sub-sequent recordings), as long as these angular diferences do not change. One possibility for reducing the inluence of local changes is to perform “spatial averaging” by applying a plate or ruler over the thigh and the shank8.
he repeatability of knee movements is clearly dependent on joint stability and adaptability19. Moreover, as the V/V range of movement is small20-23, it can be strongly inluenced by individual anatomical and functional characteristics24,25. Individual characteristics, which were analyzed here as knee joint variation, introduced the highest source of variation. However, these results must be carefully interpreted, as this knee joint variation is close to the variation due to the posi-tioning of the goniometer (as presented in the Methods sec-tion). Other diferent individual characteristics are considered to have an inluence on gait kinematics. Among these are age and gender26-30, which were controlled for in the present study. Furthermore, lateral dominance has been considered to have some inluence on gait kinematics, although this issue still re-mains controversial27,29,30.
Finally, this article has provided guidelines to identify the sources of variation in electrogoniometric recordings of the knee during gait, and has suggested methodological alterna-tives to isolate and correct these sources of variation.
Conclusions
he variation introduced by two separate sensors of the same model applied in one trial was smaller than the variation introduced by recording movements in two consecutive trials using the same sensor, with regard to recording knee move-ments during gait. Nevertheless, the variation introduced by the diference between knee joints was greater than the varia-tions promoted by sensors and trials, and this diference was within the variation due to sensor repositioning. hus, it is preferable to use diferent sensors in the same data recording (simultaneous) than to use the same sensor in two diferent recordings (consecutive).
Acknowledgement
Fundação de Amparo à Pesquisa do Estado de São Paulo (Fapesp) process numbers: 05/59349-6; 05/53804-3; 04/15579-5; 04/07207-0.
1. Smutz P, Serina E, Rempel D. A system for evaluating the effect of keyboard design on force, posture, comfort, and productivity. Ergonomics. 1994;37(10):1649-60.
2. Akesson I, Hansson GA, Balogh I, Moritz U, Skerfving S. Quantifying work load in neck, shoulders and wrists in female dentists. Int Arch Occup Environ Health. 1997;69(6):461-74.
3. Rowe PJ, Myles CM, Walker C, Nutton R. Knee joint kinematics in gait and other functional activities measured using flexible electrogoniometry: how much knee motion is sufficient for normal daily life? Gait Posture. 2000;12(2):143-55.
4. Hansson GA, Balogh I, Byström JU, Ohlsson K, Nordander C, Asterland P et al. Questionnaire versus direct technical measurements in assessing postures and movements of the head, upper back, arms and hands. Scand J Work Environ Health. 2001;27(1):30-40.
5. Juul-Kristensen B, Hansson G-Å, Fallentin N, Andersen JH, Ekdahl C. Assessment of work postures and movements using a video-based observation method and direct technical measurements. Appl Ergon. 2001;32(5):517-24.
6. Arvidsson I, Hansson GA, Mathiassen SE, Skerfving S. Neck postures in air traffic controllers with and without neck/shoulder disorders. Appl Ergon. 2008;39(2):255-60.
7. Hansson GA, Balogh I, Ohlsson K, Rylander L, Skerfving S. Goniometer measurement and computer analysis of wrist angles and movements applied to occupational repetitive work. J Electromyogr Kinesiol. 1996;6:23-35.
8. Rowe PJ, Myles CM, Hillmann SJ, Hazlewood ME. Validation of flexible electrogoniometry as a measure of joint kinematics. Physiotherapy. 2001;87:479-88.
9. Shiratsu A, Coury HJ. Reliability and accuracy of different sensors of a flexible electrogoniometer. Clin Biomech. 2003;18(7):682-4.
10. Hannah RE, Morrison JB, Chapman AE. Kinematic symmetry of the lower limbs. Arch Phys Med Rehabil. 1984;65(4):155-8.
11. Maupas E, Paysant J, Datie AM, Martinet N, André JM. Functional asymmetries of the lower limbs. A comparison between clinical assessment of laterality, isokinetic evaluation and electrogoniometric monitoring of knees during walking. Gait Posture. 2002;16(3):304-12.
12. Hansson GA, Balogh I, Ohlsson K, Skerfving S. Measurements of wrist and forearm positions and movements: effect of, and compensation for, goniometer crosstalk. J Electromyogr Kinesiol. 2004;14(3):355-67.
13. Coury HJCG, Brasileiro JS, Salvini TF, Poletto PR, Carnaz L, Hansson GA. Change in knee kinematics during gait after eccentric isokinetic training for quadriceps in subjects submitted to anterior cruciate ligament reconstruction. Gait Posture. 2006;24(3):370-4.
14. Schwartz MH, Trost JP, Wervey RA. Measurement and management of errors in quantitative gait data. Gait Posture. 2004;20(2):196-203.
15. Winter DA. Kinematic and kinetic pattern in human gait: variability and
compensating effects. Hum Mov Sci. 1984;3:51-76.
16. James CR. Considerations of movement variability in biomechanics research. In: Stergiou N. Innovative analysis of human movement. 1ª ed. Champaign: Human Kinetics; 2004. p. 29-62.
17. Isacson J, Gransberg L, Knutsson E. Three-dimensional electrogoniometric gait recording. J Biomech. 1986;19(8):627-35.
18. Ishii Y, Terajima K, Terashima S, Koga Y. Three-dimensional kinematics of the human knee with intracortical pin fixation. Clin Orthop Relat Res. 1997;343:144-50.
19. Heiderscheit BC. Movement variability as a clinical measure for locomotion. J Appl Biomech. 2000;16:419-27.
20. Chao EY, Laughman RK, Schneider E, Stauffer RN. Normative data of knee joint motion and ground reaction forces in adult level walking. J Biomech. 1983;16(3):219-33.
21. Li XM, Liu B, Deng B, Zhang SM. Normal six-degree-of-freedom motions of knee joint during level walking. J Biomech Eng. 1996;118(2):258-61.
22. Reinschmidt C, van den Bogert AJ, Lundberg A, Nigg BM, Murphy N, Stacoff A et al. Tibiofemoral and tibiocalcaneal motion during walking: external vs. skeletal markers. Gait Posture. 1997;6:98-109.
23. Benoit D, Ramsey DK, Lamontagne M, Xu L, Wretenberg P, Renström P. In vivo knee kinematics during gait reveals new rotation profiles and smaller translations. Clin Orthop Relat Res. 2007;454:81-8.
24. Ramsey DK, Wretenberg PF. Biomechanics of the knee: methodological considerations in the in vivo kinematic analysis of the tibiofemoral and patellofemoral joint. Clin Biomech. 1999;14(9):595-611.
25. Claiborne TL, Armstrong CW, Gandhi V, Pincivero DM. Relationship between hip and knee strength and knee valgus during a single leg squat. J Appl Biomech. 2006;22(1):41-50.
26. Kettelkamp DB, Johnson RJ, Smidt GL, Chao EY, Walker M. An electrogoniometric study of knee motion in normal gait. J Bone Joint Surg. 1970;52(4):775-90.
27. Gundersen LA, Valle DR, Barr AE, Danoff JV, Stanhope SJ, Snyder-Mackler L. Bilateral analysis of the knee and ankle during gait: an examination of relationship between lateral dominance and symmetry. Phys Ther. 1989;69(8):640-50.
28. Benedetti MG, Catani F, Leardini A, Pignotti E, Giannini S. Data management in gait analysis for clinical applications. Clin Biomech. 1998;13(3):204-15.
29. Maupas E, Paysant J, Martinet N, André J. Asymmetric leg activity in healthy subjects during walking, detected by electrogoniometry. Clin Biomech. 1999;14(6):403-11.
30. Sadegui H, Allard P, Prince F, Labelle H. Symmetry and limb dominance in able-bodied gait: a review. Gait Posture. 2000;12(1):34-45.
467