Short Report
S
Printed in Brazil - ©2014 Sociedade Brasileira de Química 0103 - 5053 $6.00+0.00*e-mail: [email protected]
A New Validation Criterion for Guiding the Selection of Variables by the Successive
Projections Algorithm in Classification Problems
Sófacles F. C. Soares,a Roberto K. H. Galvão,b Márcio J. C. Pontesa and Mário C. U. Araújo*,a
aDepartamento de Química, Centro de Ciências Exatas e da Natureza, Universidade Federal da
Paraíba, Caixa Postal 5093, 58051-970 João Pessoa-PB, Brazil
bDivisão de Engenharia Eletrônica, Instituto Tecnológico de Aeronáutica,
12228-900 São José dos Campos-SP, Brazil
Uma simplificação no SPA-LDA é proposta para contornar a necessidade de conjuntos de treinamento e validação separados. O número de graus de liberdade é empregado na função de custo para evitar sobreajuste do modelo. Três exemplos são apresentados: classificação de cafés, diesel e óleos vegetais empregando espectrometria UV-Vis, NIR e voltametria, respectivamente.
A simplification in SPA-LDA is proposed to circumvent the need for separate training and validation sets. The number of degrees of freedom is employed in the cost function to avoid model overfitting. Three examples are presented: classification of coffee, diesel and vegetable oils by using UV-Vis spectrometry, NIR spectrometry and voltammetry, respectively.
Keywords:variable selection, successive projections algorithm, classification, model validation
Introduction
The successive projections algorithm (SPA) is a variable selection method originally proposed for the construction of multivariate calibration models1 and subsequently
extended to address classification problems.2 Applications
of SPA have involved different instrumental techniques and samples as summarized in a recent review paper.3
The SPA formulation for classification problems involves two phases. In the first phase, a sequence of projection operations involving the columns of the instrumental response matrix is employed to form subsets of variables with small collinearity. In the second phase, the best subset is selected on the basis of a cost function associated to the risk of incorrect classification by linear discriminant analysis (LDA). In Pontes et al.,2 and all
subsequent papers,4-11 this cost function was evaluated by
using an external set of validation samples, which were not employed in the construction of the LDA model. This procedure was adopted to avoid model overfitting, which might result if the training set itself was used in the evaluation of the cost function.
Within this scope, two inconveniences related to the use of a separate validation set could be pointed out. Firstly, the analyst is faced with the problem of splitting the available samples into representative training and validation sets, which may not be a straightforward task. Secondly, if the number of samples is too small, it may not be possible to split them into two representative sets. Cross-validation could be an alternative, but the computational effort involved can be substantial, due to the need of constructing an LDA model for each sample (or group of samples) that is removed from the training set in the course of the cross-validation procedure. Another possibility would be the use of the training set itself for validation purposes. However, such an internal validation approach may lead to overfitting as discussed elsewhere.12
voltammetric classification of vegetable oils,5 and
near-infrared (NIR) spectrometric classification of diesel.2
Background and Theory
SPA-LDA
SPA-LDA comprises two phases. In Phase 1, the instrumental responses of the training samples are disposed in a matrix Xtrain of dimensions (Ntrain × K) and then the
training data are centered in the mean of each class. In Xtrain the kth variable xk is associated to the k
th column
vector xk∈ℜ
Ntrain. These column vectors are subjected to a
sequence of projection operations that result in the creation of K chains of variables. The kth chain is initialized with
variable xk and is progressively augmented with variables that display the least collinearity with the previous ones. Because of the loss of degrees of freedom associated to the calculation of the class means, the length of the chains of variables constructed in Phase 1 of SPA-LDA is limited by Ntrain−C, where Ntrain is the number of training samples and C is the number of classes involved in the problem.
In Phase 2, the candidate subsets of variables are evaluated according to a cost function related to the average risk of incorrect classification over the validation set. This cost function is defined as:
(1)
where
(2)
In equation 2, the numerator MD2[x
val,n, –x(In)] is the
squared Mahalanobis distance13 between the nth validation
sample xval,n (of class index In) and the mean –x(In) of its true class (both row vectors) calculated over the training set. This distance is given by
(3)
where S is a pooled covariance matrix calculated over the training set.14,15 The denominator in equation 2 corresponds
to the squared Mahalanobis distance between xval,n and the center of the nearest wrong class. A small value of gn
indicates that xval,n is close to the center of its true class and distant from the centers of the remaining classes. The cost function Jcost is defined as the average value of gn over all validation samples (n = 1, 2, ..., Nval). Therefore, the minimization of Jcostresults in a better separation of the samples according to their true classes.
Use of leave-one-out cross-validation
To avoid the need for a separate validation set, the cost function Jcost could be evaluated by using leave-one-out cross-validation. In this case, the value of gn would be calculated by removing the nth sample from the training set (xtrain,n) and using it as a validation sample, i.e.,
(4)
where the subscript −n in MD2
–n indicates that the class
means –x(I1), –x(I2), …, –x(IC) and pooled covariance matrix S are calculated without using xtrain,n. After repeating the calculation of gn for n = 1, 2, ..., Ntrain, the resulting cost would be given by
(5)
It is worth noting that the evaluation of Jcost in this manner can be very time-consuming. Indeed, the Mahalanobis distance calculations require the determination of a new matrix inverse S-1 for each n. Therefore, a matrix
inversion operation needs to be carried out Ntraintimes for each candidate subset of variables. For this reason, to the authors’ knowledge this alternative has not been exploited in previous works involving SPA-LDA.
Internal validation and proposed criterion
An internal validation could be carried out by calculating the value of gn as
(6)
In this case, the class means –x(I1), –x(I2), …, –x(IC) and pooled covariance matrix S are calculated by using all training samples, including xtrain,n. The resulting cost is then calculated as in equation 5. It is worth noting that the computational workload is much smaller as compared to the use of cross-validation because a single matrix inverse S−1 is employed for
n = 1, 2, ..., Ntrain. However, such a procedure may lead to overfitting because the classification model is built and validated by using the same samples. As a result, the cost would tend to decrease as more variables are included in the model. To circumvent this problem, the criterion proposed in the present work consists of calculating the cost as
where L is the number of variables in the candidate subset under evaluation. In this case, the denominator consists of the number of degrees of freedom, rather than the overall number of training samples. Therefore, a candidate subset with a larger number of variables (i.e., with a larger value of L) will only be favoured if the decrease in the gn values is large enough to offset the decrease in the denominator of equation 7.
Experimental
Data sets
The coffee data set consists of 175 UV-Vis spectra of aqueous extracts of ground coffee, which were recorded in the range 225-353 nm. A detailed description of the experimental conditions can be found in a previous work.7 The problem consists of discriminating the
samples with respect to type (caffeinated/decaffeinated) and conservation state (expired/non-expired shelf life). Therefore, four classes are considered in the study, namely non-expired decaffeinated, non-expired caffeinated, expired decaffeinated, expired caffeinated.
The vegetable oil data set consists of 114 square-wave voltammograms of canola, sunflower, corn and soybean oil samples in the range −0.9 to −0.04 V. Details regarding the optimization of the experimental conditions were presented in.5 Some of the samples had been stored for several months
past the expiry date. These “expired” samples were gathered into a single group for classification purposes. Therefore, the problem involves five classes (canola, sunflower, corn, soybean and expired).
The third data set consists of 128 NIR spectra of diesel samples, which were acquired in the range 880-1600 nm. A first derivative Savitzky-Golay filter with a second-order polynomial and an 11-point window was applied to the spectra in order to remove baseline features. The problem consists of classifying the diesel samples according to sulfur content (low and high) as detailed in Pontes et al..2
Training, validation and test sets
The samples were divided into training, validation, and test sets by applying the classic Kennard-Stone (KS) uniform sampling algorithm16 to each class separately. The
number of samples in each set is presented in Table 1. In the cross-validation and internal validation procedures, the training and validation sets were combined into a single training set.
Software
All calculations were carried out by using the MATLAB® 2010a software.
Results and Discussion
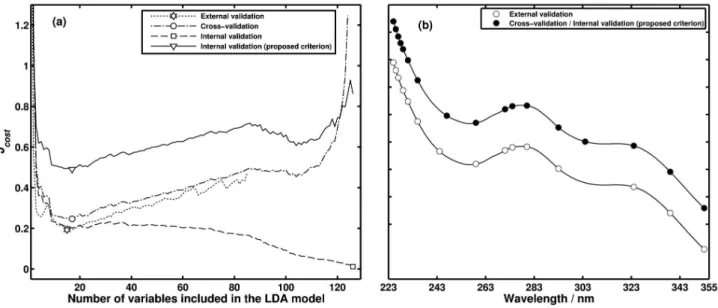
Figure 1a presents the curves of cost versus number of variables included in the LDA model for the coffee data set. The curves correspond to the four validation methods under investigation (external validation, cross-validation, internal validation, and internal validation using the proposed criterion). In each of these curves, the number of variables was increased up to the point where the pooled covariance
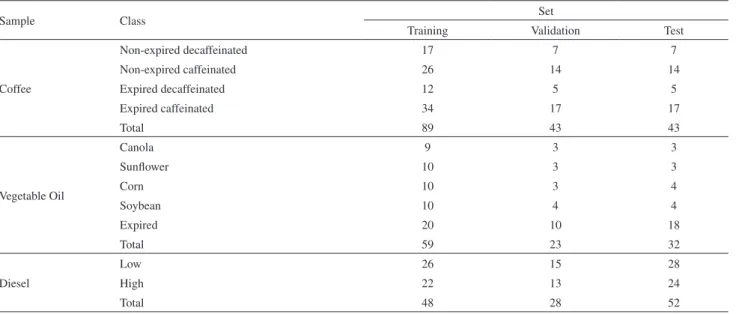
Table 1. Number of training, validation and test samples in each class
Sample Class Set
Training Validation Test
Coffee
Non-expired decaffeinated 17 7 7
Non-expired caffeinated 26 14 14
Expired decaffeinated 12 5 5
Expired caffeinated 34 17 17
Total 89 43 43
Vegetable Oil
Canola 9 3 3
Sunflower 10 3 3
Corn 10 3 4
Soybean 10 4 4
Expired 20 10 18
Total 59 23 32
Diesel
Low 26 15 28
High 22 13 24
matrix S was deemed to be close to singularity, according to the default settings of the Matlab software.
As can be seen, the cost for internal validation (with no correction to account for the degrees of freedom) exhibits decreasing values up to the maximum number of variables employed in the construction of the curve, which points to an overfitting problem. In contrast, the use of the proposed criterion resulted in a cost function profile with a minimum point at 17 variables. Interestingly, these variables were the same as those selected by cross-validation. The use of external validation resulted in 15 variables. As can be seen in Figure 1b, the subsets of selected variables are remarkably similar, which indicates that the external
validation, cross-validation, and internal validation (with the proposed criterion) procedures are roughly equivalent. The LDA models obtained with the selected variables were applied to the classification of the test set. As a result, all 43 test samples were correctly classified.
The corresponding graphs for the vegetable oil data set are presented in Figure 2. Again, if the correction for degrees of freedom is not employed, the internal validation cost exhibits decreasing values up to the end of the curve. In contrast, a minimum point at 12 variables was achieved as the result of using the proposed criterion. Once more, these variables corresponded to those selected by cross-validation. The use of external validation resulted
Figure 1. Coffee data set: (a) Plots of the cost function versus number of variables included in the LDA model; (b) average UV-Vis spectrum of the data set with indication of the selected variables (the same spectrum is also presented with a vertical offset for better visualization of the markers).
in 10 variables. As can be seen in Figure 2b, the subsets of selected variables are remarkably similar, which corroborates the conclusions obtained with the coffee data set. By using the LDA models obtained with the selected variables, all 32 test samples were correctly classified.
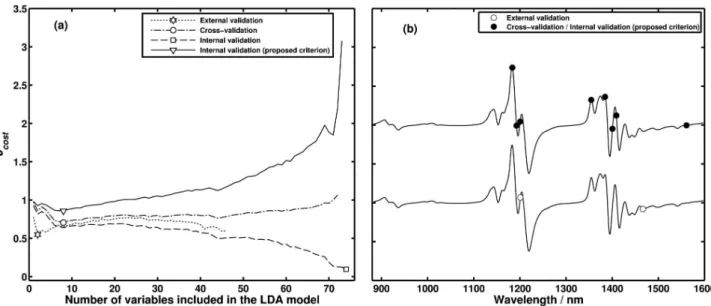
Finally, Figure 3 presents the results for the diesel data set. As in the previous cases, the internal validation cost exhibits decreasing values up to the end of the curve. The use of the proposed criterion resulted in a cost curve with a minimum at 8 variables, which again corresponded to those selected by cross-validation. The use of external validation resulted in 2 variables. The selected variables are presented in Figure 3b. In contrast to the findings obtained in the coffee and vegetable oil cases, the external validation outcome was markedly different from the result obtained by cross-validation and internal validation with the proposed criterion. By applying the resulting LDA models to the classification of the 52 test samples, 11 errors (external validation) and 2 errors (cross-validation/internal validation with the proposed criterion) were obtained. In view of the worse classification accuracy of the LDA model obtained by external validation, it may be argued that the validation set was not selected in a suitable manner. Indeed, as discussed in the Introduction, the division of the modelling data into representative training and validation sets may not be a straightforward task. Therefore, these findings support the use of either cross-validation or internal validation (with appropriate correction for the degrees of freedom) as possible alternatives to the use of external validation.
In brief, the classification results obtained in this investigation can be summarized as follows. In the coffee and vegetable oil case studies, all test samples were
correctly classified, i.e., the classification accuracy was 100%, regardless of the validation technique employed in SPA-LDA. In the diesel study, the classification accuracy was 79% (11 errors out of 52 test samples) with external validation and 96% (2 errors out of 52 test samples) with cross-validation or internal validation with the proposed criterion. In view of the classification errors, the diesel results can also be expressed in terms of sensitivity (number of true positive decisions/total number of positive cases) and specificity (number of true negative decisions/total number of negative cases) rates.17 For this purpose, samples
with low and high sulphur content can be considered as negative and positive cases, respectively. As a result, the sensitivity and specificity rates were 79% by using external validation (6 false positives and 5 false negatives). In contrast, the use of cross-validation or internal validation with the proposed criterion resulted in a sensitivity rate of 100% (no false negatives) and a specificity rate of 93% (2 false positives).
Conclusions
SPA-LDA has been successfully used to build classification models in a variety of analytical applications. However, alternatives to the external validation procedure employed in the variable selection process had not been investigated in previous works.4-11 In this context, the
present paper proposed a criterion for internal validation in SPA-LDA, which accounts for the number of degrees of freedom in order to avoid model overfitting. The use of SPA-LDA is thus simplified because the analyst is no longer required to divide the modeling samples into
training and validation sets. In comparison with the use of cross-validation, the proposed approach involves a smaller computation effort because a single LDA model needs to be constructed to evaluate each subset of variables.
The utility of the proposed criterion was investigated in three analytical problems, namely UV-Vis spectrometric classification of coffee, voltammetric classification of vegetable oils, and NIR spectrometric classification of diesel. In the coffee and vegetable oil case studies, the same variables were selected by using either cross-validation or internal validation (with appropriate correction for the degrees of freedom) and all the samples in the test set were correctly classified. Similar results were obtained by using external validation. However, in the diesel case study the use of external validation led to an underfitting problem, i.e., the number of selected variables was too small, which resulted in an LDA model with only 79% of classification accuracy in the test set. In contrast, a classification accuracy of 96% was obtained by employing either cross-validation or internal validation with the proposed criterion. In view of the smaller computational effort required by internal validation, as compared to cross-validation, the proposed criterion can thus be considered a suitable alternative for use with SPA-LDA.
Acknowledgment
The authors thank CNPq (research fellowships and doctoral scholarships) for partial financial support.
References
1. Araújo, M. C. U.; Saldanha, T. C. B.; Galvão, R. K. H.; Yoneyama, T.; Chame, H. C.; Visani, V.; Chemom. Intell. Lab. Syst.2001, 57, 65.
2. Pontes, M. J. C.; Galvão, R. K. H.; Araújo, M. C. U.; Moreira, P. N. T.; Pessoa Neto, O. D.; José, G. E.; Saldanha, T. C. B.; Chemom. Intell. Lab. Syst. 2005, 78, 11.
3. Soares, S. F. C.; Gomes, A. A.; Galvão Filho, A. R.; Araújo, M. C. U; Galvão, R. K. H.; TrAC, Trends Anal. Chem.2013, 42, 84.
4. Pontes, M. J. C.; Cortez, J.; Galvão, R. K. H.; Pasquini, C.; Araújo, M. C. U.; Coelho, R. M.; Chiba, M. K.; Abreu, M. F.; Madari, B. E.; Anal. Chim. Acta 2009, 642, 12.
5. Gambarra-Neto, F. F.; Marino, G.; Araújo, M. C. U.; Galvão, R. K. H.; Pontes, M. J. C.; Medeiros, E. P.; Lima, R. S.; Talanta
2009, 77, 1660.
6. Moreira, E. D. T.; Pontes, M. J. C.; Galvão, R. K. H.; Araújo, M. C. U.; Talanta2009, 79, 1260.
7. Souto, U. T. C. P.; Pontes, M. J. C.; Silva, E. C.; Galvão, R. K. H.; Araújo, M. C. U.; Sanches, F. A. C.; Cunha, F. A. S.; Oliveira, M. S. R.; Food Chem. 2010, 119, 368.
8. Pontes, M. J. C.; Pereira, C. F.; Pimentel, M. F.; Vasconcelos, F. V. C.; Silva, A. G. B.; Talanta 2011, 85, 2159.
9. Ghasemi-Varnamkhasti, M.; Mohtasebi, S. S.; Rodriguez-Mendeza, M. L.; Gomes, A. A.; Araújo, M. C. U.; Galvão, R. K. H.; Talanta 2012, 89, 286.
10. Silva, C. S.; Borba, F. S. L.; Pimentel, M. F.; Pontes, M. J. C.; Honorato, R. S.; Pasquini, C.; Microchem. J.2013, 109, 122. 11. Silva, A. C.; Pontes, L. F. B. L.; Pimentel, M. F.; Pontes,
M. J. C.; Talanta 2012, 93, 129.
12. Pontes, M. J. C.; Gomes, A. A.; Galvão, R. K. H.; Araújo, M. C. U.; NIR News 2012, 23, 6.
13. Maesschalck, R.; Jouan-Rimbaud, D.; Massart, D. L.; Chemom. Intell. Lab. Syst. 2000, 50, 1.
14. Wu, W.; Mallet, Y.; Walczak, B.; Penninckx, W.; Massart, D. L.; Heuerding, S.; Erni, F.; Anal. Chim. Acta 1996, 329, 257. 15. Duda, R. O.; Hart, P. E.; Stork, D. G.; Pattern Classification,
2nd ed.; Wiley: New York, 2001.
16. Kennard, R. W.; Stone, L. A.; Technometrics 1969, 11, 137. 17. Massart, D. L.; Vandeginste, B. G. M.; Buydens, L. M. C.;
De Jong, S.; Lewi, P. J.; Smeyers-Verbeke, J.; Handbook of Chemometrics and Qualimetrics: Part A; Elsevier: Amsterdam,
1997.
Submitted: June 21, 2013
Published online: November 6, 2013