Skeletal maturation in individuals with Down’s
syndrome: Comparison between PGS curve, cervical
vertebrae and bones of the hand and wrist
Glauber Carinhena1, Danilo Furquim Siqueira2, Eduardo Kazuo Sannomiya2
Introduction: This study was conducted with the aim of adapting the methods developed by Martins and Sakima to assess skeletal maturation by cervical vertebrae in the pubertal growth spurt (PGS) curve. It also aimed to test the reliabil-ity and agreement between those methods and the method of hand and wrist radiograph when compared two by two and all together. Methods: The sample comprised 72 radiographs, with 36 lateral radiographs of the head and 36 hand-wrist radiographs of 36 subjects with Down’s syndrome (DS), 13 female and 23 male, aged between 8 years and 6 months and 18 years and 7 months, with an average age of 13 years and 10 months. Results and Conclusions: Results revealed that adapting the methods developed by Martins and Sakima to assess skeletal maturation by cervical vertebrae in the curve of PGS is practical and useful in determining the stage of growth and development of individuals. The stages of maturation evaluated by cervical vertebrae and ossification centers observed in radiographs of the hand and wrist were considered reliable, with excellent level of agreement between the methods by Hassel and Farman as well as Baccetti, Franchi and McNamara Jr and Martins and Sakima. Additionally, results revealed an agreement that ranged between reasonable to good for the three methods used to assess the skeletal maturation, showing statistical significance.
Keywords:Down’s syndrome. Cervical vertebrae. Age determination by skeleton. Sesamoid bones.
How to cite this article: Carinhena G, Siqueira DF, Sannomiya EK. Skel-etal maturation in individuals with Down’s syndrome: Comparison between PGS curve, cervical vertebrae and bones of the hand and wrist. Dental Press J Orthod. 2014 July-Aug;19(4):58-65. DOI: http://dx.doi.org/10.1590/2176-9451.19.4.058-065.oar
Submitted: May 5, 2009 - Revised and accepted: October 31, 2009
Contact address: Glauber Carinhena E-mail: [email protected]
1 PhD in Orthodontics, School of Dentistry — University of São Paulo/Bauru.
2 MSc in Orthodontics, Methodist University of São Paulo (UMESP).
» The authors report no commercial, proprietary or financial interest in the products or companies described in this article.
DOI: http://dx.doi.org/10.1590/2176-9451.19.4.058-065.oar
Introdução: esse estudo foi realizado com o propósito de adaptar os métodos para avaliação da maturação óssea por meio das vértebras cervicais na curva do Surto de Crescimento Puberal (SCP)de Martins e Sakima, assim como testar a confiabilidade e a concordância existente entre eles e o método para a radiografia de mão e punho, quando comparados 2 a 2, e entre todos, conjuntamente. Métodos: a amostra constou de 72 radiografias, sendo 36 telerradiografias em norma lateral da cabeça e 36 radiografias de mão e punho, de 36 indivíduos com Síndrome de Down (SD), sendo 13 do sexo feminino e 23 do masculino, na faixa etária entre oito anos e seis meses até 18 anos e sete meses, com média de 13 anos e dez meses. Conclusão: de acordo com os resultados obtidos, concluímos que as adaptações dos métodos para a avaliação da maturação óssea por meio das vértebras cervicais na curva de SPC de Martins e Sakima resultaram em uma ferramenta prática e útil na determinação do estágio de crescimento e desenvolvimento dos indivíduos. Os estágios de maturação avaliados por meio das vértebras cervicais e os centros de ossificação observados nas radiografias de mão e punho foram considerados confiáveis, com excelente grau de concordância entre os métodos de diversos outros autores, e uma con-cordância de razoável a boa entre os três métodos para avaliação da maturação óssea quando comparados conjuntamente, sendo estatisticamente significativa.
INTRODUCTION
The literature does not reach a consensus regarding the use of chronological age to estimate the start and end of facial growth. In other words, it is not considered a reliable parameter to assess the stage of pubertal growth of an individual. Skeletal maturation is inluenced by constitutional-genetic, hormonal, nutritional, socio-economic, climatic and seasonal as well as biochemical-pharmacological factors, which may delay or speed up due to several diseases. The Down’s syndrome is among
the most frequent causes of skeletal age retardation.22
Over the past years, the interest in studying in-dividuals with chromosome 21 trisomy or Down’s syndrome (DS) has increased. The pattern of skeletal maturation in individuals with DS has been widely in-vestigated because the reports on the bone age of these
individuals are controversial.4,18 The literature reports
methods that are employed to determine the biologi-cal age of individuals without Down’s syndrome; how-ever, it is not known for certain the validity of these methods in a syndromic population.
The methods considered as reliable refer-ences to identify the stages of maturation dur-ing the pubertal growth spurt (PGS) are hand
and wrist radiography,6,8,13,23 lateral cephalometric
radiograph,3,17,21 or both.2,19
In 1949, Greulich and Pyle13 observed variations in
the bone structures revealed by 60 radiographs of the hand and wrist, from birth to adulthood. This study originated an atlas that included the average data of al-terations and provided the parameters of normality that serve as the basis for research and diagnostics of
ossiica-tion centers. In addiossiica-tion, Fishman8 proposed a method
for radiographic evaluation of the Skeletal Maturation Index (SMI) of which 11 indicators are evinced during adolescence. The sequence of the four stages of matura-tion, which proved stable, progressed by the increase in width of the selected epiphyseal, ossiication of the ad-ductor sesamoid, capping of the epiphysis over the shats
and inally their merging. Martins and Sakima23
advo-cated the graph of the PGS curve with the sequence of mineralization phase of ossiication centers of the hand and wrist, determining whether the rate of growth was in ascending or descending phase.
Hassel and Farman17 assessed the stage of skeletal
maturation of the cervical vertebrae and proposed a
variation of the method advocated by Lamparski,21
correlating lateral cephalometric radiographs with ra-diographs of the hand and wrist. As a result, they es-tablished six stages of maturation and concluded that it is possible to determine reliable positions in relation to the degree of skeletal maturation in cervical vertebrae and the potential for future growth of individuals. Re-producibility of this method was proved by Santos
et al,29 thus corroborating the results by Hassel and
Farman.17 Baccetti, Franchi and McNamara Jr,3 who
described a new version for the review of the Stages of Maturity in these bones in order to detect the mo-ment when an individual is at the peak of mandibular growth. Their method was based on the changes in size and shape of the vertebral body, and establishes ive stages of maturation instead of six, as in the method of
Hassel and Farman.17
In the literature, there are studies reporting the level of agreement between the ossiication centers of the hand and wrist and the cervical vertebrae maturation (CVM). These studies obtained statistically signiicant
results proving the reliability of the tested methods.2,19,30
Although the indexes for each stage of skeletal matu-ration are estimated, the issue related to the type of clas-siication exists. In other words, the analysis by Martins
and Sakima23 enables one to determine the individual’s
exact location in the PGS curve, what does not oc-cur in the subjective methods of CVM by Hassel and
Farman17 as well as Baccetti, Franchi and McNamara
Jr,3 both of which allow the pubertal growth stage to
be estimated. Therefore, this study proposes an
adapta-tion of the methods developed by Martins and Sakima23
used to assess cervical vertebrae maturation (CVM) in the PGS curve, as well as to determine reliability and agreement among the methods when compared two by two and all together.
MATERIAL AND METHODS
The sample comprised 72 radiographs, 36 lateral cephalometric radiographs and 36 radiographs of hand and wrist from 36 individuals with Down’s syndrome aged between 7 years and 8 months and 18 years and 9 months. Methods were based on the agreement analysis of three distinct methods used to assess skeletal
matura-tion: Martins and Sakima,23 for hand and wrist
radio-graphs; Hassel and Farman17 as well as Baccetti, Franchi
and McNamara Jr3 for lateral cephalometric radiographs
For each one of the CVM assessment methods3,17 the subjects were classiied according to their maturation stage or index. Nevertheless, all methods classiied each phase of maturation diferently, that is, the irst prises six stages of maturation, whereas the second com-prises ive stages. Therefore, adjustments were made in order to visualize each method in the PGS curve, as well
as in the method developed by Martins and Sakima,23
allowing statistical analysis to be carried out with the same type of classiication.
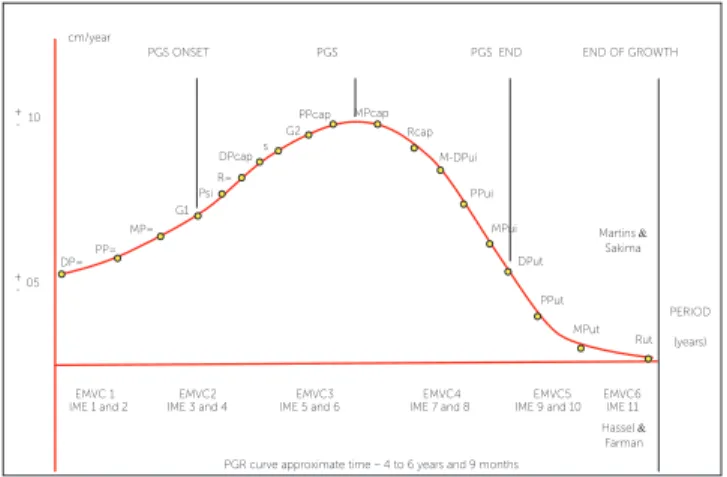
Adaptation process to visualize the CVM by Hassel
and Farman’s method17 in the PGS curve
The stages of maturation have their own characteris-tics, so the morphological changes indicate diferent ex-pectations of growth and development for the individual characterized by narrowing of the intervertebral space and changes in the contour of the vertebrae. Hassel and
Farman17 separated Fishman’s8 11 skeletal maturation
indexes (SMI) and correlated them with the shape of the contour of the cervical vertebrae (C2, C3 and C4), thus creating six distinct stages (Fig 2).
The adaptation of Hassel and Farman’s17 stages was
possible due to the correspondence between CVM 1
and Fishman’s8 SMI 1 and 2, located at the beginning of
Martins and Sakima’s23 curve. Examinations performed
to assess the cervical vertebrae revealed that Hassel and
Farman’s17 method comprised the highest number of
stages: six stages against ive for Baccetti, Franchi and
McNamara Jr’s.3 For this reason, it was necessary to
di-vide the six stages in the PGS curve developed by
Mar-tins and Sakima23 (Fig 3).
Adaptation process to visualize the CVM by
Baccetti, Franchi and McNamara Jr’s method3
Baccetti, Franchi and MacNamara3 proposed a new
visual method which consisted on assessing the morpho-logical characteristics of three cervical vertebrae (C2, C3 and C4) and included ive stages (CVM I to V). Similarly
to the method by Hassel and Farman,17 the ive stages of
Baccetti, Franchi and McNamara Jr3 had to be adapted in
the PGS curve (Fig 4).
This adaptation was performed according to reports provided by the authors, especially with regards to the mandibular growth peak occurring between CVM II and III and which is not achieved without CVM I and II. CVM V is recorded at least two years ater the growth peak. For example, the peak of mandibular growth occurs within one year ater the CVM II stage. Thus, this phase ranges from G1 to the peak of PGS, and according to Martins
and Sakima,23 the G1 phase begins 1 year before reaching
the peak of PGS. Figure 4 depicts where each CVM stage is located in the pubertal growth curve.
The methods used in this study allowed us to super-impose the visualization techniques of cervical vertebrae maturation over the PGS curve. New scores were assigned ater dividing growth curve into ive stages of ossiication: A, B, C, D and E. These stages correspond to a group of ossiication phenomena present in the PGS curve (Fig 5).
Two weeks ater assessing lateral cephalometric
ra-diographs (T1) by the methods developed by Hassel and
Farman17 as well as Baccetti, Franchi and McNamara Jr,3
and ater assessing the hand and wrist radiographs by the
method developed by Martins and Sakima,23 the tests
were repeated (T2).
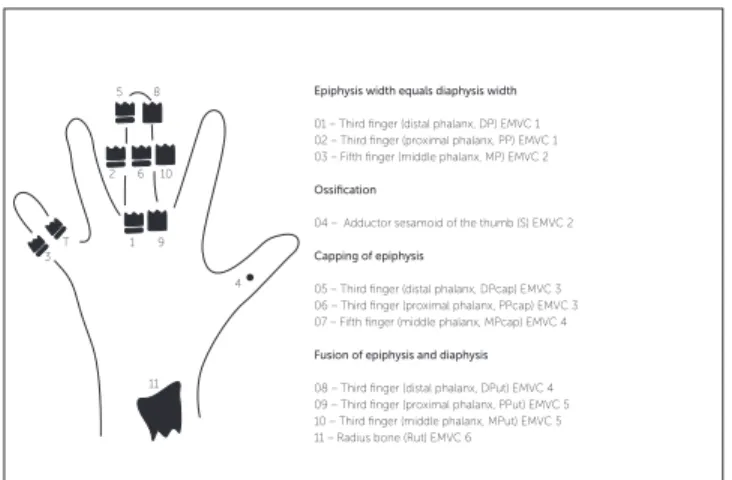
Figure 1 - Graphical representation of individuals distributed in the PGS curve. Figure 2 - Fishman’s8 indicators of skeletal maturation.
Epiphysis width equals diaphysis width
01 – Third finger (distal phalanx, DP) EMVC 1 02 – Third finger (proximal phalanx, PP) EMVC 1 03 – Fifth finger (middle phalanx, MP) EMVC 2
Ossification
04 – Adductor sesamoid of the thumb (S) EMVC 2
Capping of epiphysis
05 – Third finger (distal phalanx, DPcap) EMVC 3 06 – Third finger (proximal phalanx, PPcap) EMVC 3 07 – Fifth finger (middle phalanx, MPcap) EMVC 4
Fusion of epiphysis and diaphysis
08 – Third finger (distal phalanx, DPut) EMVC 4 09 – Third finger (proximal phalanx, PPut) EMVC 5 10 – Third finger (middle phalanx, MPut) EMVC 5 11 – Radius bone (Rut) EMVC 6 cm/year
PGS PGS END
10 + -05 + -6 2 7 3 10 6 11 13 14 17 18 20 19 34 32 35 30 9 15 31 28 29 25 22 24 23 36 26 27 16 1 21 12 8 4 33 DP=PP= MP= G1 Psi R= DPcap PPcap MPcap Rcap M-DPui PPui MPui DPut PPut MPut Rut s G2
Kappa agreement index = 0.80 (P < 0.0001).
Table 3 - Error of the method assessed by means of agreement analysis for evaluation of skeletal maturation by Martins and Sakima’s method.23
T2
T1 DP PP MP Psi R S MPcap M-DPui MPui DPut PPut MPut Rut Total
Total 2 1 2 1 2 3 2 1 2 3 2 12 3 36
Kappa agreement index was used to assess the agree-ment between methods, a nonparametric test. Signii-cance level was set at 5%.
RESULTS
Tables 1 to 3 show the results of the agreement analyses. These analyses were carried out between
measurements taken at two diferent times (T1 and T2)
with a view to assessing skeletal maturation in
rela-tion to Hassel and Farman’s,17 Baccetti, Franchi and
McNamara Jr’s3 as well as Martins and Sakima’s23
methods, respectively. Tables 1 to 3 also show that the three methods studied herein present a statistically
signiicant correlation (P < 0.05) between T1 and T2,
thus indicating excellent level of agreement between measurements (Kappa > 0.75). Therefore, satisfactory calibration was obtained for the classiication criteria applied to the measures of each method.
Figure 3 - Schematic location of Hassel and Farman’s17 stages in the PGS
curve.
Figure 4 - Transposing the stages by Baccetti, Franchi and McNamara Jr3
into Martins and Sakima’s PGS curve.
Figure 5 - Transposing the methods in the PGS curve. Stage A - When the individual is at DP=, PP= or MP=. Stage B - When the individual is at G1, Psi, R=, DPcap, S or G2.
Stage C - When the individual is at PPcap, MPcap, Rcap, M-DPui, MPui or DPut. Stage D - When the individual is at PPut or MPut.
Stage E - When the individual is at Rut.
Table 1 - Error of the method assessed by means of agreement analysis for evaluation of skeletal maturation by Hassel and Farman’s method.17
Table 2 - Error of the method assessed by means of agreement analysis for evalua-tion of skeletal maturaevalua-tion by Baccetti, Franchi and McNamara Jr’s method.3
Kappa agreement index = 0.76 (P < 0.0001). Kappa agreement index = 0.84 (P < 0.0001).
T2
T1 A B C D Total
Total 02 10 11 13 36
T2
T1 A B C D Total
Total 02 10 12 12 36
cm/year
PGS PGS END
10 + -05 + -EMVC6 EMVC5 EMVC4 EMVC3
PGR curve approximate time – 4 to 6 years and 9 months EMVC2 EMVC 1 DP= PP= MP= G1 Psi R= DPcap PPcap MPcap Rcap M-DPui PPui MPui DPut PPut MPut Rut s G2 IME 11 IME 9 and 10 IME 7 and 8
IME 5 and 6 IME 3 and 4
IME 1 and 2
END OF GROWTH
Martins &
Sakima
Hassel &
Farman PERIOD
(years) PGS ONSET
cm/year
PGS PGS END 10 + -05 +
-MVC I MVC II MVC III MVC IV MVC V Baccetti, 2002 DP= PP= MP= G1 Psi R= DPcap PPcap MPcap Rcap M-DPui PPui MPui DPut PPut MPut Rut S G2
END OF GROWTH
PERIOD (years) PGS ONSET EMVC6 EMVC5 EMVC4 EMVC3
PGR curve approximate time – 4 to 6 years and 9 months EMVC2
EMVC 1
IME 11 IME 9 and 10 IME 7 and 8 IME 5 and 6 IME 3 and 4
IME 1 and 2 cm/year
PGS PGS END
10 + -05 +
-MVC I MVC II MVC III MVC IV Baccetti, Franchi and MacNamara Jr3
MVC V DP= PP= MP= G1 PsiR= DPcap PPcap MPcap Rcap M-DPui PPui MPui DPut PPut
Martins and Sakima23
MPut
Hassel e Farman17
Fishman8
Rut S
G2
END OF GROWTH
Kappa agreement index = 0.80 (P < 0.0001).
Table 4 - Agreement analysis between the methods by Hassel and Farman,17 and
Baccetti, Franchi and McNamara Jr3 for evaluation of skeletal maturation.
Baccetti, Franchi and Macnamara Jr3
Hassel and
Farman17 A B C D E Total
Total 02 10 11 13 0 36
Kappa agreement index = 0.77 (p < 0.0001).
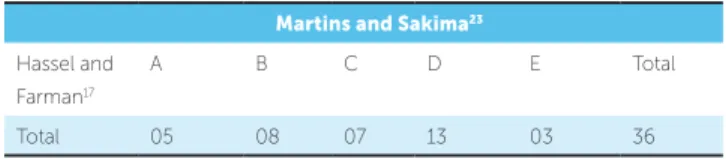
Table 5 - Agreement analysis between the methods by Hassel and Farman,17
and Martins and Sakima23 for evaluation of skeletal maturation.
Martins and Sakima23
Hassel and Farman17
A B C D E Total
Total 05 08 07 13 03 36
Kappa agreement index = 0.81 (P < 0.0001).
Table 6 - Agreement analysis between the methods by Baccetti, Franchi and McNamara Jr,3 and Martins and Sakima23 for evaluation of skeletal maturation.
Martins and Sakima23
Baccetti, Franchi and
MacNamara3
A B C D E Total
Total 05 08 07 13 03 36
Kappa agreement index = 0.63 (P < 0.0001).
Table 7 - Agreement analysis between the methods by Hassel and Farman,17
Baccetti, Franchi and McNamara Jr,3 and Martins and Sakima23 compared all
together for evaluation of skeletal maturation.
Response
Individuals A B C D E Total
Total 9 28 30 38 3 108
The blue diagonal line highlighted in Tables 1 to 3 refers to cases in which both measurements agree.
Tables 4 to 6 show agreement of inal results among the three methods of assessing skeletal maturation compared two by two. The data obtained show an excellent level of
statistically signiicant (P< 0.05) agreement (Kappa > 0.75)
between the methods by Hassel and Farman17 and Baccetti,
Franchi and McNamara Jr;3 Hassel and Farman17 and
Mar-tins and Sakima;23 and Baccetti, Franchi and McNamara Jr3
and Martins and Sakima.23 Thus, the methods evaluated
two by two are similar in terms of classiication of skeletal maturation. The blue diagonal line highlighted in Tables 4 to 6 refers to cases in which both methods agree.
Table 7 shows that there is a statistically signii-cant correlation that ranges from reasonable to good (0.40 < Kappa < 0.75) when the three methods used to assess skeletal maturation are compared all together.
DISCUSSION
The process of skeletal maturation is directly related to height, speed and speciic amounts of craniofacial growth; however, no pattern can be established on the basis of simple chronology, only. Every individual under-goes a particular sequence of events and, for this reason, generalizing the descriptions of maturation stages associ-ating them with the skeletal growth curve determined for the population as a whole can lead to error. Therefore, the concept of “normal skeletal age” should be questioned
and the individuality of diagnosis should be valued.9
Several parameters are employed to predict the stage in which an individual is on the growth curve, namely: Chronological, dental and circumpubertal ages, which not only consider the emergence of sec-ondary sexual and skeletal characteristics, but also the height-weight ratio. Since an individual’s chrono-logical age is not reliable to determine the beginning and end of facial growth, the skeletal age should be determined to define the individual’s stage of biologi-cal growth, given that it proves to be the most reliable
parameter for biological evaluation.6,20,27,29
Skeletal maturation is inluenced by constitutional-genetic, hormonal, nutritional, socioeconomic, climatic, seasonal, as well as biochemical-pharmacological fac-tors, which may delay or speed up due to the presence of several diseases. Down’s syndrome is among the most frequent causes of skeletal age retardation.
The pattern of skeletal maturation in individuals with DS has been widely investigated because the re-ports on the skeletal age of these individuals are
con-troversial.4,15,18 According to Marcondes,22 the concept
of bone age does not apply to newborns (non-carriers of chromosome 21 trisomy), given that the irst carpal core is only observed ater the third month. This
ind-ing confronts the studies by Hall,16 which claims to be
possible to determine bone age at this stage of life by means of the ossiication centers of individuals with DS.
According to the literature, the stage of maturation is inluenced by factors such as sex, race, ethnic groups, among others. Bone development and growth were
Carvalho14 who assessed skeletal maturation using the
method by Greulich and Pyle.13 The authors observed that
in non-syndromic females individuals aged between 13 and 14 years, as well as between 9 and 16 years old, respec-tively, an index of accelerated maturation was found.
As for male patients, Guzzi and Carvalho14 found
skeletal maturation retardation in non-syndromic
indi-viduals, which was also observed by Aguiar1 as well as
Sannomiya and Calles.26 who compared non-syndromic
patients with individuals with Down’s syndrome aged between 5 and 19 years old. Furthermore, it should be emphasized that the method proposed by Eklöf and
Ringertz7 was not considered reliable to assess skeletal
maturation in this population.
An individual’s chronological moment may be used to determine one’s bone age, provided that certain
param-eters be respected.12 Franchi, Baccetti and McNamara Jr10
observed a signiicant decrease between stages 4 and 53
af-ter the end of pubertal growth. They further highlighted that this is a reliable method in the assessment of skeletal
maturation. Canali, Brücker and Lima5 as well as
Gener-oso et al12 reported potential direct relationship between
chronological age and CVM; however, skeletal maturation in female patients occurs earlier (about 1 year).
The preference and choice regarding the different methods are based on the experience and technical training of each professional. In addition, the reliabil-ity of the method consists of its abilreliabil-ity to be com-pared, which is verified by intra-observer testing; as well as its reproducibility, observed by inter-observer assessment. In this study, the method proposed by
Martins and Sakima23 was used for hand and wrist
ra-diographs, based on centers of ossification, whereas
the methods of Hassel and Farman17 as well as
Bac-cetti, Franchi and McNamara Jr3 were used for lateral
cephalometric radiographs.
Radiographs were assessed and skeletal maturity stages were determined by a single observer, prop-erly calibrated. Initially, the error of the method was
observed at two diferent times (T1 and T2), based on
the analysis of new scores attributed to the hand and wrist radiographs and the lateral cephalometric radio-graphs, as shown in Tables 1 to 3. Table 1 shows agree-ment in bone assessagree-ment using the method by Hassel
and Farman,17 with Kappa index statistically signiicant
(p < 0.05), thus indicating excellent level of agreement
between measurements (Kappa > 0.75).
Excellent level of agreement was also observed for
the methods by Martins and Sakima23 as well as
Bac-cetti, Franchi and McNamara Jr3 of which values are
presented in Tables 2 and 3, respectively. Therefore, satisfactory calibration was obtained for the clas-siication criteria applied to the measures of each method. Intra-observer assessment revealed that the scores attributed to the methods by Martins and
Sa-kima23 as well as Hassel and Farman17 agreed in 30 out
of 36 subjects (83.3 %); whereas for Baccetti, Franch
and McNamara Jr3 there was an agreement of 32 out
of 36 subjects (88.8 %). This percentage diference in favor of the latter may be due to greater assimilation of the operator, perhaps because it is a method of classii-cation with fewer steps and, therefore, less subjective.
The results obtained from the lateral cephalo-metric radiographs analyzed by the method
pro-posed by Hassel and Farman,17 as reported by Santos
and Almeida,30 Canali, Brücker and Lima5 as well as
Santos et al,29 showed a positive and significant
cor-relation, thus indicating that the scores attributed to each one of them were similar.
Table 2 shows a positive and signiicant correlation
for the comparison between T1 and T2, which agrees
with the two observers used in the study by Baccetti,
Franchi and McNamara Jr.3 The error of the method
analysis proposed by Martins and Sakima23 was
per-formed by Iguma, Tavano and Carvalho20 who found a
high correlation when assessing the PGS. Their study also found excellent agreement as revealed by the Kap-pa index obtained for the sample studied.
Should, in fact, there be an association between the aforementioned methods and the hand and wrist as well as the cervical vertebrae, this means that it would be possible to choose one of them to assess pa-tient’s skeletal maturation for routine orthodontic re-cords. To elucidate a possible correlation between the methods proposed in this study, an agreement analysis of the inal results was conducted by comparing the methods two by two.
The data obtained showed that the level of
agree-ment between the methods by Hassel and Farman17
and Baccetti, Franchi and McNamara Jr3 (Table
4); Hassel and Farman17 and Martins and Sakima23
(Table 5); as well as Baccetti, Franchi and McNamara
Jr3 and Martins and Sakima23 (Table 6) were
between them. Table 4 reveals that scores were concor-dant in 33 out of 36 subjects (91.6 %). Tables 5 and 6 reveal that 23 out of 36 subjects (63.8 %) and 25 out of 36 (69.4 %) were concordant, respectively. Data pre-sented in Table 4 suggest that the lower the degree of subjectivity among the methods used, the higher the index of agreement, since both methods use inspection parameters based on the size and shape of the vertebrae.
The literature includes studies that report the use of agreement analysis between two diferent
methods. Gar-cia11 as well as Santos and Almeida30 employed
Fish-man’s8 methods for hand and wrist, whereas Hassel and
Farman17 used it for cervical vertebrae and noted
statisti-cally signiicant correlation between them. San Román
et al28 conirm the previous results; however, the authors
used the Grave and Brown method for hand and wrist. It is observed that there is a diference regarding the choice of which method to use to assess hand and wrist as well as cervical vertebrae. However, regardless of the method studied, the results were similar, thus suggest-ing a correlation between maturation of vertebral bones and hand and wrist.
Table 7 shows a statistically signiicant correlation that ranges from reasonable to good (0.40 < Kappa < 0.75) among the three methods proposed to assess skeletal mat-uration when they were compared all together. Out of the 36 subjects assessed, 22 (61.1 %) achieved the same score for all three methods of bone maturation, whereas 14 (38.9 %) were not in agreement and 12 difered in only one stage with a diference of 1 score (the subject was “A” for a particular assessment method and “B” for another). One individual got diferent scores for all methods, and despite agreeing with the methods by
Bac-cetti, Franchi and McNamara Jr3 as well as Hassel and
Farman,17 one subject obtained a diference of two scores
in relation to the method by Martins and Sakima.23
According to Hassel and Farman,17 the 12
non-coincident results that varied in only one contigu-ous score have no clinical relevance to invalidate the method; and, for this reason, these results should be considered acceptable. Many dubious cases may not
allow a stage to be determined with precision, especially if one considers that the radiograph may have been ob-tained in a phase of transition from one stage to another subsequent. Thus, the examiner can classify the indi-vidual both in the beginning of a certain stage or in the end of another. We also emphasize that if these 12 indi-viduals were considered acceptable, we would obtain an excellent Kappa agreement index.
One of the most important factors in assessing the stage of maturation by means of hand and wrist as well as lateral cephalometric radiographs was the presence of 19 ossiica-tion centers used to place the individual in the PGS curve by means of the method advocated by Martin and
Saki-ma,23 when compared to the methods by Baccetti,
Fran-chi and McNamara Jr3 (ive stages) as well as Hassel and
Farman17 (six stages). For this reason, the method by
Mar-tins and Sakima23 proves more subjective, given the
difer-ence in scores observed in 10 out of 12 non-concordant individuals for the three methods of the sample.
CONCLUSIONS
Based on the results of this study it is reasonable to conclude that:
» Adapting the methods developed by Martins and
Sakima23 to assess skeletal maturation by cervical
ver-tebrae in the curve of PGS is a practical and useful tool in determining the stage of growth and development of individuals.
» Stages of maturation assessed by cervical vertebrae
and ossiication centers observed in radiographs of the hand and wrist were considered reliable.
» The data obtained revealed an excellent level of
agreement between the methods by Hassel and Farman17
and Baccetti, Franchi and McNamara Jr,3 Hassel and
Farman17 and Martins and Sakima,23 as well as Baccetti,
Franchi and McNamara Jr3 and Martins and Sakima,23
all of which were statistically signiicant;
» A statistically signiicant correlation that ranged
1. Aguiar SMHCA. Desenvolvimento ósseo das crianças portadoras da síndrome de Down: estudo morfométrico, radiográfico de ossos do carpo e metacarpo [tese]. Araçatuba (SP): Universidade Estadual Paulista “Júlio de Mesquita Filho”; 1998.
2. Armond MC, Castilho JCM, Moraes LC. Estimativa do surto de crescimento puberal pela avaliação das vértebras cervicais em radiografias cefalométricas laterais. Ortodontia. 2001;34(1):51-60.
3. Baccetti T, Franchi L, McNamara Jr JA. An improved version of the cervical vertebral maturation (CVM) method for theaAssessment of mandibular growth. Angle Orthod. 2002;72(4):316-23.
4. Benda CE. Studies mongolism Arch. Neurol Psychr Ativ. 1939;41(1):83-97. 5. Canali L, Brücker MR, Lima EMS. Avaliação da maturação esquelética das vértebras cervicais através de telerradiografias de perfil. Rev Odonto Ciênc. 2003;18(40):127-37.
6. Deicke M, Pancherz H. Is radius-union an indicator for completed facial growth? Angle Orthod. 2005;75(3):295-9.
7. Eklöf O, Ringertz H. A method of assessment of skeletal maturity. Ann Radiol (Paris). 1967;10(3):330-6.
8. Fishman LS. Radiographic evaluation of skeletal maturation; a clinically oriented method based on hand wrist films. Angle Orthod. 1982;52(2):88-112. 9. Fishman LS. Maturational patterns and prediction during adolescence. Angle
Orthod. 1987;57(3):178-93.
10. Franchi L, Baccetti T, McNamara JA Jr. Mandibular growth as related to cervical vertebral maturation and body height. Am J Orthod Dentofacial Orthop. 2000;118(3):335-40
11. Garcia Fernandez NP. Valoración de la edad esquelética: estúdio comparativo entre maduracion de vértebras cevicales y mano [dissertação]. Monterrey: Universidad Autônoma de Nuevo Leon; 1996.
12. Generoso R, Tavano O, Ribeiro A, Parreira MLJ. Estudo da correlação entre a idade cronológica e a maturação das vértebras cervicais em pacientes em fase de crescimento puberal. Rev Dental Press Ortod Ortop Facial. 2003;8(4):19-36. 13. Greulich WW, Pyle SI. Radio¬graph atlas as skeletal develop¬ment of the hand and
wrist. 1st ed. Stanford: University Press; 1949.
14. Guzzi BSS, Carvalho LS. Estudo da maturação óssea em pacientes jovens de ambos os sexos através de radiografias de mão e punho. Ortodontia. 2000;33(3):49-58.
15. Haas JD, Hunt EE Jr, Buskirk ER. Sketeal development of non institutionalized children with low intelligence quotients. Am J Phys Anthropol. 1971;35(3):455-66.
REFERENCES
16. Hall B. Mongolism in newborns: a clinical and cytogenetic study. Acta Paediatr Suppl. 1964;154:Suppl 154:1-95.
17. Hassel B, Farman AG. Skeletal maturation evaluation using cervical vertebrae. Am J Orthod Dentofacial Orthop. 1995;107(1):58-66.
18. Hefke HW. Roentgenologic study of anomalies of the hands in on hundred cases of mongolism. Am J Dis Child. 1940;60:1913-24.
19. Horliana RF. Estudo da relação entre os estágios de maturidade; óssea avaliados em radiografias de mão e punho e das vértebras cervicais, em telerradiografias em norma lateral [dissertação]. São Paulo (SP): Universidade de São Paulo; 2004. 20. Iguma KE, Tavano O, Carvalho IMM. Analise comparativa dos estimadores do
surto de crescimento puberal: métodos de Martins e Sakima e Grave e Brown. J Appl Oral Sci. 2005;13(1):58-61.
21. Lamparski DG. Skeletal age assessment utilizing cervical vertebrae [dissertation]. Pittsburgh (PA): University of Pittsburgh; 1972.
22. Marcondes E. Idade óssea em pediatria. Pediatria. 1980;2:297-311.
23. Martins JCR, Sakima T. Considerações sobre a previsão do surto de crescimento puberal. Ortodontia. 1977;10(3):163-70.
24. Prates NS, Peters CF, Lopes E. Maturação óssea da mão e punho e crescimento da mandíbula. RGO: Rev Gaúch Ortod. 1988;36(5):56-9.
25. Rey SC, Fazzi R, Birman EG. Principais alterações craniofaciais em portadores de síndrome de Down. Rev Fac Odontol F Z L. 1991;3(1):59-64.
26. Sannomiya EK, Calles A. Avaliação da idade óssea em indivíduos portadores da síndrome de Down pelo índice de Eklöf e Ringertz, por meio de radiografias de mão e punho. RGO: Rev Gaúch Ortod. 2005;67(3):65-9.
27. Sannomiya EK, Medici Filho E, Castilho JCM, Graziosi MAOC. Avaliação da Idade óssea em indivíduos portadores da Síndrome de Down por meio de radiografias da mão e punho. Rev Odontol UNESP. 1998;27(2):527-36.
28. San Román P, Palma JC, Oteo MD, Nevado E. Skeletal maturation determined by cervical vertebrae development. Eur J Orthod. 2002;24(3):303-11.
29. Santos CAS, Bertoz FA, Arantes FM, Reis PMP. Avaliação da reprodutibilidade do método de determinação da maturação esquelética por meio das vértebras cervicais. Rev Dental Press Ortod Ortop Facial. 2005;10(2):62-8.