Impact of rapid maxillary expansion on nasomaxillary
complex volume in mouth-breathers
Mario Cappellette Jr.1, Fabio Eduardo Maiello Monteiro Alves1,
Lucia Hatsue Yamamoto Nagai1, Reginaldo Raimundo Fujita1, Shirley Shizue Nagata Pignatari1
Objective: To assess the volumetric changes that occur in the nasomaxillary complex of mouth-breathing patients with transverse maxillary deficiency subjected to rapid maxillary expansion (RME). Methods: This was a controlled, prospec-tive intervention study involving 38 mouth-breathing patients presenting with transverse maxillary deficiency, regard-less of malocclusion type or race. Twenty-three of them comprised the experimental group, which was composed of 11 (47.8%) boys, and 12 (52.2%) girls, with a mean age of 9.6 years, ranging from 6.4 to 14.2 years and standard deviation of 2.3 years; and 15 of them comprised the control group, composed of 9 (60%) boys and 6 (40%) girls with an mean age of 10.5 years, ranging from 8.0 to 13.6 years, and standard deviation of 1.9 years. All patients were scanned (CT) according to a standard protocol: Initial CT (T1), and CT three months thereafter (T2), and the patients in the experimental group were treated with RME using a Hyrax expander for the correction of maxillary deficiency during the T1-T2 interval. The CT scans were manipulated using Dolphin® Imaging version 11.7 software for total and partial volumetric assess-ment of the nasomaxillary complex. Results: The results revealed that in the experiassess-mental group there was a significant increase in the size of the structures of interest compared to the control group, both in general aspect and in specific regions. Conclusions: Rapid maxillary expansion (RME) provided a significant expansion in all the structures of the nasomaxillary complex (nasal cavity, oropharynx, right and left maxillary sinuses).
Keywords:Maxillary deficiency. Maxillary expansion. Computed tomography. Nasal cavity.
1 Universidade Federal de São Paulo (UNIFESP/EPM), Department of
Otorhinolaryngology and Head and Neck Surgery, São Paulo, Brazil.
Submitted: July 30, 2016 - Revised and accepted: January 30, 2017
» The authors report no commercial, proprietary or financial interest in the products or companies described in this article.
DOI: https://doi.org/10.1590/2177-6709.22.3.079-088.oar
How to cite this article: Cappellette Jr. M, Alves FEMM, Nagai LHY, Fu-jita RR, Pignatari SSN. Impact of rapid maxillary expansion on nasomaxillary complex volume in mouth-breathers. Dental Press J Orthod. 2017 May-Ju-ne;22(3):79-88. DOI: https://doi.org/10.1590/2177-6709.22.3.079-088.oar
Contact address: Mario Cappellette Jr.
Rua Salete 200, conj. 101/102 – São Paulo/SP, Brasil – CEP: 02.016-001 E-mail: [email protected]
Objetivo: avaliar as alterações volumétricas do complexo nasomaxilar em pacientes respiradores bucais com deficiência trans-versal da maxila tratados com expansão rápida da maxila (ERM). Métodos: foram selecionados 38 pacientes respiradores bucais, independentemente da má oclusão ou raça, portadores de constrição maxilar, e realizou-se um estudo de intervenção, prospectivo, controlado. Para o grupo experimental, foram selecionados 23 pacientes, sendo 11 (47,8%) meninos e 12 (52,2%) meninas, com média de idade de 9,6 anos (variando de 6,4 a 14,2 anos) e desvio-padrão de 2,3 anos; e 15 pacientes para o grupo controle, sendo 9 (60%) meninos e 6 (40%) meninas, com média de idade de 10,5 anos (variando de 8,0 a 13,6 anos) e desvio-padrão de 1,9 anos. Todos os pacientes realizaram exames de tomografia computadorizada (TC), de acordo com protocolo padronizado: TC inicial (T1) e TC após três meses do período de contenção (T2). Os pacientes do grupo experimental foram tratados com expansão rápida da maxila usando um expansor Hyrax para a correção da deficiência transversal durante o intervalo T1-T2. As imagens tomográ-ficas para avaliação volumétrica total e parcial do complexo nasomaxilar foram manipuladas no programa Dolphin® versão 11.7. Resultados: os resultados revelaram que no grupo experimental houve um aumento significativo no tamanho das estruturas de interesse em comparação com o grupo controle, tanto no geral quanto nas regiões específicas. Conclusões: a expansão rápida da maxila (ERM) promoveu uma expansão significativa de todas as estruturas do complexo nasomaxilar (cavidade nasal, orofaringe, seios maxilares direito e esquerdo).
INTRODUCTION
Transverse maxillary deiciency associated with re-spiratory problems is a condition frequently observed in otorhinolaryngology (ENT) and orthodontic practice. This type of malocclusion warrants special attention by orthodontists, otolaryngologists and allergists since its causes and symptoms are clearly related to these three specialties. Besides, the transverse maxillary deicien-cy can be treated by means of rapid maxillary expan-sion (RME), thus improving the nasal airlow and the
breathing pattern.1
In 1860, Angell irst described a method, known as maxillary expansion, for treating patients with general-ized lack of space in the maxillary arch, and transverse maxillary deiciency. Eysel was the irst rhinologist to study the efects of maxillary expansion on nasal cavity dimensions in the year 1886, and noted that in the pe-riod following maxillary expansion several changes oc-curred in the maxilla such as increased nasal width near
the midpalatal suture.1,2
Later, other studies showed that histological repair of the connective tissue occurs in the midpalatal suture dur-ing and ater the active expansion phase, as well as changes in the anatomy of the septum and nasal cavity, triangular opening of the midpalatal suture, with the apex facing the
nasal cavity, and improved nasal breathing.3-7
Since then, numerous articles in the scientiic lit-erature have reported the beneits of rapid maxillary expansion for the nasal cavity, also conirmed in ear, nose and throat (ENT) practice. These studies used posteroanterior radiography (PA), thus complement-ing the evaluation of transverse alterations, as well as cephalometrics, acoustic rhinometry, and computed tomography — with or without the concurrent use
of imaging sotware5-16 —, demonstrating signiicant
increase in the cross-sectional dimensions of the nasal cavity, volumetric increase and reduction in nasal resis-tance. The enlargement of nasal cavity with an increase of nasal volume could diminish the resistance of nasal airlow and improve a nasal breathing. However, these efects depend on the existence or not of nasal obstruc-tion and on its locaobstruc-tion and severity. Patients with nasal obstructions such as turbinate hypertrophy or septum deviations were excluded from the study.
Several methods and imaging sotware have been used to conirm the expansion of the nasomaxillary
complex and its adjacent structures ater RME.16,17
Imaging sotware programs have been extremely useful in helping to assess the beneits of RME. They have also proven vital for structural comparisons be-tween pre and post-clinical treatment, and to evaluate the morphological changes caused by the treatment, since they improve the visualization of anatomical structures by rendering unnecessary the superimposi-tion of convensuperimposi-tional radiographs. Furthermore, these programs enhance the accuracy of research indings, besides improving the efectiveness of any techniques applied, while facilitating the use of computer tools for 3D image manipulation, either by itself or associated
with other sotware.6
The purpose of this study was to investigate the im-pact of rapid maxillary expansion (RME) on the volume of the nasomaxillary complex, using computed tomography (CT) associated with an image manipulation sotware.
MATERIAL AND METHODS
This was a controlled, prospective intervention study involving 38 mouth-breathing patients presenting with transverse maxillary deiciency, regardless of malocclu-sion type or race. The experimental group consisted of 23 patients (11 female and 12 male) with a mean age of 9.6 years ranging from 6.4 to 14.2 years. Fiteen pa-tients were selected for the control group (9 male and 6 female), with a mean age of 10.5, ranging from 8.0 to 13.6 years. All patients were in mixed or permanent dentition, with a diagnosis of mouth-breathing and maxillary deiciency.
Syndromic patients or patients with craniofacial ab-normalities such as Pierre-Robin and Treacher-Collins, among others, potential candidates for adenoidectomy or adenotonsillectomy, septum deviation, complete obstruction of the nasal cavity by nasal turbinates, ana-tomic alterations of the nasal septum, intranasal tumors or polyps, adenoid occupying more than 70% of the choanas, purulent secretions in the middle nasal me-atus or in the loor of the nose, and patients with dental or periodontal changes were excluded from the study. This study was approved by the Committee for Ethics in Institutional Research of the Federal University of São Paulo (registered under #164761).
All CT scans were performed in the Department of Diagnostic Imaging of the institution, using a multislice
device (Philips® Brilliance CT scanner 64 channels).
All tests conirmed the presence of maxillary dei-ciency, and all patients were subjected to the same
to-mographic evaluation protocol, T1 (CT1), at baseline,
and T2 (CT2), about 3 months ater the irst CT scan.
The patients of experimental group treatment were treated following the same protocol: Hyrax expander was attached to the maxillary second primary molars and extended forward to the palatal surfaces of the primary canines (2-banded) or supported by bilateral maxillary irst premolars and irst molars (4-banded). Ater insertion, the six initial activations of the appli-ance were applied by the orthodontist. Subsequent
ac-tivations were performed by the legal guardians, who were instructed to make two daily activations, with no interval between them. This procedure went on un-til RME was achieved, within a period ranging from 15 to 20 days. Ater this period the appliance was kept in place for nearly 3 months, and removed ater bone formation was observed through occlusal radiographs. In this phase, parents/legal guardians answered the same quality-of-life questionnaire. Thereater, patients were immediately subjected to a new CT scan (CT2).
Volumetric measurements and comparisons between images of both groups, CT1 and CT2, were carried out
with the aid of Dolphin® Imaging v. 11.7 sotware, using
the “Airway Volume” tool, and density was set at 65 for all patients. Volumetric measurements and comparisons between images of both groups were carried out using the “Airway Volume” tool, which works illing the structures according to theirs density or Hounsield units (0-100).
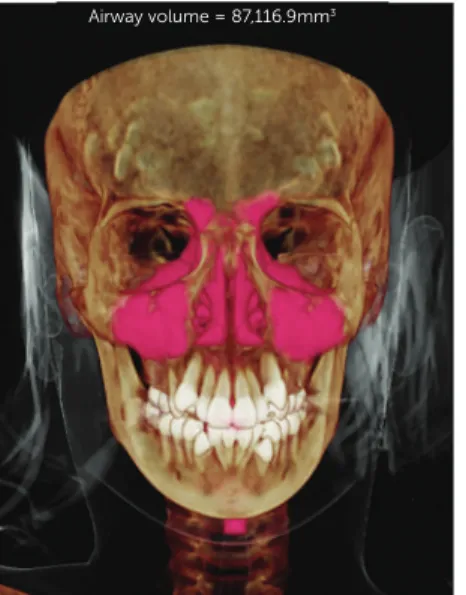
The images were evaluated in three views (sagit-tal, coronal and axial), thus delimiting the nasomaxil-lary complex, and then calculating the volume in cubic millimeters. The results were statistically analyzed and compared as shown in Figures 1 and 2.
The total of 38 patients as a sample size was con-sidered statistically appropriate. The Table 2 shows the volumetric evaluation of the nasomaxillary complex at
T1 and T2. Normality of distribution of increases in
to-tal volume, nasal volume, oropharynx and right and let
Figure 1 - Total initial volume. Figure 2 - Total final volume.
control (n=15) experimental (n=23) Total (n=38) P
Sex
male 9 60.0% 11 47.8% 20 52.60%
0.463a
female 6 40.0% 12 52.2% 18 47.40%
Total 15 100.0% 23 100.0% 38 100.00%
Age (years)
Mean 10.5 9.6 10.0
0.204b
median 10 9.5 9.8
minimum 8 6.4 6.4
maximum 13.6 14.2 14.2
standard deviation 1.9 2.3 2.2
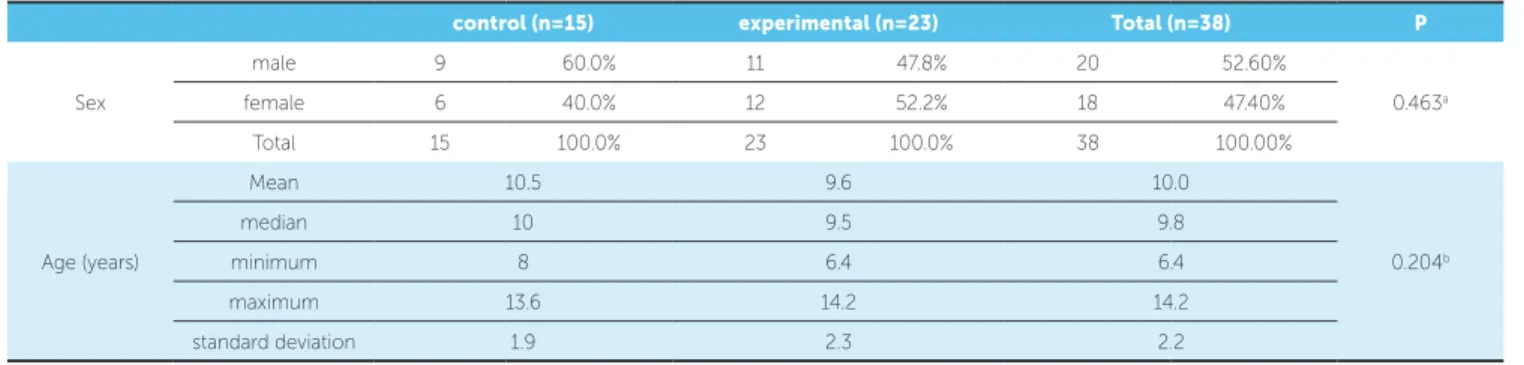
Table 1 - Distribution of sex and age of children in the control and experimental groups.
a Pearson’s Chi-square, b Student’s t-test for independent samples.
maxillary sinuses was assessed with the Shapiro-Wilk test (Table 3). Tables 4 and 5 show the statistical power of the sample in all comparison of interest.
To estimate evaluator reliability and reproduc-ibility, 10 randomly selected records were reevalu-ated after a month of preliminary data collection. All parameters were measured by the same evaluator. Normality was assessed with the Shapiro-Wilk test
(p > 0.05). After that, paired sample t-tests were used
to investigate the difference of both measurements and intraclass correlation coefficient (ICC) was used to test the intra-rater reliability.
The statistical treatment of the data was performed with the Statistical Package for the Social Sciences (SPSS), version 22 for Windows (Table 6).
NORMALITY OF DATA
Considering a signiicance level of 5%, there were no signiicant deviations from the normality of the data
(p > 0.05), both in T1 and T2. For this reason, parametric
tests were used to analyze the error and reliability of the
measurements: Student’s t-test for paired samples and
Intraclass Correlation Coeicient (ICC).
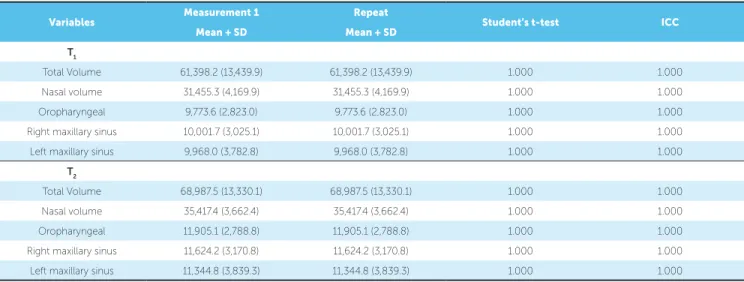
The results presented in Table 7 show a total cor-respondence between the initial measurements and the repetitions by the same evaluator (Intraclass
cor-relation) in both T1 and T2. In fact, the means of the
initial measurements and the repetitions were equal
(p = 1,000) and the ICC equals 1,000 in all variables,
indicating the absence of measurement error, and reli-ability and reproducibility.
Reliability and reproducibility results showed no error for volume variable, which can be attributed to analysis by speciic tool of the sotware using a grey scale and automatic volume determination (Table 7).
STATISTICAL ANALYSIS
Statistical analysis of all data collected in this research was initially performed descriptively using mean, medi-an, minimum and maximum values, standard deviation, absolute and relative frequencies (percentage), in addi-tion to individual proile graphs (line graph) and one-dimensional dispersion graphs. The inferential analysis employed in order to conirm or refute evidence found in the descriptive analysis comprised:
» Pearson’s Chi-square test,28 to compare the control
and experimental groups with respect to gender.
» Student’s t-test for independent samples,21 to
com-pare the control and experimental groups with respect
to age (years), oropharyngeal expansion (mm3), and
right maxillary sinus (mm3).
» Mann-Whitney test,22 to compare the control and
experimental groups with respect to increases in total
volume (mm3), nasal volume (mm3), and let maxillary
sinus (mm3).
» Shapiro-Wilk test, 29 to evaluate normality in the
distribution of increases in total volume (mm3), nasal
volume (mm3), oropharynx (mm3), right (mm3) and
left (mm3) maxillary sinuses, in the control vs.
experi-mental groups.
Table 2 - Summary-measurements (mm3) of total (TV) and nasal (NV) volumes, oropharynx (Oro); right (RMS) and left (LMS) maxillary sinuses, of children in
the control and experimental groups
control (n=15) experimental (n=23)
mean median minimum maximum SD mean median minimum maximum SD
TV (T1) 55,567.8 52,378.3 47,554.4 68,785.7 8,104.9 59,823.4 59,667.3 42,222.6 87,116.9 11,502.8
TV (T2) 55,757.2 52,878.6 47,575.3 68,889.6 8,239.5 69,322.4 67,821.3 51,513.7 98,139.8 11,867.5
TV increase* 189.4 500.3 20.9 103.9 134.6 9,499 8,154 9,291.1 11,022.9 364.7
NV (T1) 34,426 33,108.3 29,207.4 43,479.4 5,059 33,418.7 31,587.2 25,985.2 50,792.1 6,107.6
NV (T2) 34,488.7 33,200.4 29,214.9 43,487.3 5,088.9 38,450.6 37,853.7 30,271.9 58,035.6 6,329.1
NV increase* 62.7 92.1 7.5 7.9 29.9 5,031.9 6,266.5 4,286.7 7,243.5 221.5
Oro (T1) 7,531 7,215.9 5,682.9 10,784.7 1,535 10,262.3 9,748.1 6,760.5 14,449.6 2,421.1
Oro (T2) 7,572.4 7,300.7 5,693 10,802.2 1,526.4 12,955.1 13,584.1 8,295 18,345.6 2,942.8
Oro increase* 41.4 84.8 10.1 17.5 -8.6 2,692.8 3,836 1,534.5 3,896 521.7
RMS (T1) 8,795.9 8,149.1 7,105.7 11,268.3 1,594.2 9,161.9 8,813.9 3,068.3 16,942.4 2,836.7
RMS (T2) 8,831.4 8,149.3 7,162.7 11,273.3 1,582.6 11,343.2 11,668.8 5,746.2 17,968.4 2,807.7
RMS increase* 35.5 0.2 57 5 -11.6 2,181.3 2,854.9 2,677.9 1,026 -29
LMS (T1) 8,763.8 8,456.1 6,226 11,105 1,580.4 8,999.8 8,260.7 4,392.8 17,689.7 3,046.1
LMS (T2) 8,799.8 8,487 6,228.2 11,187.1 1,603.3 11,371.2 11,505.4 4,823.9 19,639.5 3,140.4
LMS increase* 36 30.9 2.2 82.1 22.9 2,371.4 3,244.7 431.1 1,949.8 94.3
Table 3 - Results of normality tests to measure increases in total volume, nasal volume, oropharynx, and right and left maxillary sinuses with the aim of deter-mining the appropriate statistical test to compare the groups.
control Experimental
total volume increase <0.001 0.173
nasal volume increase <0.001 0.234
oropharyngeal increase 0.092 0.340
right maxillary sinus increase 0.093 0.385
left maxillary sinus increase 0.035 0.364
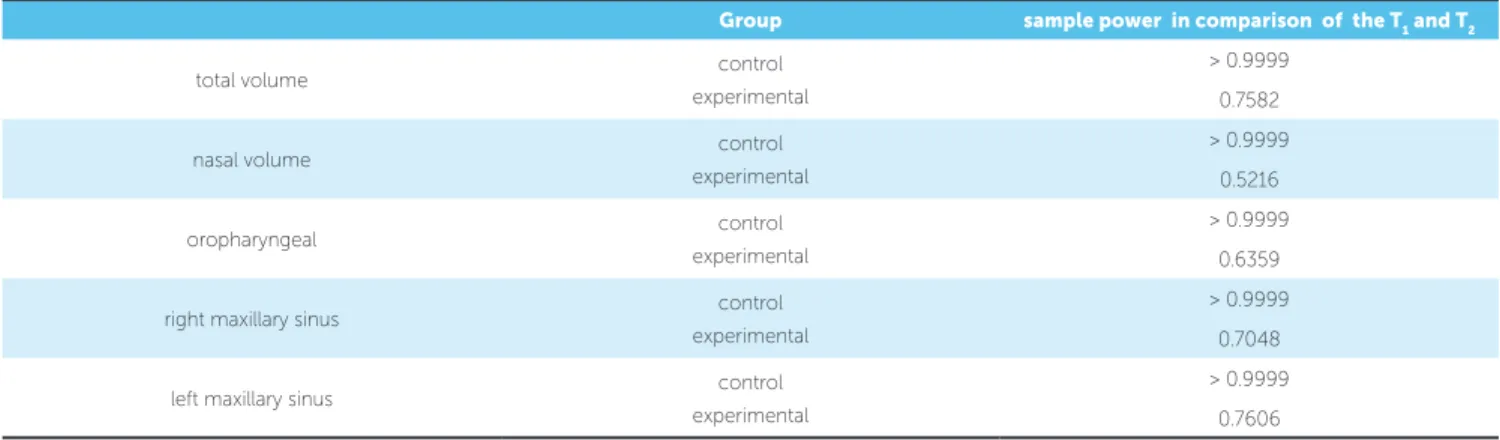
Table 4 - Estimates of the sample power in comparison of the T1 and T2.
Group sample power in comparison of the T1 and T2
total volume control
experimental
> 0.9999
0.7582
nasal volume control
experimental
> 0.9999
0.5216
oropharyngeal control
experimental
> 0.9999
0.6359
right maxillary sinus control
experimental
> 0.9999
0.7048
left maxillary sinus control
experimental
> 0.9999
0.7606
Table 5 - Estimates of the sample power in comparison of the increases between experimental group and control group.
Statistical power in comparison of the groups experimental and control
total volume > 0.9999
nasal volume 0.9957
oropharyngeal 0.9024
right maxillary sinus 0.998
According to the power of the sample as shown in the Table 4, the sample was considered suicient to
ver-ify the statistical diferences between T1 and T2 both for
experimental group and control group.
The comparisons of the increment between ex-perimental group and control group showed signiicant sample power (Table 5).
RESULTS
Demographic data of the selected sample are shown in Table 1. The inferential results (Table 2) confirmed that both the control and experimental groups showed the same profile with respect to
gen-der (p = 0.463), and age (p = 0.204).
The volumetric evaluation of the nasomaxillary
complex of 38 children at T1 and T2 can be seen
in Table 2, and Figures 1 and 2. The black lines in Figures 3 to 7 represent the time evolution of each
child. The red lines in those graphs represent the mean and standard error.
At T1, the control group exhibited a mean
to-tal volume of 55,567.8 mm3, ranging from 47,554.4 to
68,785.7 mm3, with a standard deviation of 8,104.9 mm3.
The mean nasal volume was 34,426.0 mm3, ranging from
29,207.4 to 43,479.4 mm3, with a standard deviation of
5,059.0 mm3. Oropharynx mean was 7,531.0 mm3,
rang-ing from 5,682.9 to 10,784.7 mm3, with a standard
de-viation of 1,535.0 mm3. The mean right maxillary sinus
was 8,795.9 mm3, ranging from 7,105.7 to 11,268.3 mm3,
with a standard deviation of 1,594.2 mm3. The mean let
maxillary sinus was 8,795.9 mm3, ranging from 6,226.0 to
11,105.0 mm3, with a standard deviation of 1,580.4 mm3.
At T2, the control group showed a mean total
volume of 55,757.2 mm3, ranging from 47,575.3
to 68,889.6 mm3, with a standard deviation of
8,239.5 mm3.
Table 6 - Normality of data: p-values of the Shapiro-Wilk test (n = 10).
Table 7 - Error analysis: mean and standard deviation, Student’s t-test for paired samples and ICC (n=10).
Variables T1 T2
Measurement 1 Repeat Measurement 1 Repeat
Total volume 0.334 0.334 0.488 0.488
Nasal volume 0.312 0.312 0.448 0.448
Oropharyngeal 0.163 0.163 0.180 0.180
Right maxillary sinus 0.218 0.218 0.768 0.768
Left maxillary sinus 0.513 0.513 0.642 0.642
Variables Measurement 1 Repeat Student’s t-test ICC
Mean + SD Mean + SD
T1
Total Volume 61,398.2 (13,439.9) 61,398.2 (13,439.9) 1.000 1.000
Nasal volume 31,455.3 (4,169.9) 31,455.3 (4,169.9) 1.000 1.000
Oropharyngeal 9,773.6 (2,823.0) 9,773.6 (2,823.0) 1.000 1.000
Right maxillary sinus 10,001.7 (3,025.1) 10,001.7 (3,025.1) 1.000 1.000
Left maxillary sinus 9,968.0 (3,782.8) 9,968.0 (3,782.8) 1.000 1.000
T
2
Total Volume 68,987.5 (13,330.1) 68,987.5 (13,330.1) 1.000 1.000
Nasal volume 35,417.4 (3,662.4) 35,417.4 (3,662.4) 1.000 1.000
Oropharyngeal 11,905.1 (2,788.8) 11,905.1 (2,788.8) 1.000 1.000
Right maxillary sinus 11,624.2 (3,170.8) 11,624.2 (3,170.8) 1.000 1.000
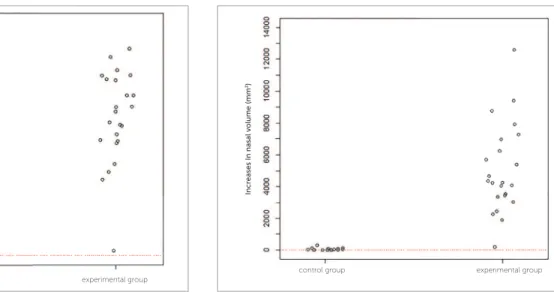
Figure 3 - One-dimensional dispersion diagram of increases in total
vol-ume (mm3) of children in the control and experimental groups.
Figure 4 - One-dimensional dispersion diagram of increases in nasal
vol-ume (mm3) of children in the control and experimental groups.
The mean nasal volume was 34,488.7 mm3,
rang-ing from 29,214.9 to 43,487.3 mm3, with a standard
deviation of 5,088.9 mm3. The mean oropharynx was
7,572.4 mm3, ranging from 5,693.0 to 10,802.2 mm3,
with a standard deviation of 1,526.4 mm3. The mean
right maxillary sinus was 8,831.4 mm3, ranging from
7,162.7 to 11,273.3 mm3, with a standard deviation of
1,582.6 mm3. On the let maxillary sinus, the mean was
8,799.8 mm3, ranging from 6,228.2 to 11,187.1 mm3,
with a standard deviation of 1,603.3 mm3.
At T1, experimental group had a mean total
vol-ume of 59,823.4 mm3, ranging between 42,222.6
and 87,116.9 mm3 (SD = 11,502.8 mm3). The mean
nasal volume was 33,418.7 mm3, ranging from
25,985.2 to 50,792.1 mm3, with a standard
de-viation of 6,107.6 mm3. The mean oropharynx was
10,262.3 mm3, ranging from 6,760.5 to 14,449.6 mm3,
with a standard deviation of 2,421.1 mm3. The mean
right maxillary sinus was 9,161.9 mm3, ranging from
3,068.3 to 16,942.4 mm3, with a standard deviation of
2,836.7 mm3. The let maxillary sinus had a mean of
8,999.8 mm3, ranging from 4,392.8 to 17,689.7 mm3,
with a standard deviation of 3,046.1 mm3.
At T2, the experimental group had a mean
total volume of 69,322.4 mm3, ranging from
51,513.7 to 98,139.8 mm3, with a standard
de-viation of 11,867.5 mm3. The mean nasal
vol-ume was 38,450.6 mm3, ranging from 30,271.9
to 58,035.6 mm3, with a standard deviation
of 6,329.1 mm3. The mean oropharynx was
12,955.1 mm3, ranging from 8,295.0 to 18,345.6 mm3,
with a standard deviation of 2,942.8 mm3. The right
maxillary sinus was 11,343.2 mm3, ranging from
5,746.2 to 17,968.4 mm3, with a standard deviation
of 2,807.7 mm3. The mean left maxillary sinus was
11,371.2 mm3, ranging from 4,823.9 to 19,639.5 mm3,
with a standard deviation of 3,140.4 mm3.
In Figures 1 and 2, example of a treated patient, comparing pre- and post-treatment total volumes. As depicted in these Figures, all children experienced increases in total volume. It is noteworthy however that these increases were more signii cant in the experimen-tal group than in the control group.
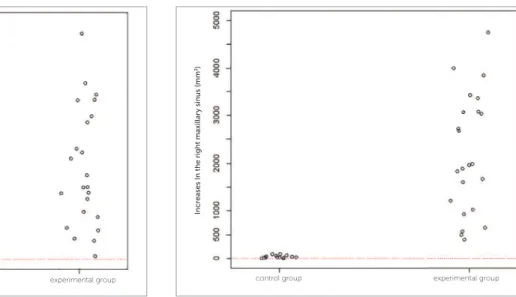
The inferential results (Figs 3 to 7) confirmed the evidence obtained in the descriptive analyses,
mean-ing that the increases in total volume (p < 0.001), nasal
volume (p < 0.001), oropharynx (p < 0.001), and right
(p < 0.001) and left (p < 0.001) maxillary sinuses in the
experimental group were more statistically significant than in the control group.
control group
control group experimental group
experimental group
Incr
eases In total volume (mm
3)
Incr
eases In nasal volume (mm
DISCUSSION
Transverse maxillary dei ciency associated with re-spiratory problems has been widely discussed by ortho-dontists and otolaryngologists, given the relationship between causes, ef ects and treatment. Today, rapid maxillary expansion is regarded as an important method to correct maxillary dei ciency. Since it was i rst intro-duced in 1860 in the United States, Angell’s technique has been validated by many other authors as it makes possible the splitting of the midpalatal suture while pro-ducing certain changes in the nasal cavity, which
im-prove breathing.1,3-8,11,14,17
Regarding diagnosis and treatment planning most scientii c studies which analyzed the ef ectiveness of the rapid maxillary expansion therapy used posteroanterior (PA) radiographs as an evaluation method. Radiographs enable an analysis of the transverse dimensions of the face by providing a broader view for the diagnosis of crossbites and orthopedic changes, i.e., this is a tech-nique that provides reliability when comparing skeletal
cephalometric points to dental cephalometric points.10
Unfortunately, the superimposition of radiographs of the anatomical structures can compromise the accuracy with which these points are marked.
With the development of imaging tests in the 1970s, computed tomography (CT) has been increasingly used to ensure reliable images, and has by now garnered a reputation as a new parameter for many health care ar-eas since craniometrics points can be found with greater precision, unlike posteroanterior radiographs, which can
be distorted. CT has rendered research results more ac-curate besides improving techniques such as the use of
computer tools for 3D image manipulation.8,17
Increases in nasal width and height were observed by posteroanterior radiographs and/or CT at dif erent stages of RME by several authors, who corroborated the re-sults achieved in this study. According to the literature, changes in nasal volume between pre and post-RME assessed by computed tomography have been observed by several authors. This was also among the goals of this
study, which were coni rmed by the results.1,3,5-8,10,11,16,17,20
Figure 5 - One-dimensional dispersion diagram of increases in the orophar-ynx (mm3) of children in the control and experimental groups.
Figure 6 - One-dimensional dispersion diagram of increases in the right max-illary sinus (mm3) of children in the control and experimental groups.
Figure 7 - One-dimensional dispersion diagram of increases in the left maxil-lary sinus (mm3) of children in the control and experimental groups.
Incr
eases In the right maxillar
y sinus (mm
3)
Incr
eases In the left maxillar
y sinus (mm
3)
Incr
eases In the or
ophar
ynx (mm
3)
control group experimental group control group experimental group
No doubt that an improved breathing pattern is an important clinical achievement, as observed in this study immediately following RME, and as reported by patients and legal guardians alike, although this was not the aim of this study. As disclosed is published studies, our patients also showed an increase in nasal cavity vol-ume ater RME, with this outcome being conirmed by an image manipulation program with 3D images,
and by quantiication of the measured areas.3,6-8,11,17
The same results were observed in all measures of the
nasomaxillary complex,8,16,17 despite diferences in the
maxillary expansion protocols of the various studies. Some studies have failed to show gains in some nasomaxillary complex structures, particularly in the
volume of the maxillary sinuses18 and nasal cavity.19
However, increases in oropharyngeal volume have
been reported.20
The RME produced signiicant width increases in the maxilla and nasal cavity which are important for stability of the treatment improving respiratory function and
cra-niofacial development. De Felippe et al,23 by means of 3D
morphometric analysis and of acoustic rhinometry evalu-ation, found an increase in the area of the nasal cavity, concomitant with a reduction in nasal airway resistance immediately ater RME. These authors also observed sta-bility of the results in a long-term follow-up (60 months ater RME), with values comparable to those of subjects with normal nasal breathing conditions.
The breathing stage of the patients is diicult to control which has inluence on the airway size. There-by, patients with any obstruction of the nasal cavity or anatomic alterations of the nasal septum were excluded from the study. The examination of the upper airway plays an important role in the evaluation of the growth and general health of subjects with breathing
disor-ders.24,25 Despite reduction in resistance ater RME,
only a few attempts have been made to investigate whether such changes are capable of causing signii-cant improvements on respiration, physical activities
and quality of life of mouth-breathers.26
The analysis of results of the questionnaire obtained ater RME suggests that the severity of the respiratory
symptoms reduced ater RME. Iwasaki et al.27 related
that the changes ater RME, as measured by objective tests of nasal airway patency such as rhinomanometry and acoustic rhinometry, show improved conditions for nasal breathing up to 11 months ater RME.
According to the results of this study showing in-creased intranasal capacity and considering other
stud-ies7,10 reporting the impact of RME on the quality of the
life of mouth-breathers with improvement of the breath-ing pattern, the RME may favor the nasal function, which is an important factor in these growing patients.
CONCLUSIONS
The results showed that rapid maxillary expansion (RME) induces a volumetric expansion in the nasomax-illary complex as well as in all its structures, the nasal cavity, oropharynx and maxillary sinuses, individually.
Authors’ contribution
1. Haas AJ. Rapid expansion of the maxillary dental arch and nasal cavity by opening the midpalatal suture. Angle Orthod. 1961;31(2):73-90.
2. Angell EH. Treatment of irregularity of the permanent or adult teeth. Part I. Dent Cosmos. 1860;1(10):540-4.
3. Haas AJ. The treatment of maxillary deiciency by opening the midpalatal suture. Angle Orthod. 1965 July;35:200-17.
4. Melsen B. A histologic study of the inluence of sutural morphology and skeletal maturation on rapid palatal expansion in children. Trans Eur Orthod Soc. 1972;48:499-507.
5. Capelozza Filho L, Silva Filho OG. Expansão rápida da maxila: considerações gerais e aplicação clínica. Parte I. Rev Dental Press Ortod Ortop Maxilar. 1997 Maio-Jun;2(3):88-102.
6. Cappellette M Jr. Avaliação de volume nasal pré e pós-disjunção maxilar ortopédica [tese]. Bauru (SP): Universidade Federal de São Paulo; 2005. 7. Cappellette M Jr, Cruz OL, Carlini D, Weckx LL, Pignatari SS. Evaluation of nasal capacity before and after rapid maxillary expansion. Am J Rhinol. 2008 Jan-Feb;22(1):74-7.
8. Cappellette M Jr, Alves FEMM, Gomes FSC. Avaliação volumétrica da disjunção maxilar ortopédica pó meio de TC associada ao programa Dolphin. Ortodontia SPO. 2012;45(4):413-20.
9. Biederman W. A hygienic appliance for rapid expansion. JPO J Pract Orthod. 1968 Feb;2(2):67-70.
10. Ricketts RM. Cephalometric synthesis. Am J Orthod. 1960 Sept;46(9):647-73.
11. Wertz RA. Changes in nasal airlow incident to rapid maxillary expansion. Angle Orthod. 1968 Jan;38(1):1-11.
12. Moss JP. Rapid expansion of the maxillary arch. Part I. J Pract Orthod. 1968;2:165-71.
13. Moss JP. Rapid expansion of the maxillary arch. Part II. J Pract Orthod. 1968;2(5):215-23.
14. Muniz RFL, Cappellette Jr M, Carlini D. Alterações no volume nasal em pacientes submetidos a disjunção maxilar. Rev Dental Press Ortod Ortop Facial. 2008;13(1):54-9.
15. Palaisa J, Ngan P, Martin C, Razmus T. Use of conventional tomography to evaluate changes in the nasal cavity with rapid palatal expansion. Am J Orthod Dentofacial Orthop. 2007 Oct;132(4):458-66.
16. Cappellette M Jr, Gomes FS, Alves FE. Avaliação do volume do complexo nasomaxilar pré e pós disjunção maxilar: relato de caso. Ortho Sci Orthod Sci Pract. 2012;5(20):579-83.
REFERENCES
17. Yilmaz BS, Kucukkeles N. Skeletal, soft tissue, and airway changes following the alternate maxillary expansions and constrictions protocol. Angle Orthod. 2014 Sept;84(5):868-77.
18. Darsey DM, English JD, Kau CH, Ellis RK, Akyalcin S. Does hyrax expansion therapy afect maxillary sinus volume? A cone-beam computed tomography report. Imaging Sci Dent. 2012 June;42(2):83-8.
19. Darsey DM, English JD, Kau CH, Ellis RK, Akyalcin S. Does hyrax expansion therapy afect maxillary sinus volume? A cone-beam computed tomography report. Imaging Sci Dent. 2012 June;42(2):83-8.
20. Smith T, Ghoneima A, Stewart K, Liu S, Eckert G, Halum S, Kula K. Three-dimensional computed tomography analysis of airway volume changes after rapid maxillary expansion. Am J Orthod Dentofacial Orthop. 2012 May;141(5):618-26.
21. Bussab WO, Morettin PA. Estatística básica. 5a ed. São Paulo: Saraiva; 2006. 22. Siegel S. Estatística não-paramétrica para ciências do comportamento.
2ª ed. Porto Alegre: Artmed; 2006.
23. De Felippe NLO, Silveira AC, Viana G, Kusnoto B, Smith B, Evans CA. Relationship between rapid maxillary expansion and nasal cavity size and airway resistance: short- and long-term efects. Am J Orthod Dentofacial Orthop. 2008 Sept;134(3):370-82.
24. Eichenberger M, Baumgartner S. The impact of rapid palatal expansion on children’s general health: a literature review. Eur J Paediatr Dent. 2014 Mar;15(1):67-71.
25. Ghoneima A, AlBarakati S, Jiang F, Kula K, Wasfy T. Computational luid dynamics analysis of the upper airway after rapid maxillary expansion: a case report. Prog Orthod. 2015;16:10.
26. Izuka EN, Feres MFN, Pignatari SSN. Immediate impact of rapid maxillary expansion on upper airway dimensions and on the quality of life of mouth breathers. Dental Press J Orthod. 2015 May-June;20(3):43-9.
27. Iwasaki T, Saitoh I, Takemoto Y, Inada E, Kakuno E, Kanomi R, et al. Tongue posture improvement and pharyngeal airway enlargement as secondary efects of rapid maxillary expansion: a cone-beam computed tomography study. Am J Orthod Dentofacial Orthop. 2013 Feb;143(2):235-45. 28. Agresti A. Categorical Data Analysis. New York: John Wiley; 1990. 29. Shapiro SS, Wilk MB. Approximations for the null distribution of