Body Composition, Biochemical and Clinical Changes of Adolescents
with Excessive Adiposity
Hiara Miguel Stanciola Serrano, Gisele Queiroz Carvalho, Patrícia Feliciano Pereira, Maria do Carmo Gouveia
Peluzio, Sylvia do Carmo Castro Franceschini, Silvia Eloiza Priore
Universidade Federal de Viçosa, Viçosa, MG - Brazil
Mailing address: Hiara Miguel Stanciola Serrano • Rua 144, nº 936 - Eldorado - 35181-212 - Timóteo, MG - Brazil E-mail: [email protected]
Manuscript received July 08, 2009; revised mansucript received Februzry 23, 2010; accepted April 12, 2010.
Abstract
Background: Adolescents with excess body fat and eutrophic had the same metabolic changes expected in obese individuals.
Objective: To evaluate body composition, anthropometric changes, biochemical and clinical characteristics of female adolescents.
Methods: A total of 113 adolescents from public schools in Viçosa, MG, divided into three groups: group 1 - consisting of eutrophic adolescents with excess body fat; group 2 - eutrophic with body fat within normal limits; and group 3 - with excess weight and body fat. Weight, height, waist and hip circumference, blood pressure were measured. The body mass index (BMI) and waist-hip ratio were calculated. The percentage of body fat was obtained by bioelectrical impedance horizontally, following its own protocol for this evaluation. The assessment of the percentage of body fat and biochemistry was performed after 12 hours of fasting, and analyzed the lipid profile, blood glucose and insulin, homocysteine, leptin and C-reactive protein. Insulin resistance was calculated by HOMA index.
Results: The group of eutrophic adolescents, with higher adiposity, behaved in relation to blood pressure, HDL and glucose levels, similarly to adolescents who are overweight. It can be seen that the HOMA index, insulin and leptin increased with increasing body fat. More than half of adolescents had total cholesterol and CRP levels above recommended levels. The most obvious metabolic disorder related to the lipid profile for both groups studied.
Conclusion: Excess adiposity in normal weight adolescents may be related to clinical and biochemical changes similar to those found in adolescents who are overweight. (Arq Bras Cardiol 2010; 95(4): 464-472)
Key words: Body composition; body weight changes; adiposity; adolescent; obesity.
for greater accuracy in nutritional diagnosis4.
Obesity has been associated with metabolic abnormalities, which contribute to increased risk of developing cardiovascular diseases. The excess deposition of adipose tissue appears, as it is a factor responsible for this situation, especially when this tissue accumulates in the abdominal region. Thus, various disorders in the metabolism of carbohydrates, such as insulin resistance, decreased glucose tolerance and diabetes, and metabolism of lipids, such as hypertriglyceridemia, increased levels of total cholesterol and LDL and decreased levels of HDL, and also changes in blood pressure levels, have been identified in individuals with excess body fat. Thus, estimating the amount of adipose tissue is important in preventing the occurrence of such changes5.
Therefore, this article aims at assessing the body composition, the anthropometric, biochemical and clinical changes in female adolescents.
Methodology
Casuistry
This is a cross-sectional study controlled, considering the
Introduction
Adolescence is characterized by physical, psychological and social changes. It is a period during which major events such as the growth spurt and sexual maturation1,2.
Significant changes in body composition occur during adolescence and especially during puberty. The monitoring of body composition during this phase is important since many aspects of composition such as weight, body fat and lean tissue, are predictive of adult phase characteristics3.
individual as unit of study. The survey was conducted with 113 female adolescents, 14 to 18 years old of Viçosa, MG, having as inclusion criteria: to study at public schools, to be a resident in the municipality and had already presented menarche for at least a year, a fact that contributes to greater homogeneity of the sample.
The adolescents were divided into three groups according to the percentage of body fat and body mass index:
• Group 1 (G1 = 38) - ≥ 28.0% of body fat and body mass index with values > 10.0% and < 85.0%, according to age and sex6;
• Group 2 (G2 = 40) - body fat > 15.0% and < 25.0%7 and body mass index with values > 10.0% and < 85.0%, according to age and sex6, and
• Group 3 (G3 = 35) - ≥ 28.0% of body fat and body mass index with values ≥ 85.0%, according to age and sex6. According to Sigulem et al7, the cutoff points for
classification of high percentage of body fat are those ≥ 25.0% for Lohman8 from this value, adolescents can be classified at risk of overweight. The value of 28.0% was chosen with the purpose to get people who actually possess a high percentage of body fat, trying to increase the specificity in order to reduce false positive results.
Methods
For anthropometric measurements, weight and height were measured using the techniques proposed by Jelliffe9. Weight was obtained in electronic digital scale with a maximum capacity of 150 kg and subdivision at 100 g. Height was measured by stadiometer, with a length of 2 m and 0.1 cm scale. Body mass index (BMI) was classified according to the anthropometric reference of the Center for Disease Control and Prevention and National Center for Health Statistics6.
The body composition (body fat percentage,% BF) was obtained by horizontal bioelectrical impedance (Biodynamics, model 310)10. To this extent, the adolescents followed its own protocol for this purpose: being at least 7 days of last menstrual period and at least seven days from the date of next one11; fasting for 12 hours12; did not perform physical exercise for 12 hours before examination13, did not drink alcohol within 48 hours before examination13; did not use diuretic at least 7 days before14; did not carry any metal object during examination14; and urinating 30 minutes before13.
To measure the circumference, it was used a measuring tape, with 2 m of length, flexible and inelastic, divided into centimeters and subdivided into millimeters. The waist circumference (WC) and hip circumference (HC) were measured as recommended by Taylor et al15. The waist-hip ratio (WHR) was the ratio of the measurement of waist and hips.
Blood pressure (BP) was measured according to the recommendations of the V Brazilian Guidelines on Arterial Hypertension16 using blood pressure monitor with automatic inflation recommended by the Brazilian Society of Cardiology16. The cutoff points for systolic and diastolic pressures were based on the percentiles of height for age and sex, using the values described in the guideline.
For biochemical evaluation, blood was collected after 12 hours of fasting, being analyzed in the Clinical Laboratory, Division of Health, Federal University of Viçosa, in Viçosa, MG. The samples were collected by venipuncture, with disposable material, by using the automatic biochemical analyzer COBAS™. The levels of leptin, insulin and homocysteine levels were measured in a reference laboratory in Rio de Janeiro, RJ.
Lipid proile
The lipid profile was established within the parameters of the I Guideline for the Prevention of Atherosclerosis in Childhood and Adolescence17.
Fasting glucose
The assessment of glucose levels was based on American Diabetes Association18.
Fasting insulin
The cutoff point used to classify the values of insulin was the one recommended by the I Guideline on Prevention of Atherosclerosis in Childhood and Adolescence17.
HOMA-IR
For the control of insulin resistance, the Homeostasis Model Assessment (HOMA-IR) method was used, based on I Guideline for the Prevention of Atherosclerosis in Childhood and Adolescence17.
HOMA-IR = glucose (mmol/l) x insulin (μU/ml)/22.5
Homocysteine
The reference values for considered for homocysteine were those suggested by the III Guideline for Dyslipidemia and Atherosclerosis Prevention19.
C-reactive protein
The reference values established by the III Guideline for Dyslipidemia and Atherosclerosis Prevention were used19.
Leptin
For the leptin assays, reference values from 0.1 to 19.7 mg/ dl were considered, according to reference values for clinical laboratory analysis (LINCO Research kit).
Statistical analysis
The database was developed in Microsoft Excel. Statistical analysis was performed with the help of the Sigma-Statisticâ for Windows.
The project was approved by the Ethics Committee on Human Research at the Federal University of Viçosa (registration number: 40502156/02). The data will be kept confidential and participation was voluntary. Only children whose parents or guardians signed a consent form were enrolled. After each assessment, adolescents who showed abnormalities were referred to the Program for Adolescent Health Care, Federal University of Viçosa, MG.
Results
The teenagers were in the middle phase of adolescence, having passed the growth spurt and presented the characteristic changes of puberty, since it already had at least one year of menarche.
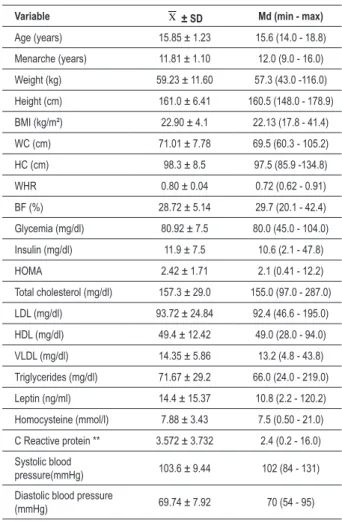
The minimum, maximum and median values, mean and standard deviation of anthropometric, biochemical and clinical variables of adolescents studied (Table 1). Abnormal results were obtained in some adolescents, because the maximum
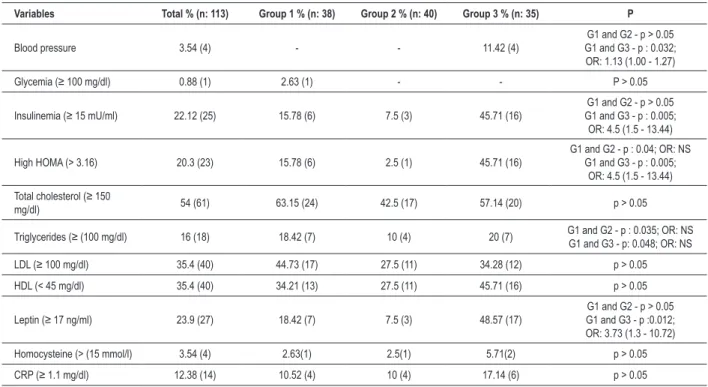
values of blood glucose, insulin, HOMA, total cholesterol, LDL, triglycerides, leptin, homocysteine and CRP levels were above the desirable values. More than half of adolescents had total cholesterol and CRP levels above recommended levels. Table 2 shows the prevalence of clinical and biochemical abnormalities of the adolescents studied. It appears that the index of insulin resistance (HOMA), the values of insulin and leptin levels were higher in adolescents who had higher body fat percentage; however, other variables did not behave the same way.
Table 3 presents the minimum, maximum and median, mean and standard deviation of biochemical changes of the adolescents studied. The group of eutrophic adolescents, with high adiposity, behaved, in relation to blood pressure, HDL and glucose levels, similar to adolescents who present overweight.
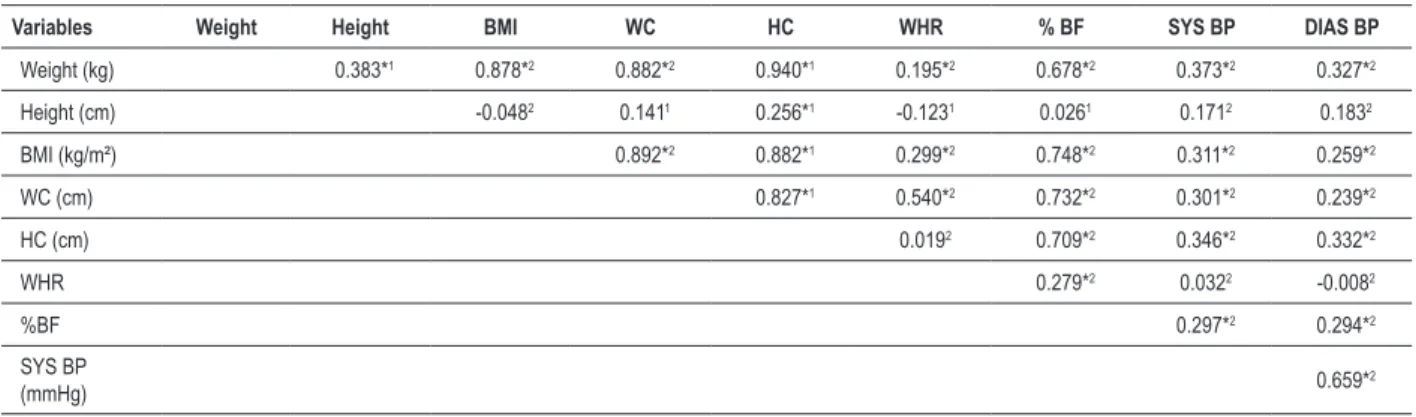
There was a correlation between anthropometric variables, body composition and clinical status of adolescents studied (Table 4) and the waist circumference could be identified as the variable that best correlated with the others.
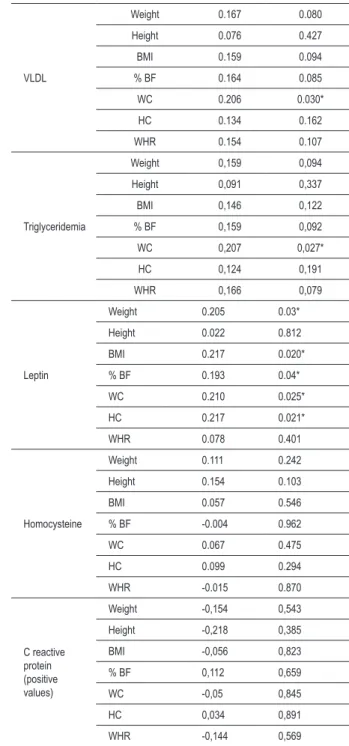
Table 5 shows the correlation between biochemical parameters, anthropometric variables and body composition of adolescents who participated in the study. The HOMA variables and insulin were the ones that best correlated with anthropometric parameters.
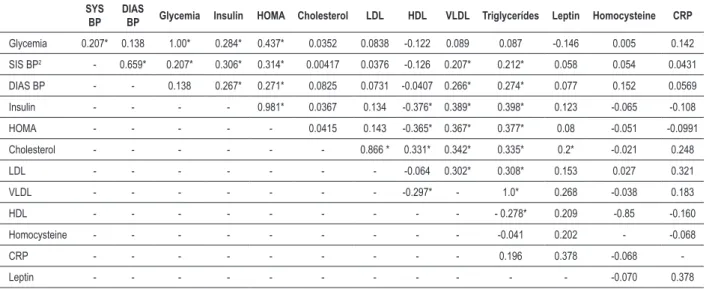
There was a correlation between biochemical variables and clinical characteristics of adolescents in this study (Table 6).
Discussion
The assessment of body weight alone is not able to determine the state of obesity of an individual, as it is not possible to know if overweight is due to fatty tissue, fat free mass, or both. The BMI does not reflect the changes that occur during adolescence, thus, making the evaluation only by BMI may be insufficient to diagnose overweight and it is important to detail the components of the body composition20,21.
Even when the BMI is considered appropriate, excess body fat can contribute to the development of chronic non transmissible diseases22. Beyond the current preoccupation with the adolescent becoming obese adults, there is also concern with obesity during adolescence, because, as it can be seen in this study, when assessed by eutrophic adolescents are evaluated by BMI, but with a high percentage of body fat, they had changes similar to those found in those with overweight. According to Almeida et al23, problems such as formation of atherosclerotic plaques, glucose intolerance, type 2 diabetes, dyslipidemia and hypertension are present also in this phase of life, especially in individuals with excess weight. However, several factors complicate the diagnosis of important metabolic alterations, such as lack of knowledge of the situation mentioned above, access to laboratory tests and the fact that adolescents are asymptomatic.
It was observed a significant association between G1 and G2 and between G1 and G3 for HOMA, in which individuals who are overweight had a 4.5 times greater chance of changes in the levels of this index. For insulin, the association was observed between G1 and G3, with 4.5 times greater chance Table 1 -Minimum, maximum and median values, average and
standard deviation of anthropometric, biochemical and clinical variables of female adolescents of Viçosa - MG, in 2007
Variable X ± SD Md (min - max)
Age (years) 15.85 ± 1.23 15.6 (14.0 - 18.8)
Menarche (years) 11.81 ± 1.10 12.0 (9.0 - 16.0)
Weight (kg) 59.23 ± 11.60 57.3 (43.0 -116.0)
Height (cm) 161.0 ± 6.41 160.5 (148.0 - 178.9)
BMI (kg/m²) 22.90 ± 4.1 22.13 (17.8 - 41.4)
WC (cm) 71.01 ± 7.78 69.5 (60.3 - 105.2)
HC (cm) 98.3 ± 8.5 97.5 (85.9 -134.8) WHR 0.80 ± 0.04 0.72 (0.62 - 0.91)
BF (%) 28.72 ± 5.14 29.7 (20.1 - 42.4)
Glycemia (mg/dl) 80.92 ± 7.5 80.0 (45.0 - 104.0)
Insulin (mg/dl) 11.9 ± 7.5 10.6 (2.1 - 47.8) HOMA 2.42 ± 1.71 2.1 (0.41 - 12.2)
Total cholesterol (mg/dl) 157.3 ± 29.0 155.0 (97.0 - 287.0)
LDL (mg/dl) 93.72 ± 24.84 92.4 (46.6 - 195.0)
HDL (mg/dl) 49.4 ± 12.42 49.0 (28.0 - 94.0)
VLDL (mg/dl) 14.35 ± 5.86 13.2 (4.8 - 43.8)
Triglycerides (mg/dl) 71.67 ± 29.2 66.0 (24.0 - 219.0)
Leptin (ng/ml) 14.4 ± 15.37 10.8 (2.2 - 120.2)
Homocysteine (mmol/l) 7.88 ± 3.43 7.5 (0.50 - 21.0)
C Reactive protein ** 3.572 ± 3.732 2.4 (0.2 - 16.0)
Systolic blood
pressure(mmHg) 103.6 ± 9.44 102 (84 - 131) Diastolic blood pressure
(mmHg) 69.74 ± 7.92 70 (54 - 95)
Table 2 - Prevalence of clinical and biochemical changes of female adolescents of Viçosa - MG in 2007, as per the studied groups
Variables Total % (n: 113) Group 1 % (n: 38) Group 2 % (n: 40) Group 3 % (n: 35) P
Blood pressure 3.54 (4) - - 11.42 (4)
G1 and G2 - p > 0.05 G1 and G3 - p : 0.032; OR: 1.13 (1.00 - 1.27) Glycemia (≥ 100 mg/dl) 0.88 (1) 2.63 (1) - - P > 0.05
Insulinemia (≥ 15 mU/ml) 22.12 (25) 15.78 (6) 7.5 (3) 45.71 (16) G1 and G3 - p : 0.005;G1 and G2 - p > 0.05 OR: 4.5 (1.5 - 13.44) High HOMA (> 3.16) 20.3 (23) 15.78 (6) 2.5 (1) 45.71 (16) G1 and G2 - p : 0.04; OR: NSG1 and G3 - p : 0.005;
OR: 4.5 (1.5 - 13.44) Total cholesterol (≥ 150
mg/dl) 54 (61) 63.15 (24) 42.5 (17) 57.14 (20) p > 0.05 Triglycerides (≥ (100 mg/dl) 16 (18) 18.42 (7) 10 (4) 20 (7) G1 and G2 - p : 0.035; OR: NSG1 and G3 - p: 0.048; OR: NS LDL (≥ 100 mg/dl) 35.4 (40) 44.73 (17) 27.5 (11) 34.28 (12) p > 0.05 HDL (< 45 mg/dl) 35.4 (40) 34.21 (13) 27.5 (11) 45.71 (16) p > 0.05
Leptin (≥ 17 ng/ml) 23.9 (27) 18.42 (7) 7.5 (3) 48.57 (17) G1 and G3 - p :0.012;G1 and G2 - p > 0.05 OR: 3.73 (1.3 - 10.72) Homocysteine (> (15 mmol/l) 3.54 (4) 2.63(1) 2.5(1) 5.71(2) p > 0.05 CRP (≥ 1.1 mg/dl) 12.38 (14) 10.52 (4) 10 (4) 17.14 (6) p > 0.05
HOMA - homeostasis model assessment; Chi-square test; OR - odds ratio; NS - non signiicant.
Table 3 -Minimum, maximum and median values, average and standard deviation of biochemical variable of female adolescents, as per the
studied groups
Variables Group 1 (G1) Group 2 (G2) Group 3 (G3) p
X ± SD Md (min - max) X ± SD Md (min - max) X ± SD Md (min - max)
Glycemia
(mg/dl) 82.26 ± 9.44 82.0 (45.0 - 104.0) 78.8 ± 5.98 78.5 (70.0 - 95.0) 81.91 ± 6.26 82.0 (65.0 - 92.0) G1 = G2: p > 0.05
a
G1 = G3: p > 0.05a
Insulinemia
(um/ml) 11.64 ±6.82 10.5 (5.5 - 47.8) 8.36 ± 4.18 7.65 (2.1 - 16.3) 16.22 ± 8.83 13.3 (6.3 - 39.8) G1 > G2: p < 0.05
b
G1 < G3: p < 0.05b
HOMA 2.43 ±1.8 2.08 (0.81 - 2.26) 1.63 ± 0.85 1.5 (0.41 - 3.74) 3.32 ± 1.95 2.72 (1.21 - 8.55) G1 > G2: p < 0.05
b
G1 < G3: p < 0.05b
Cholesterolemia
(mg/dl) 163.4 ± 34.0 159.5 (101 - 287) 153.0 ± 27.4 147.5 (97 - 220) 155.7 ± 24.5 155.0 (104 - 211) G1 = G2: p > 0.05
a
G1 = G3: p > 0.05a
Triglyceridemia
(mg/dl) 74.42 ± 37.67 64.5 (34.0 - 219.0) 65.71 ± 22.66 60.5 (24.0 - 125.0) 75.48 ± 24.66 72.0 (30.0 - 120.0) G1 = G2: p > 0.05
a
G1 = G3: p > 0.05a
LDL (mg/dl) 98.1 ± 27.71 96.3 (53.0 - 195.0) 87.96 ± 23.46 85.5 (46.6 - 156.0) 94.92 ± 22.46 93.2 (48.6 - 149.6) G1 = G2: p > 0.05
a
G1 = G3: p > 0.05a
VLDL (mg/dl) 14.81 ± 7.62 12.80 (6.8 - 43.8) 13.14 ± 4.53 12.10(4.8 - 25.0) 15.28 ± 4.88 14.70 (6.00 - 24.0) G1 = G2: p > 0.05
b
G1 = G2: p > 0.05b
HDL (mg/dl) 50.47 ± 13.3 50.0 (29.0 - 94.0) 51.87 ± 12.46 52.5 (28.0 - 84.0) 45.68 ± 10.73 46.0 (33.0 - 84.0) G1 = G2: p > 0.05
a
G1 = G3: p > 0.05a
Leptin (ng/ml) 12.45 ± 5.55 11.40 (4.6 - 30.9) 12.10 ± 22.86 6.4 (2.2 - 120.20) 19.12 ± 10.58 16.4 (6.9 - 50.4) G1 > G2: p < 0.05
a
G1 < G3: p < 0.05a
Homocysteine
(mmol/l) 8.70 ± 3.17 7.75 (4.4 - 21.0) 7.52 ± 3.38 7.10 (0.5 - 9.5) 7.38 ± 3.66 7.10 (0.9 - 18.9) G1 = G2: p > 0.05
a
G1 = G3: p > 0.05a
SYS BP (mmHg) 104.15 ± 7.87 105.5 (84.0 - 119.0) 99.65 ± 7.78 99.0 (84.0 - 121.0) 107.51 ± 11.05 106.0 (89.0 - 131.0) G1 > G2: p < 0.05
a
G1 = G3: p > 0.05 a
DIAS BP
(mmHg) 70.63 ± 7.20 71.0 (54.0 - 86.0) 66.57 ± 6.39 66.0 (55.0 - 80.0) 72.40 ± 9.13 70.0 (58.0 - 95.0) G1 > G2: p < 0.05
a
G1 = G3: p > 0.05 a
Table 4 - Correlation between anthropometric, body composition and clinic variables of female adolescents of Viçosa - MG, evaluated in 2007
Variables Weight Height BMI WC HC WHR % BF SYS BP DIAS BP
Weight (kg) 0.383*1 0.878*2 0.882*2 0.940*1 0.195*2 0.678*2 0.373*2 0.327*2
Height (cm) -0.0482 0.1411 0.256*1 -0.1231 0.0261 0.1712 0.1832
BMI (kg/m²) 0.892*2 0.882*1 0.299*2 0.748*2 0.311*2 0.259*2
WC (cm) 0.827*1 0.540*2 0.732*2 0.301*2 0.239*2
HC (cm) 0.0192 0.709*2 0.346*2 0.332*2
WHR 0.279*2 0.0322 -0.0082
%BF 0.297*2 0.294*2
SYS BP
(mmHg) 0.659*2
Pearson Correlation1, Spearman Correlation2, * signiicant results. BMI - body mass index; WC - waist circumference; HC - hip circumference; WHR - waist-hip ratio; %
BF - body fat percentage; SYS BP - systolic blood pressure; DIAS BP - diastolic blood pressure.
for developing changes in the values of this hormone (Table 2). It appears that the values of HOMA and insulin were higher in adolescents with higher body fat percentage (Table 3).
Assessing the lipid profile, it was found that G1 and G3 have had mean and median values for total cholesterol above the desirable level (Table 3), ie in more than half of teenagers, it was already possible to identify this change, noting that 42 5% of adolescents in G2, ie eutrophic, had total cholesterol levels above the desirable level. Faria24, in a study on diagnostic criteria of metabolic syndrome associated with excess weight, body fat and insulin resistance in adolescent girls, found inadequate levels of total cholesterol in 57.0% of the population, 22.0% for triglycerides, 47.0% for LDL and 50.0% for HDL, even in eutrophic female adolescents. According to Fonseca25, atherogenic dyslipidemia is characterized by elevated triglycerides, low levels of HDL fraction and increased levels of LDL.
The genesis of atherosclerosis is correlated to lipid levels in adolescents, with the possible identification of atheromatous plaques in this phase. The genesis of atherosclerosis can begin in childhood with the development of streaks in the aorta and its progress in adulthood, being therefore important the early identification of high risk based on obesity, high body fat, family history and lipid abnormalities. Decreased levels of HDL accelerate the progression of atherosclerosis, because their function is the reverse cholesterol transport, ie, the removal of cholesterol from cells, transporting it to the liver for metabolization. Moreover, it prevents the aggregation of LDL particles to the endothelium4,26.
Ribeiro et al27, assessing cardiovascular risk in children and adolescents between 6 and 18 years old, found that 32.9% and 25.1% had total cholesterol and LDL, respectively, above the desirable values, and 17.0% had HDL levels below desired levels.
According to the I Guideline for the Prevention of Atherosclerosis in Childhood and Adolescence17, epidemiological studies in Brazil have identified the prevalence of primary hypertension, which ranged from 0.8 to 8.2% among children and adolescents. In this study, it could be seen that 3.54% of the female adolescents had high
blood pressure, all of whom had overweight, with association between G1 and G3 with a 1.13 time greater chance for developing changes in the blood pressure levels (Table 2).
We could identify the influence of body fat in the blood pressure, systolic and diastolic, as there was no statistical difference between G1 and G3 (Table 3). The correlation between systolic and diastolic blood pressure, WC, HC, BMI and body fat percentage was significant, demonstrating the relationship between adiposity and blood pressure levels (Table 4).
According to the I Guideline for the Prevention of Atherosclerosis in Childhood and Adolescence17, increasing global prevalence of primary arterial hypertension in childhood and adolescence has a direct relationship with increasing prevalence of obesity, with obesity as a risk factor for systemic arterial hypertension in childhood.
Analyzing the levels of leptin, it could be noticed a significant difference between groups: G1 > G2 and G1 < G3. Association was observed between G1 and G3 with 3.73 times greater chance for changes in leptin levels (Table 3). There was a correlation between leptin and total cholesterol, weight, BMI, WC, HC and body fat percentage (Tables 5 and 6). The influence of body fat in determining levels of leptin is highlighted, which increases in line with changes in body composition. Some studies identify a correlation between leptin and insulin, a fact not evidenced in this study28,29.
Arslanian et al28 found that leptin levels reflect body fat stocks and apparently there are no differences between genders and between stages of sexual maturation. Correlation was found between leptin levels and fasting insulin levels. The study found that obesity and hyperinsulinemia are associated with high levels of leptin. The authors state that there is still much controversy among the results of research involving leptin.
Anahita et al30, studying leptin concentration in obese children, found that it correlated with levels of systolic and diastolic blood pressure and triglycerides. The leptin concentration was significantly higher in obese subjects.
Table 5 - Correlation between the biochemical parameters, anthropometric variables and body composition of female adolescents
Anthropometric
parameters r p
HOMA
Weight 0.385 < 0.0001*
Height 0.087 0.355
BMI 0.382 < 0.0001* % BF 0.378 < 0.0001*
WC 0.449 < 0.0001*
HC 0.362 < 0.0001*
WHR 0.309 < 0.0001*
Glycemia
Weight 0.175 0.064
Height 0.023 0.802
BMI 0.195 0.038*
% BF 0.180 0.056
WC 0.212 0.024*
HC 0.214 0.023*
WHR 0.065 0.493
Insulinemia
Weight 0.387 < 0.0001*
Height 0.111 0.240
BMI 0.371 < 0.0001* % BF 0.377 < 0.0001*
WC 0.442 < 0.0001*
HC 0.351 < 0.0001*
WHR 0.318 < 0.0001*
Total
cholesterol
Weight 0.162 0.086
Height 0.021 0.819
BMI 0.154 0.104
% BF 0.091 0.337
WC 0.142 0.133
HC 0.168 0.076
WHR 0.008 0.926
LDL
Weight 0.218 0.020*
Height 0.005 0.953
BMI 0.228 0.015*
% BF 0.160 0.089
WC 0.226 0.016*
HC 0.212 0.024*
WHR 0.095 0.313
HDL
Weight - 0.154 0.104
Height - 0.060 0.524
BMI - 0.154 0.104 % BF - 0.183 0.052
WC - 0.221 0.018*
HC - 0.101 0.285
WHR - 0.224 0.017*
VLDL
Weight 0.167 0.080
Height 0.076 0.427
BMI 0.159 0.094
% BF 0.164 0.085
WC 0.206 0.030*
HC 0.134 0.162
WHR 0.154 0.107
Triglyceridemia
Weight 0,159 0,094 Height 0,091 0,337 BMI 0,146 0,122
% BF 0,159 0,092 WC 0,207 0,027* HC 0,124 0,191 WHR 0,166 0,079
Leptin
Weight 0.205 0.03*
Height 0.022 0.812
BMI 0.217 0.020*
% BF 0.193 0.04*
WC 0.210 0.025*
HC 0.217 0.021*
WHR 0.078 0.401
Homocysteine
Weight 0.111 0.242
Height 0.154 0.103
BMI 0.057 0.546
% BF -0.004 0.962
WC 0.067 0.475
HC 0.099 0.294
WHR -0.015 0.870
C reactive protein (positive values)
Weight -0,154 0,543 Height -0,218 0,385 BMI -0,056 0,823
% BF 0,112 0,659 WC -0,05 0,845 HC 0,034 0,891 WHR -0,144 0,569
Pearson correlation1, Spearman correlation2, *statistically signiicant results. BMI
- body mass index; WC - waist circumference; HC - hip circumference; WHR - waist-hip ratio; % BF - body far percentage; SIS BP - systolic blood pressure; DIAS BP - diastolic blood pressure.
levels of leptin can inhibit the secretion of insulin31. In a study on insulin resistance and leptin, conducted with 402 adolescents, and Huang et al31 found that leptin was positively correlated with central fat distribution and total body fat, with levels of triglycerides and HOMA. The same authors claim that leptin levels have been associated with decreased arterial distensibility, and leptin potent predictor of cardiovascular disease and metabolic syndrome in adolescents.
Table 6 - Correlation between biochemical and clinic variables of female adolescents
SYS BP
DIAS
BP Glycemia Insulin HOMA Cholesterol LDL HDL VLDL Triglycerídes Leptin Homocysteine CRP
Glycemia 0.207* 0.138 1.00* 0.284* 0.437* 0.0352 0.0838 -0.122 0.089 0.087 -0.146 0.005 0.142
SIS BP2 - 0.659* 0.207* 0.306* 0.314* 0.00417 0.0376 -0.126 0.207* 0.212* 0.058 0.054 0.0431
DIAS BP - - 0.138 0.267* 0.271* 0.0825 0.0731 -0.0407 0.266* 0.274* 0.077 0.152 0.0569
Insulin - - - - 0.981* 0.0367 0.134 -0.376* 0.389* 0.398* 0.123 -0.065 -0.108 HOMA - - - 0.0415 0.143 -0.365* 0.367* 0.377* 0.08 -0.051 -0.0991
Cholesterol - - - 0.866 * 0.331* 0.342* 0.335* 0.2* -0.021 0.248
LDL - - - -0.064 0.302* 0.308* 0.153 0.027 0.321
VLDL - - - -0.297* - 1.0* 0.268 -0.038 0.183
HDL - - - 0.278* 0.209 -0.85 -0.160
Homocysteine - - - -0.041 0.202 - -0.068
CRP - - - 0.196 0.378 -0.068
-Leptin - - - -0.070 0.378
Pearson correlation1; Spearman correlation2; BMI - body mass index; WC - waist circumference; HC - hip circumference; WHR - waist-hip ratio; % BF - body fat percentage;
SYS BP - systolic blood pressure; DIAS BP - diastolic blood pressure; CRP - C reactive protein; * signiicant results.
with no difference between groups (Table 2). Homocysteine is an amino acid important in the formation process of DNA, with hyperhomocysteinemia associated with cardiovascular events in adults by facilitating the process of oxidative injury in the arteries and increase muscle cell proliferation. Among adolescents, correlations between homocysteine and diabetes or metabolic syndrome variables have been inconsistent, the association with BMI and blood pressure is low, with usually exempt lipid profile32.
According to the III Brazilian Guidelines on Dyslipidemia and Prevention of Atherosclerosis19, although homocysteine is not considered an independent risk factor, its elevation may be a marker for the development of vascular disease and a worst prognosis in patients with atherosclerosis.
The C-reactive protein was altered in 12.38% of teenagers, no statistical difference between groups; however, adolescents with higher percentage of body fat showed higher values (Table 2). Average and median values were above the reference values, while more than half of adolescents with this change (Table 1). CRP values were not correlated with the anthropometric variables, clinical or biochemical (Tables 5 and 6).
The C-reactive protein (CRP) is a marker of inflammation and elevated levels are associated with increased risk of coronary disease in healthy adults and may predict increased risk of future coronary events33. In a study correlating levels of C-reactive protein and anthropometric profile, percentage of body fat and lipids in adolescents, Vikram et al33 found that individuals who are overweight and a higher percentage of body fat had higher levels of CRP, with no correlation with the lipid profile. Even small changes in concentrations of CRP may predict the development of cardiovascular disease and diabetes. Inflammatory cytokines released by adipose tissue stimulate the production of CRP and may be associated with the development of cardiovascular disease because they cause changes in insulin sensitivity, increased release
of adhesion molecules by endothelium increased hepatic release of fibrinogen and pro-coagulant effect platelets in children and adolescents34.
The percentage of body fat showed a strong correlation with weight, BMI, WC, HC and lower correlations, but significant, with systolic and diastolic blood pressure and WHR (Table 4). There were poor correlations between the percentage of body fat and biochemical HOMA, insulin and leptin tests. There was no correlation between body fat and lipid profile (Tables 5 and 6).
It was found that waist circumference was the variable that most correlated with the others (Tables 4 and 5).
Waist circumference and waist-hip ratio are used as measures of body fat distribution and risk indicator of metabolic diseases, however, have limited use in adolescents due to the absence of validated cutoff points4. According to Oliveira et al26, waist circumference alone has been shown greater association with metabolic changes than the waist-hip ratio, also in adolescents. Due to the rapid changes occurring in the pelvic girdle, characteristics of adolescence, especially during sexual maturation, changes in waist-hip ratio may be more related to these changes than changes in body fat distribution.
Waist circumference is considered the most sensitive parameter and specific accumulation of body fat in the upper body. It is a measure that can be used in isolation in determining risk of developing metabolic disorders in young people, including children and adolescents27.
clearance. This fact contributes to increased peripheral insulin resistance and hyperinsulinemia, promoting the development of hypertension and atherosclerotic process35.
Importantly, the presence of several changes among adolescents in this study, whose maximum values of blood glucose, insulin, HOMA, total cholesterol, LDL, triglycerides, leptin, homocysteine and CRP levels were above the desirable values. More than half of adolescents had total cholesterol and CRP levels above recommended levels.
Lipid changes are worrying, since the atheromatous plaques can initiate their development in childhood and adolescence, showing a direct relationship with lipid profile. Thus, the nutrition education programs are very important that aim not only at maintaining healthy weight, but also adiposity within normal values, in order to prevent the occurrence of metabolic and clinic changes during adolescence and more
severe complications in adulthood.
Potential Conflict of Interest
No potential conflict of interest relevant to this article was reported.
Sources of Funding
This study was funded by FAPEMIG.
Study Association
This article is part of the thesis of master submitted by Hiara MIguel Stanciola Serrano, Gisele Queiroz Carvalho and Patrícia Feliciano Pereira, from Universidade Federal de Viçosa.
References
1. Oliveira EAJ, Vitalle MSS, Amancio OMS. Estado nutricional no estirão pubertário. Brasil Pednews. 2002; 3 (3).
2. Vitolo MR. Nutrição: da gestação à adolescência. Rio de Janeiro: Reichmann & Affonso Editores; 2003.
3. Siervogel RM, Demerath EW, Schubert C, Remsberg KE, Chumlea WC, Sun S, et al. Puberty and body composition. Horm Res. 2003; 60 (1): 36-45.
4. Nutrition in adolescence: issues and challenges for the health sector: issues in adolescent health and development. Geneva: WHO; 2005. (WHO Discussion Papers on Adolescence)
5. Guedes DP, Guedes JERP. Controle do peso corporal: composição corporal, atividade física e nutrição. Rio de Janeiro: Shape; 2003.
6. Kuczmarski RJ, Ogden CL, Guo SS, Grummer-Strawn LM, Flegal KM, Mei Z, et al. 2000 CDC Growth charts for the United States: methods and development. Vital Health Stat. 2002; 246: 1-190.
7. Sigulem D, Veiga GV, Priore SE. Estado nutricional em adolescentes de baixa renda. In: Fisberg M. Obesidade na infância e adolescência: São Paulo: Fundação BYK; 1995. p. 80-3.
8. Lohman TG. Assessing fat distribution. In: Advances in body composition assessment: current issues in exercise science. Illinois: Human Kinetics. Champaign; 1992. p. 57-63.
9. Jelliffe DB. Evaluacion del estado de nutrición de la comunidad. Genebra, Organización Mundial de la Salud; 1968 (Serie de monografias, 53).
10. Heyward VH, Stolarczyk LM. Método antropométrico. In: Heyward VH, Stolarczyk LM. Avaliação da composição corporal aplicada. São Paulo: Manole; 2000. p. 73-98.
11. Gleichauf CN, Roe DA. The menstrual cycles’s effect on the realibility of bioimpedance measurements for assessing body composition. Am J Clin Nutr. 1989; 50 (5): 903-7.
12. Slinder F, Hulthen LR. Bioelectrical impedance: effect of 3 identical meals on diurnal impedance variation and calculation of body composition. Am J Clin Nutr. 2001; 74 (4): 474-8.
13. Manual de utilização do Biodynamics Model 310. 2001. [Acesso em 2005 dez 5]. Disponível em: http://www.biodyncorp.com/product/310/310.html
14. National Institutes of Health Tecnology Assessment Conference Statement. Bioelectrical impedance analysis in body composition measurement. Nutrition. 1994; 12 (1): 1-35.
15. Taylor RW, Jones IE, Williams SM, Goulding A. Evaluation of waist circumference, waist to hip ratio, and the conicity index as screening tools for high trunk fat mass, as measured by dual energy X- ray absorptiometry, in
children aged 3-19 y. Am J Clin Nutr. 2000; 72 (2): 490-5.
16. Sociedade Brasileira de Cardiologia. Sociedade Brasileira de Hipertensão. V Diretrizes brasileiras de hipertensão arterial. Arq Bras Cardiol. 2007; 89 (3): e24-e79.
17. Sociedade Brasileira de Cardiologia. I Diretriz de prevenção da aterosclerose na infância e adolescência. Arq Bras Cardiol. 2005; 85 (6): 3-36.
18. American Diabetes Association. Diagnosis and classification of Diabetes mellitus. Diabetes Care. 2006; 29: 43-8.
19. Sociedade Brasileira de Cardiologia. III Diretrizes brasileiras sobre dislipidemias e diretriz de prevenção da aterosclerose do Departamento de Aterosclerose da Sociedade Brasileira de Cardiologia. Arq Bras Cardiol. 2001; 77 (3): 1-48.
20. Priore SE. Composição corporal e hábitos alimentares de adolescentes: uma contribuição à interpretação de indicadores do estado nutricional. [tese] São Paulo: Escola Paulista de Medicina, Universidade Federal de São Paulo; 1998.
21. Wells JCK. A Hattori chart analysis of body mass index in infants and children. Int J Obes. 2000; 24 (3): 325-9.
22. Pereira PF, Vieira PCR, Franceschini SCC, Priore SE. Associação do estado nutricional, composição corporal e localização de gordura corporal com lipídios séricos em adolescentes do município de Viçosa, MG. Nutrição Brasil. 2006; 5 (2): 82-90.
23. Almeida CAN, Pinho AP, Ricco RG, Elias CP. Circunferência abdominal como indicador de parâmetros clínicos e laboratoriais ligados à obesidade infanto-juvenil: comparação entre duas referências. J Pediatr (Rio J). 2007; 83 (2): 181-5.
24. Faria ER. Critérios diagnósticos e fatores de risco para síndrome metabólica em adolescentes que já apresentaram a menarca, de escolas públicas de Viçosa-MG. [Dissertação], Viçosa: Universidade Federal de Viçosa; 2007.
25. Fonseca VA. The metabolic syndrome, hyperlipidemia and insulin resistance. Clinical Cornerstone. 2005; 7 (2-3): 61-72.
26. Oliveira CL, Mello MT, Cintra IP, Fisberg M. Obesidade e síndrome metabólica na infância e adolescência. Rev Nutr (Campinas). 2004; 17 (2): 237-45.
27. Ribeiro RQC, Lotufo PA, Lamounier JA, Oliveira RG, Soares JF, Botter DA. Fatores adicionais de risco cardiovascular associados ao excesso de peso em crianças e adolescentes: o estudo do coração de Belo Horizonte. Arq Bras Cardiol. 2006; 86 (6): 408-18.
28. Arslanian S, Suprasongsin C, Kalhan SC, Drash AL, Brna R, Janosky JE. Plasma leptin in children: relationship to puberty, gender, body composition, insulin sensitivity and energy expenditure. Metabolism. 1998; 47 (3): 309-12.
of leptin to insulin resistance syndrome in children. Obes Res. 2003; 11 (9): 1124-30.
30. Anahita H, Hossein F, Alireza M, Ramin H, Pantea E, Bagher L. Metabolic syndrome and leptin concentrations in obese children. Indian J Pediatr. 2006; 73 (7): 593-6.
31. Huang KC, Lin RCY, Kormas N, Lee LT, Chen CY, Gill TP, et al. Plasma leptin is associated with insulin resistance independent of age, body mass index, fat mass, lipids and pubertal development in nondiabetic adolescents. Int J Obes. 2004; 28 (4): 470-5.
32. Casanueva VE, Cid XC, Cancino MM, Borzone LT. Homocisteína en niños y adolescentes: relación con historia familiar de enfermedad cardiovascular.
Rev Med Chile. 2003; 131(9): 997-1002.
33. Vikram NK, Misra A, Pandey RM, Luthra K, Wasir JS, Dhingra V. Heterogeneous phenotypes of insulin resistance and its implications for defining metabolic syndrome in Asian Indian adolescents. Atherosclerosis. 2005; 186 (1): 193-9.
34. Brasil AR, Norton RC, Rossetti MB, Leão E, Mendes RP. Proteína C reativa como indicador de inflamação de baixa intensidade em crianças e adolescentes com e sem obesidade. J Pediatr (Rio J). 2007; 83 (5): 477-80.