Adenosine Myocardial Perfusion SPECT with
Tc-99m-MIBI in Patients with Obstructive
Coronary Artery Disease: Correlation between
Quantitative Coronary Angiography and
Intravascular Ultrasound Measurements
Luiz Eduardo Mastrocolla, Amanda G. M. R. Sousa, Paola E. P. Smanio, Rodolfo Staico, Ibraim F. M.
Pinto, Romeu S. Meneghelo, Andreia C. Abizaid, Roselei Graebin, Vinicius D. Vaz,
Angela Paes, Daniela S. Martins, José Eduardo M. R. Sousa
Instituto Dante Pazzanese de Cardiologia - São Paulo, SP - Brazil
Mailing Address: Luiz Eduardo Mastrocolla • Rua Leopoldo Couto de Magalhães, 1305/21 – 04542-012 – São Paulo, SP - Brazil E-mail: [email protected] Received on 11/03/03 • Accepted on 04/29/05
O
BJECTIVETo correlate myocardial perfusion scintigraphy (MPS) with Tc-99m-MIBI and adenosine infusion using quantitative coronary angiography (QCA) and intravascular ultrasound (IVUS).
M
ETHODSSeventy patients with coronary artery disease (CAD) referred for myocardial perfusion scintigraphy (MPS) with MIBI and adenosine were studied. Clinical, electrocardiographic (ECG), and scintigraphic fi ndings were correlated with variables of visual and quantitative angiographic analysis, as well as to those of IVUS.
R
ESULTSThe mean age of patients was 60.6 years, and 39 were male. Coronary angiography showed percentage of diameter stenosis (% DS) of 49.94% in 105 arteries, 83 of which were re-evaluated by QCA (79%), mean of 44.20%, p<0.05. ST-segment depression during adenosine infusion was associated with higher degrees of % DS (55.0% vs. 47.8%), p<0.05). Scintigraphic ischemia was correlated with greater cross-sectional area (CSA) of lumen obstruction by IVUS (% CSA). Clinical, ECG, and IVUS fi ndings were considered together and expressed as global ischemic versus non-ischemic responses. Ischemia was associated with lower values of minimal lumen diameter (MLD) and minimal lumen area (MLA) determined by QCA and IVUS.
C
ONCLUSIONTc-99m-MIBI and adenosine myocardial SPECT is correlated with % CSA on IVUS, perfusion images considered. Global results assessment showed association between lumen diameter and area at obstructed sites as determined by QCA and IVUS.
K
EY WORDSSPECT myocardial perfusion with radiopharmaceuticals (either thallium-201 or Tc-99m-labeled sestamibi) associated with stress testing or pharmacological vasodilation is a well-established and widely accepted method for the diagnosis and risk stratifi cation of coronary artery disease1-7 (CAD), using coronary angiography as standard. Optimal diagnostic and prognostic values are obtained in the presence of severe coronary lesions, with a decreased level of accuracy of scintigraphic examination in case of lower degrees of obstruction. Likewise, angiogram visual interpretation demonstrates signifi cant inter- and intraobserver variability, and any standard angiographic view may estimate the degree of luminal narrowing incorrectly.
Therefore, this study was designed to correlate Tc-99m-MIBI and adenosine myocardial SPECT in lesions of varying degrees using off-line quantitative coronary angiography (QCA) and intravascular ultrasound (IVUS).
M
ETHODS
From March 2001 to February 2003, seventy consecutive CAD patients referred for myocardial perfusion imaging (Gated-SPECT) were enrolled in this study. Inclusion criteria were: subjects of both genders older than 30 years; clinical manifestation of stable or controlled unstable angina; silent ischemia demonstrated by previous functional tests; varying degrees of luminal narrowing with single- or multi-vessel disease. Exclusion criteria were: patients with acute myocardial infarction, decompensated heart failure, symptomatic cerebrovascular insuffi ciency or history of recurrent vascular headache, chronic obstructive pulmonary disease, left bundle branch block, second-degree or higher atrioventricular block (AV), systolic pressure lower than 90 mmHg, history of hypersensibility to dipyridamole or adenosine, and use of substances such as methylxanthines and caffeine at the day of examination. The study protocol was approved by the Institutional Research Ethics Committee, and all patients signed an informed consent.
Study flow chart – Once clinical eligibility was
confi rmed, standard coronary angiography was reevaluated by the researcher and by two independent observers and, whenever possible, lesions were submitted to an off-line quantitative assessment for the degree of lumen diameter stenosis. Patients were then referred for myocardial scintigraphy associated with adenosine injection, in a two-step procedure carried out on subsequent days. Finally, all data, including available IVUS information, were quantitatively analyzed off-line at the core laboratory.
Myocardial perfusion scintigraphy (Gated-SPECT) with Tc-99m-MIBI – Performed following the two-day protocol,9 with images acquired 30-60 minutes after the pharmacologic stress phase and at rest, 24 hours after the fi rst step. Nitrates were discontinued the day of test; caffeine, methylxanthines or derivatives, for 24 hours 10 and beta-blockers, for 48 hours.
First step – Included clinical evaluation, continuous monitoring and 13-lead ECG tracings11, minute by minute, during 8 minutes, using the Teb Apex 2000 multi-channel recording system (TEB – São Paulo, Brazil), concomitantly with adenosine infused at 140 µg.kg.min-1, over 6 minutes12, by intravenous pump (DigiBomb, model DB-03-FAJ, São Paulo, Brazil). A dose of 740 to 814 MegaBequerel (Mbq) of Tc-99m-MIBI was administered at the third minute of adenosine injection, and treadmill walking was added with energy expenditure up to seven metabolic equivalents (METs) after routine controls and IV aminophylline (1 to 2 mg.kg.min-1) in case side effects or high-risk ischemia signs persisted. Criteria for ischemic response included ST-segment depression equal to or higher than 1 mm according to established guidelines13 ; pain or associated clinical manifestations suggestive of coronary faiure14-16. A Millennium VG dual-head gamma camera (GE Medical Systems, Milwaukee, USA) equipped with high-resolution, low-energy parallel-hole collimators was used. Sequential tomographic images were obtained on a 64 x 64 matrix, starting within 60 minutes of Tc-99m-MIBI injection, using the Gated-SPECT technique according to standard methodology17.
Second step – Performed 24 hours after the fi rst one, without the pharmacological effect of adenosine and using the same imaging sequence and processing18.
Analysis of SPECT perfusion images - After image
reorientation and reconstruction, radiopharmaceutical uptake and wall motion and thickening classifi cation2,19,20, interpretation was made by two independent observers, according to the I Guideline for Nuclear Cardiology of the Brazilian Society of Cardiology10.Myocardial distribution patterns of the radiopharmaceutical10were treated as categorical variables, and only two possibilities were considered: normal uptake versus altered uptake and non-ischemic uptake versus reversible reduced uptake or suggestive of ischemia. Similarly, quantitative analysis of myocardial left ventricular motion and thickness was classifi ed in normal versus altered response, aiming at the association with those variables derived from visual angiography, QCA and IVUS.
Conventional and quantitative coronary angiography –Lesions were reevaluated visually, according to degree of obstruction21,22 (≤ 30%; 30 to 49%; 50 to 69%; ≥ 70%; 95% and 100%, respectively), location (ostial, proximal, middle third or distal), using the angiographic defi nitions of the Bypass Angioplasty Revascularization Investigation trial (BARI). Vessels included left main coronary artery (LM), left anterior descending artery (LAD), diagonal or diagonalis ramus (Dg), left circumfl ex (Cx), marginal or marginalis ramus (Mg), and right coronary artery (RCA).
Eindhoven, the Netherlands), using standard technique and procedures24. As for the quantitative evaluation, the system itself (CMS
, Medis Medical System , the Netherlands) characterized artery boundaries according to criteria of arterial lumen brightness, with operator interaction. Quantitative variables for off-line analysis included proximal reference diameter (PRD), distal reference diameter (DRD), interpolated reference diameter (IRD) and minimal lumen diameter (MLD), all expressed in millimeters. IRD was adopted as reference diameter (RD) value for the site of obstruction. Percentage of diameter stenosis (% DS) was calculated from the ratio between the difference of RD and minimal lumen diameter divided by reference diameter, according to the following equation:
RD - MLD
RD
% DS =
x 100
Angiographic minimal lumen cross-sectional area (MLA) was estimated from the sum of the square of minimal lumen diameters derived from two orthogonal views (MLD1 and MLD2) adjusted by a correction factor, according to the following formula.
MLA = 0.51 x (MLD1)
2+ (MLD2)
2Intravascular ultrasound indicated by the patient’s referral physician was performed immediately after standard coronary angiography, using the Clear View® system (Boston Scientifi c
, Boston, USA) and the Ultra 30-MHz catheter (CVIS
, USA), in accordance with the previously mentioned methodology. Off-line quantitative analysis was performed using a computerized planimetry system (TapeMeasure
, Indec Systems, Inc, California, USA) following standard methodology of the interventional cardiology unit24. IVUS quantitative variables used for the association with scintigraphic variables included: a) arterial lumen area, measured at references and at lesion site, characterizing reference lumen area (RLA) and minimal lumen area (MLA), both in square millimeters; b) minimal lumen diameter (MLD), derived from the MLA outline, in millimeters; c) cross-sectional area of lumen obstruction (CSA), according to the following formula:
RLA - MLA
RLA
% CSA =
x 100
Statistical analysis was performed by the SPSS software (SPSS Inc, Chicago, Illinois). Categorical
variables were expressed as absolute frequencies and percentages, and quantitative variables, as means, standard errors, minimum and maximum values. Student’s t test was used to compare dichotomous and quantitative variables, by comparing the means, using Pearson’s correlation coeffi cient to assess the relationship between two quantitative variables. Statistical signifi cance level was set at 0.05.
RESULTS
Sample consisted of 39 (55.7%) men and 31 (44.3%) women, mean age 60.6 years (SD = 9.43). Mean number of risk factor was 2.69 (SD = 1.11) per patient, notably arterial hypertension in 74.3%, diabetes in 30%, previous myocardial infarction in 25.7%, and percutaneous coronary intervention in 15.7%. Patients were clinically stable on the day of pharmacological test, and the interval between coronary angiography and scintigraphy was 2.48 (SD = 2.97) months.
Angiograms were reviewed aiming at off-line quantitative analysis and obtaining data to be compared with scintigraphic variables results. A hundred and fi ve coronary lesions were reevaluated. The number of affected vessels is described in Table I.
Table I – Distribution of coronary artery disease according to the number of affected vessels
per patient
Nº of vessels n % % accumulated
1 43 61.4 61.4
2 20 28.6 90.0
≥ 3 7 10.0 100.0
Total 70 100.0
n = number of patients; % = percentage
The artery most frequently affected in patients with one-, two- and three-vessel disease was the left anterior descending (LAD) in 25 patients (58.1%), 14 patients (70.0%), and 6 patients (85.7%) respectively, followed by the right coronary artery (RCA) in 14 patients (32.5%), 7 patients (35%) and 5 patients (71.4%), and the left circumfl ex (Cx) in 3 patients (7%), 8 patients (40%) and 6 patients (85.7%). Collateral circulation was present in 6 patients (8.6%); in three (50%) of them it was intracoronary and intercoronary in the other 3 (50%); grade I/II in 4 (66.6%), and grade III in 2 (33.3%). In 5 patients (83.3%) this collateral circulation was related to the occluded arteries and in 1 patient (16.6%) to an intermediate lesion. Mean values of diameter stenosis percentage was 49.94% (SD 12.65).
Table II – Results of the variables obtained by off-line quantitative coronary angiography
Variables n Mean DP Variation
% DS 83 44.19 10.37 14.00 74.00
PRD 79 2.78 0.54 1.58 5.05
DRD 82 2.65 0.53 1.36 4.74
MRD 73 2.99 0.52 1.90 4.42
MLD 82 1.53 0.40 0.69 2.93
MLD1 66 1.61 0.40 0.79 2.75
IRD 80 2.72 0.53 1.40 4.80
Area 66 4.08 2.12 0.92 11.41
% DS = percentage of diameter stenosis; PRD, DRD, and MRD = proximal, distal and maximal reference diameters; MLD, MLD1 = minimal lumen diameter, at the site of greatest obstruction, obtained in different orthogonal views. IRD = interpolated reference diameter; Area = cross-sectional area, at the site of greatest obstruction, calculated in mm2; n = number of arteries; SD = standard
deviation; Variation = minimum and maximum values. Diameters measured in mm
Intravascular ultrasound – Forty-six arteries (43.8%) were studied, one per patient; mean minimal lumen area (MLA) was 2.92 mm2 (SD 1.54), mean minimal lumen diameter (MLD) was 1.68 mm (SD 0.43), and mean cross-sectional area of lumen obstruction (% CSA) was 61.20% (SD 14.31) (Table III).
Table III – Quantitative variables obtained by IVUS
Variables n Mean SD Minimum Maximum
RLA Px * 40 7.01 3.00 2.80 17.40
MLA 46 2.92 1.54 0.96 7.30
MLD 46 1.68 0.43 0.99 2.70
RLA Dx * 46 7.11 3.31 2.90 17.00
% Area obstruction 40 61.20 14.31 36.40 81.62
RLA Px = proximal reference lumen area, in mm2; MLA = minimal
lumen area at the site of greatest obstruction, in mm2; MLD = minimal
lumen diameter at lesion site, in mm2; RLA Dx = distal reference
lumen area, in mm2; * Calculated at non-ostial lesions
Resting electrocardiogram – Up to three diagnoses were considered per patient, and normal morphology was found in 36 patients (51.4%), borderline PR interval (≥ 200 ms) in 7 (10%), atrial fi brillation in 1 (1.4%), anterior myocardial infarction in 4 (5.7%), inferior in 3 (4.2%) and intraventricular conduction disturbance in 6 (8.4%).
Clinical manifestations – Sixty-seven patients (95.7%) had side effects related to adenosine injection, and chest pressure or chest pain experienced by 37 patients (52.9%) during the pharmacological test was not associated with diameter stenosis percentage by visual angiography, nor with minimal lumen diameters and areas established by QCA and IVUS (p>0.05).
Ischemic response – Of 68 patients (97.1%) with adequate records for analysis, 21 (30.9%) had ischemic response and 47 (69.1%), no ST-segment depression during adenosine injection. Comparing the presence versus absence of ST-segment changes on the
12-lead ECG, a difference between mean percentage of stenosis was noted (55% SD 15.6 vs. 47.8% SD 12.2 respectively, p<0.05).
Qualitative analysis of perfusion images – Findings of normal uptake in 34 patients (48.6%) and changes in uptake of any nature in 35 (50%) were different relative to % CSA obtained by IVUS, mean 50.4% (SD 19.4) and 61.9% (SD 12.6), respectively (p<0.05). The other variables did not differ by Student’s t test (p>0.05). As to presence of ischemia, there was also an association between reversible reduced uptake by myocardial scintigraphy, and IVUS determined higher mean of % CSA values. Means and standard deviations were 50.6% (SD 18.1) for non-ischemic results on myocardial perfusion scintigraphy and 63.7% (SD 12.6) for ischemic results. (fi gs. 1 e 2).
Wall motion and thickening – No abnormal wall motion was associated with higher degrees of arterial lumen obstruction (p>0.05). However, qualitative evaluation of wall thickening showed a signifi cant difference in mean comparison relative to %CSA by IVUS. Means were 45.2% (SD 30.3) for normal responses and 62.1% (SD 16.4) for any thickness change (P<0.05).
Overall results of myocardial scintigraphy associated with adenosine – Taking into account all clinical and electrocardiographic responses, as well as scintigraphic results, a dichotomous variable was created to express altered versus normal results and another for ischemic versus non-ischemic results. Signifi cant difference was found when MLA means by IVUS were compared, relative to altered (2.81 mm2 SD 1.40) versus normal results (4.08 mm2 DP 1.89). Additionally, MLD and MLA mean values by QCA were 1.49 mm (SD 0.34) and 3.74 mm2 (SD 1.78) for ischemic tests, and 1.71 mm (SD 0.49) and 5.00 mm2 (DP 2.65), respectively, for non-ischemic tests, with p<0.05. Likewise, overall ischemic results were associated with lower MLA and MLD mean values by IVUS (p<0.05). MLD and MLA were 1.63 mm (SD 0.38) and 2.74 mm2 (SD 1.38), respectively, for ischemic tests and 1.97 mm (SD 0.50) and 4.01 mm2 (SD 1.79) for non-ischemic tests (p<0.05). These fi ndings are described in fi gures 3, 4, 5, and 6.
DISCUSSION
52,50 48,48
45,11 42,90
0 20 40 60 80
1,44 1,64
3,55 4,62
14,78 9,87
Angio Visual
0,33 0,44 1,66 2,42
% E % Est. DML(mm) Área (mm2)
Angiografia Quantitativa
Isquêmicos Não isquêmicos
26 P (37,68%) 43 P (62,31%)
12,74 10,59
6
3
0
(%) (mm/mm2)
DP
p = 0,063
p = 0,086
p = 0,237
p = 0,422
63,73
50,65
0 20 40 60 80
1,59 1,82
2,60 3,44
1,53 1,60 0,40 0,44
AO% DML (mm) AML (mm2)
Ultra-som Intracoronário
12,58 18,12
6
3
0 p = 0,020
(%) (mm/mm2)
Isquêmicos Não isquêmicos
16 P (44,44%) 20 P (55,55%)
DP
p = 0,121
p = 0,118
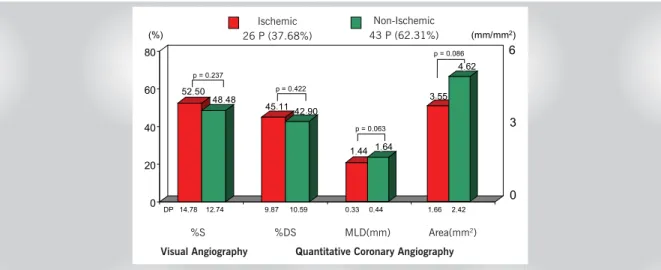
Fig. 1 – Perfusion imaging results, considering possible changes suggestive of ischemia and absence of transient reduced uptake. Comparison of variable means measured by angiographic visual and quantitative analysis. % S and % DS – Percentage of diameter stenosis by angiographic visual and quantitative analysis; MLD – minimal lumen diameter
Fig. 2 – Perfusion imaging results, considering possible ischemic changes and absence of transient reduced uptake. Comparison of variable means measured by IVUS; % CSA - cross-sectional lumen area at the site of greatest stenosis; MLD – minimal lumen diameter; MLA – minimal lumen area
Fig. 3 – Overall results categorized in altered and normal responses. Comparison of variable means by angiographic visual and quantitative analysis. % S and % DS - Percentage of diameter stenosis by angiographic visual and quantitative analysis; MLD – minimal lumen diameter
Ischemic 26 P (37.68%)
Non-Ischemic 43 P (62.31%)
.
. .
. . . .
. .
.
.
. .
. . .
%S %DS MLD(mm) Area(mm2)
Visual Angiography Quantitative Coronary Angiography
Ischemic 16 P (44.44%)
Non-Ischemic 20 P (55.55%)
Intravascular Ultrasound
%CSA MLD(mm) MLA(mm2)
.
.
.
.
. .
.
. .
. . .
. .
.
p = 0.169
p = 0.695
p = 0.871
50 50
42.4646.56
0 20 40 60 80
1.561.60
4.154.26
14.68 9.19
AngioVisual
0.44 0.33 2.36 1.73
% S % DS MLD(mm) Area (mm2)
Angiografia Quantitativa
11.21 7.59
6
3
0
(%) (mm/mm2)
DP
Visual
2)
Angiografia Quantitativa
Normal
53 P (75.71%)Altered 17 P (24.28%)
6
3
0 6
3
0
(%) (mm/mm2)
(%) (mm/mm2)
DP
50,98 48,13
43,68 43,36
0 20 40 60 80
1,49 1,71
3,74 5,00
13,73 9,35
Angio Visual
0,34 0,49 1,78 2,65
% E % Est. DML(mm) Área (mm2)
Angiografia Quantitativa
Não isquêmicos Isquêmicos
46 (65,7%) 24 (34,3%)
13,09 12,38
6
3
0
(%) (mm/mm2)
DP
p = 0,049
p = 0,048
p = 0,907 p = 0,405
62,72 54,05
0 20 40 60 80
1,63 1,97
2,74 4,01
1,38 1,79 0,38 0,50
AO% DML (mm) AML (mm2)
Ultra-som Intracoronário
12,83 11,26
6
3
0 p = 0,032
(%) (mm/mm2)
Isquêmicos Não isquêmicos
27 (72,9%) 10 (27,1%)
DP
p = 0,027
p = 0,103
Fig. 4 – Overall results categorized in altered and normal responses. Comparison of varible means measured by IVUS. % CSA - cross-sectional lumen area at the site of greatest stenosis; MLD – minimal lumen diameter; MLA – minimal lumen area
Fig. 5 – Overall results considering combined analysis of clinical manifestations, electrocardiographic responses, and scintigraphic images, categorized in ischemic and non-ischemic responses. Comparison of variable means measured by angiographic visual and quantitative analysis. %S and %DS – Percentage of diameter stenosis by angiographic visual and quantitative analysis; MLD – minimal lumen diameter; Area – cross-sectional lumen area by QCA at the site of greatest obstruction
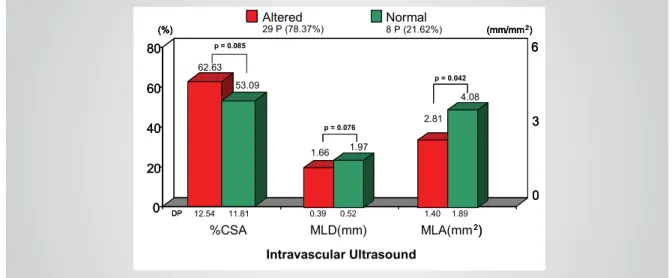
Fig. 6 – Overall results considereing combined analysis of clinical manifestations, electrocardiographic responses, and scintigraphic images, categorized in ischemic and non-ischemic responses. Comparison of variable means by IVUS. %CSA - cross-sectional lumen area at the site of greatest stenosis; MLD – minimal lumen diameter; MLA – minimal lumen area
62.63 53.09
0 20 40 60 80
1.66 1.97
2.81 4.08
1.40 1.89 0.39 0.52
%CSA MLD(mm) MLA(mm2) 12.54 11.81
6
3
0
(%) Altered29 P (78.37%) Normal8 P (21.62%) (mm/mm2)
DP
Intravascular Ultrasound
p = 0.085
p = 0.076
p = 0.042
0 20 40 60 80
2)
6
3
0
(%) (mm/mm2)
DP
0 20 40 60 80
2)
6
3
0 6
3
0
(%) (mm/mm2)
(%) (mm/mm2)
DP
Ischemic 46 P (65.7%)
Non-Ischemic 24 P (34.3%)
Visual Angiography Quantitative Coronary Angiography
%S %DS MLD(mm) Area(mm2)
.
.
.
. .
.
. .
. . .
. .
. .
.
Ischemic 27 (72.9%)
Non-Ischemic 10 (27.1%)
Intravascular Ultrasound
%CSA MLD(mm) MLA(mm2)
.
.
.
.
. .
. .
.
limitations, improve fi nal image quality and decrease persistent clinical manifestations, patients underwent treadmill walking with low energy expenditure after adenosine administration, contrary to information found in literature, where treadmill walking was added during adenosine injection30-32.
With respect to ongoing medication, it is worth noting the recommendation for beta-blocker and nitrate discontinuation, which is not included in national10 or foreign guidelines33. We believe that discontinuation of beta-blockers and nitrates for at least 24 to 48 hours is desirable, because pharmacological stimulation is followed by a slight yet signifi cant increase in double product34, which could be limited in the presence of the drug, in addition to the negative dromotropic effects of adenosine on the atrioventricular node, already present during beta-blocker therapy. Orientation towards vasodilator discontinuation on the day of the test was also important to reduce false-negative results and allow an accurate estimate of myocardial areas at risk, usually underestimated in patients with chronic use of vasodilators 35,36.
Chest pain and electrocardiographic ischemic changes during pharmacological stimulation - The high prevalence of side effects exceeded that of the series published in the literature (only 4.5% asymptomatic)37, with female and younger patients predominance, as in the series of Thomas et al32. In this initial experience, diffi culty in characterizing chest pain, discomfort or pressure, present in 53% of the cases, was evident. In our series, 24% of chest discomfort, pressure or pain was radiated to the anterior cervical region, which added to the thoracic location, amounted to 77%. Overall, little association is found between this side effect and coronary failure, with low specifi city, because normal volunteers also experience pain during intravenous drug infusion. A dose-effect relationship between adenosine and chest pain has been described38, suggesting that this substance causes chest pain during myocardial ischemia episodes, by direct stimulation of cardiac A1-receptors39.
Coincidentally, no association was made between pain manifestation during adenosine injection and higher degrees of stenosis of minimal lumen diameter or lower mean values of lumen area at the sites of greatest obstruction, or even of the cross-sectional area of lumen obstruction. Ischemic changes in ST-segment morphology observed in 21 patients (31%), the frequency of which was higher than those reported in classic studies (ranging from 8% to 25%), were associated with greater degrees of diameter stenosis percentage by visual analysis of angiographic images.
Analysis of scintigraphic images and overall results of the test – In the studied population, it became clear the great challenge faced by experts regarding decision making, since angiography by itself was inadequate to evaluating the functional impact of these lesions, ranging from 30 to 70%40,41and requiring further information from
invasive and non-invasive studies capable or estimating or measuring coronary fl ow reserve (CFR) under maximal hyperemia42,43.
Based on diagnostic and prognostic data provided by scintigraphic studies, established and related to each other, we decided to correlate Tc-99m-MIBI with adenosine injection with new patterns of comparison that would add value to standard angiography, allowing adequate functional correlation in evaluating ischemic phenomena.
We added, therefore, off-line quantitative analysis to the visual analysis of angiographic images, using established variables to characterize coronary obstruction, such as minimal lumen diameter and percentage of diameter stenosis44. Despite knowing that coronary artery diameter quantifi cation failed to elucidate the relationship between stenosis severity and impact on the coronary fl ow45, a condition assessed by myocardial scintigraphy in the indirect estimation of coronary fl ow reserve46, the signifi cance of measurements obtained by quantitative angiography was accepted as predictive of late events47,48. In the same way, coronary stenosis evaluation based on information provided by angiography and intracoronary Doppler, in patients with single-vessel disease assessed by exercise stress testing, showed, through logistic regression analysis, that percentage of diameter stenosis or MLD and coronary fl ow velocity reserve were predictive variables for exercise test results49.
Detection of clinical, electrocardiographic, and scintigraphic ischemia was considered relevant in our study, identifi ed either singly or grouply, since it is an important determinant of coronary events. At fi rst, a trend was observed towards associating images with reversible reduced uptake in 26 patients (37.68%) and lower mean values for MLD and MLA by QCA, comparing the 43 non-ischemic patients (62.31%) (MLD = 1.44 mm vs. 1.64 mm, p=0.063 and MLA = 3.55 mm2 vs. 4.62 mm2, p=0.086, respectively). Failure to obtain more statistically signifi cant difference was attributed to the very characteristics of our population, presenting mostly intermediate lesions and % SD around 44% on QCA. Likewise, the analysis of % CSA at the site of greatest obstruction by the same method yielded the mean of 4.08 mm2 (DP 2,12) in 66 arteries, showing normal response of coronary fl ow reserve (CRF) when isolated arterial lesions were evaluated50.
diagnostic performance of the test was associated with borderline anatomic data between normal and abnormal functional response translated by CFR, which was closely related to myocardial perfusion scintigraphy results, both at rest and under maximal hyperemic stimulation by pharmacological vasodilation. When chest pain and ST-segment depression were added to scintigraphic results, creating a dichotomous variable to express overall ischemic versus non-ischemic results, a better discriminatory capacity was found, with association of lower MLD and MLA means measured by QCA for the ischemic tests in 46 patients, as compared to those tests showing non-ischemic overall results in 24 patients (1.49 mm and 3.74 mm2 vs. 1.71 mm e 5.00 mm2, respectively, p<0.05).
When myocardial scintigraphy and IVUS fi ndings were compared51, the latter being used in this study for further evaluation of intermediate coronary lesions severity according to recently published Guidelines51, isolated results of perfusion and thickening images, expressed as dichotomous variables, were found to be signifi cantly associated with cross-sectional area of lumen obstruction (% CSA) only, when compared to any changes in perfusion versus normal uptake (63.73% vs. 50.65%, p=0.020), or to any changes in thickening versus normal thickening (62.08% vs. 45.18%, p=0.047). Such behavior is directly associated with changes of coronary fl ow reserve, triggered by moderate diameter stenosis yet corresponding to approximately 75% of the cross-sectional lumen area.
Studies performed after the classic demonstrations by Gould, Wilson et al52showed that CFR, measured using intracoronary Doppler catheters, was optimally correlated with cross-sectional area of stenosis, and that lesions less than 70% in area and diameter stenosis lower than 50% were associated with CFR greater than 3.5, data similar to that obtained in animal studies. Using these variables as discriminants for functional changes associated with hyperemia documented by scintigraphy, it called the attention the mean value approaching 60% for % CSA in those patients who underwent IVUS, somewhat corroborating the fi ndings of regular sensitivity and low specifi city53. Also emphasizing the clear and obvious discrepancy between anatomical and functional fi ndings, and recognizing the limitations imposed by angiography in defi ning lesions and how they affect coronary fl ow changes, myocardial perfusion scintigraphy has been used as a comparative method of invasive and non-invasive assessment of coronary fl ow reserve42,54 regarding anatomic variables obtained by IVUS and data derived from intracoronary Doppler studies55.
Worth noting in this context is the interesting study by Nishioka et al56, validating three indexes of stenosis derived from IVUS, as well as a minimal lumen area of 4 mm2, as criteria for signifi cant coronary narrowing using stress myocardial scintigraphy as benchmark.
Both the simplicity and high level of accuracy of MLA must be emphasized in the discriminatory value above mentioned, already established as predictive of late events and related to the determination of coronary fl ow reserve before and after percutaneous coronary intervention57. On the other hand, diagnostic performance of scintigraphy, when only images were analyzed, showed regular sensitivity and optimal negative predictive value (NPV), but restricted specifi city when the discriminatory limit of 70% was chosen for stenosis area percentage, whether in comparing mean values relative to any change in uptake versus normal uptake (Sensitivity = 75%; NPV = 86%; Specifi city = 55%) or in changes suggestive of ischemia versus non-ischemic uptake (Sensitivity = 75%; NPV = 88%; Specifi city = 64%). These indexes must also be understood in the context of the lesions that comprised our evaluated sample.
Based on these fi ndings, we also attempted to correlate the overall results of the test to some ultrasound variables, similar to what we did with QCA. Once pain manifestation and electrocardiographic changes were added to perfusion imaging fi ndings and overall results were categorized as altered or normal, different mean values were found for MLA on IVUS. Altered tests were correlated with MLA values of 2.81 mm2 (SD 1.40), whereas normal results were correlated with values of 4.08 mm2 (DP 1.89), p< 0.05. A trend towards different means for altered and normal results was also observed, for MLD and %CSA alike, both measured by IVUS (p=0.076 and p=0.085, respectively). When overall ischemic versus non-ischemic results were used, persistent reduced uptake excluded from the analysis, an association of ischemic tests with lower MLD and MLA measured by IVUS was found, compared to non-ischemic tests (1.63 mm and 2.74 mm2 x 1,97 mm and 4.01 mm2, p<0.05). It became obvious that the addition of clinical and ECG data to the images increased the correlation between presence of ischemia and values of those quantitative variables that translated into higher anatomic severity of lesions.
R
EFERENCES
1. Marwick TH, Shaw LJ, Lauer MS et al. The noninvasive prediction of cardiac mortality in men and women with known or suspected coronary artery disease. Economics of Noninvasive Diagnosis (END) Study Group. Am J Med 1999;106:172-8.
2. Hachamovitch R, Berman DS, Shaw LJ et al. Incremental prognostic value of myocardial perfusion single photon emission computed tomography for the prediction of cardiac death: differential stratifi cation for risk of cardiac death and myocardial infarction [Erratum in Circulation, v.98, n.2, p.190, 1998]. Circulation 1998;97:535-43.
3. Brown KA. Prognostic value of thallium-201 myocardial perfusion imaging. A diagnostic tool comes of age. Circulation 1991;83:363-81.
4. Eagle KA, Rihal CS, Mickel MC et al. J. Cardiac Risk of Noncardiac Surgery: Infl uence of Coronary Disease and Type of Surgery in 3368 Operations. CASS Investigators and University of Michigan Heart Care Program. Coronary Artery Surgery Study. Circulation 1997;96:1882-7.
5. Bateman TM, O’Keefe Jr JH, Dong VM et al. Coronary Angiographic Rates After Stress Single-Photon Emission Computed Tomographic Scintigraphy. J Nucl Cardiol 1995;2:217-23.
6. Miller TD, Christian TF, Hodge DO et al. Prognostic Value of Exercise Thallium-201 Imaging Performed Within 2 Years of Coronary Artery Bypass Graft Surgery. J Am Coll Cardiol 1998;31:848-54.
7. Lette J, Tatum JL, Fraser S, Miller DD et al. Safety of dipyridamole testing in 73,806 patients: the Multicenter Dipyridamole Safety Study. J Nucl Cardiol 1995;2:3-17.
8. Yock P, Nissen SE. Intravascular Ultrasound. Novel Pathophysiological Insights and Current Clinical Applications. Circulation 2001;103: 604-16.
9. Taillefer R, Lafl amme L, Dupras G et al. Myocardial perfusion imaging with99mTc-methoxi isobutyl isonitrile (MIBI): Comparison of short and
long time intervals between rest and stress injections. Eur J Nucl Med 1988;13:515-22.
10. Chalela W, Meneghetti C, Nicolau JC. Primeira Diretriz da Sociedade Brasileira de Cardiologia sobre Cardiologia Nuclear. Arq Bras Cardiol 2002;78:21-2.
11. Mason RE, Likar I. A new system of multiple lead exercise electrocardiography. Am Heart J 1966;71:196-205.
12. Meisner JS, Shirani J, Alaeddini J et al. Use of pharmaceuticals in noninvasive cardiovascular diagnosis. Heart Dis 2002;4:315-30.
13. Mastrocolla LE, Brito AX, Brito FS et al. Consenso Nacional de Ergometria. Arq Bras Cardiol 1995;65:189-211.
14. Andreoli TE, Bennett JC, Carpenter CCJ, Plum F. Evaluation of the may produce scintigraphic images with imperceptible
differences or approximate uptake when the corresponding regions are compared. Practical implication seems to be the limitation of the test in detecting lesions with 30% to 60% stenosis, a range that coincides with mean values of diameter stenosis percentage of our sample and with wide confi dence intervals, thus reducing method previsibility. Collateral circulation – It must be taken into account that coronary lesion is only one of the determinants of changes in coronary fl ow reserve under maximal hyperemia. Coronary collateral circulation and capillary network also play a key role in the genesis of reversible perfusion defects on scintigraphy induced by stress testing60. During stress, collateral vessels are usually insuffi cient for an adequate response to coronary fl ow increase associated to higher demands, resulting in frequent appearance of uptake defects. In pharmacological tests, participation of collaterals is mostly related to induction of the steal phenomenon that contributes to trigger myocardial ischemia, in addition to the non-homogeneous uptake of the radiopharmaceutical in areas affected or not with coronary lesion. Also worthy of attention in the studied sample was the presence of collateral circulation in only 6 patients (8.6%), in 5 of them (83.3%) this circulation was related to the occluded arteries and in only one (16.6%), to the intermediate lesion. Considering pharmacological vasodilation, such an angiographic profi le may certainly have contributed to further limit detection of ischemia by the method.
Accuracy determination and risk stratification – For more than a decade now myocardial perfusion scintigraphy has been used for risk assessment of subjects with suspected or known coronary artery disease, as well as for the development of strategies for clinical management3,61. Therefore, diagnostic defi nition should
not be separated from risk stratifi cation, because death rate of patients with ischemic scintigraphy of low risk is around 1% per year62. The decision to categorize results in dichotomous responses (normal versus altered or ischemic versus non-ischemic results) limited overall risk assessment, considering the severity of the disease and its infl uence on ventricular function, which were not evaluated in the present study. Moreover, this did not allow the association of changes in uptake on scintigraphic images with the respective areas of arterial distribution and, thus, failed to defi ne accuracy regarding affected vessels. However, the use of a new method with limited series, heterogeneous clinical characteristics and moderate complexity was somewhat justifi ed. Additionally, limitations related to image acquisition and processing, such as presence of artifacts from background radiation (liver) may have contributed to a potential decrease in method specifi city, because observers had no information on previous clinical and angiographic data. Neither prone imaging nor attenuation correction software was used to reduce these interferences.
patient with cardiovascular disease. In: Cecil (ed.) Essentials of Medicine. 4th ed. Philadelphia: WB Saunders, 1999.
15. Douglas PS, Ginsburg GS. The evaluation of chest pain in women. N Eng J Med 1996;334:1311-5.
16. Braunwald E. Examination of The Patient. In: Braunwald E, Zipes DP, Libby P. (ed.) Heart Disease. A Textbook of Cardiovascular Disease. 6th ed. Philadelphia: WB Saunders Company, 2001: 31-6.
17. Meneghelo RS. Avaliação da prescrição de exercícios pela cintilografi a miocárdica na reabilitação de pacientes com doença arterial coronária. São Paulo, 2000. Tese (Doutorado) – Faculdade de Medicina da Universidade de São Paulo.
18. Falcão AMGMF. Cintilografi a miocárdica em pacientes com bloqueio de ramo esquerdo, com e sem doença arterial coronária: estudo da perfusão e da função ventricular através do gated-SPECT. São Paulo, 2002. Tese (Doutorado) – Faculdade de Medicina da Universidade de São Paulo.
19. Wackers FJTH, Soufer R, Zaret B. Nuclear Cardiology. In: Braunwald E. Heart Disease. A Textbook of Cardiovascular Medicine. 5th ed. Philadelphia: W.B. Saunders Co., 1997: 279-87.
20. Hachamovitch R, Berman DS, Kiat H et al. Exercise Myocardial Perfusion SPECT in Patients Without Known Coronary Artery Disease: Incremental Prognostic Value and Use in Risk Stratifi cation. Circulation 1996;93:905-14.
21. Feres F, Sousa AGMR, Mattos LAP. Lesões coronárias: comparação das avaliações subjetiva e objetiva com a utilização do caliper. Arq Bras Cardiol 1988;51:79.
22. Braga SLN, Feres F, Sousa AGMR. Análise quantitativa de lesões coronárias pré e pós angioplastia: utilização do caliper. Arq Bras Cardiol 1988;51:129.
23. Alderman E, Stadius M. The angiographic defi nitions of the Bypass Angioplasty Revascularization Investigation. Coron Artery Dis 1992;3:1189-207.
24. Pinto IMF. Contribuição da tomografi a computadorizada de múltiplos detectores na avaliação tardia de endopróteses com sirolimus. São Paulo, 2002. Tese (Doutorado) – Faculdade de Medicina da Universidade de São Paulo.
25. Sousa AGMR. Contribuição da angiografia coronária quantitativa na estratégia de liberação ótima da endoprótese de Palmaz-Schatz para o controle da oclusão subaguda. São Paulo, 1995. 115p. Tese (Doutorado) – Faculdade de Medicina da Universidade de São Paulo.
26. Abizaid AAC. Contribuição do ultra-som intracoronário como método-guia para o implante ótimo do stent de Palmaz-Schatz em 1196 pacientes consecutivos:impacto na reestenose clínica. São Paulo, 2000. Tese (Doutorado) – Universidade Federal de São Paulo.
27. Chaves A, Mattos L, Pinto I et al. A less favorable long-term clinical outcome in diabetics persists despite treatment with intracoronary stents. J Am Coll Cardiol 2000;35:55.
28. Sundell J, Nuutila P, Laine H et al. Dose-dependent vasodilating effects of insulin on adenosine-stimulated myocardial blood fl ow. Diabetes 2002;51:1125-30.
29. Hendel RC, Berman DS, Cullon JS et al. Multicenter clinical trial to evaluate the effi cacy of correction for photon attenuation and scatter in SPECT myocardial perfusion imaging. Circulation 1999;99:2742-9.
30. Vitola JV. Infusão de dipiridamol e exercício físico combinados para a avaliação de pacientes submetidos à cintilografi a do miocárdio com 99m
Tc-MIBI. São Paulo, 2001. Tese (Doutorado) – Faculdade de Medicina da Universidade de São Paulo.
31. Samady H, Wackers FJT, Joska MS et al. Pharmacologic stress perfusion with adenosine: Role of simultaneous low level treadmill exercise. J Nucl Cardiol 2002;9:188-96.
32. Thomas GS, Prill NV, Majmundar H et al. Treadmill exercise during adenosine infusion is safe, results in fewer adverse reactions, and improves myocardial perfusion image quality. J Nucl Cardiol 2000;7:439-46.
33. De Puey EG. Up dated imaging guidelines for nuclear cardiology procedures. J Nucl Cardiology 2001;8:G3-G58.
34. Verani MS. Adenosine thallium-201 myocardial perfusion scintigraphy. Am Heart J 1991;122: 269-78.
35. Lewin HC, Hachamovitch R, Harris AG et al. Sustained reduction of exercise perfusion defect extent and severity with isosorbide mononitrate (Imdur) as demonstrated by means of technetium 99m sestamibi. J Am Coll Cardiol 2003;41:1125-33.
36. Bottcher M, Refsgaard J, Mette M et al. Effect of antianginal medication on resting myocardial perfusion and pharmacologically induced hyperemia. J Nucl Cardiol 2003;10:345-52.
37. Cerqueira MD, Verani MS, Schwaiger M et al. Safety profile of adenosine stress perfusion imaging. Results from The Adenoscan Multicenter Trial Registry. J Am Coll Cardiol 1994;23:384-9.
38. Sylen C, Jonzon B, Brandt R. Dose-effect relationship of adenosine provoked angina pectoris-like pain - a study of the psycho-physical power function. Eur Heart J 1988;9:87.
39. Crea F, Pupita G, Galassi AR. Role of the adenosine in pathogenesis of anginal pain. Circulation 1990;81:164.
40. Fearon WF, Yeung AC. Evaluating intermediate coronary lesions in the cardiac catheterization laboratory. Rev Cardiovasc Med 2003;4:1-7.
41. Bach RG; Kern M. Practical Coronary Physiology. Clinical application of the Doppler fl ow velocity guide wire. Cardiology Clinics 1997;15:77-99.
42. Miller DD, Donohue TJ, Younis LT. Correlation of pharmacological 99mTc
-sestamibi myocardial perfusion imaging with post stenotic coronary fl ow reserve in patients with intermediate coronary artery stenosis. Circulation 1994;89:2150-60.
43. Joye JD, Schulman DS, Lasorda D et al. Intracoronary Doppler guide wire versus stress single-photon emission computed tomographic thallium-201 imaging in assessment of intermediate coronary stenoses. J Am Coll Cardiol 1994;24:940-7.
44. Pinto IMF, Sousa AGMR, Feres F. Utilidade da angiografi a digital na realização da angioplastia coronária: análise de cem casos. Arq Bras Cardiol 1992;59:255-9.
45. Pinto IMF, Costa Jr JR, Moreira AC. Angiografi a coronária quantitativa. In: Sousa GMR, Staico R, Sousa JEMR. (ed.) Stent coronário. Aplicações clínicas. São Paulo: Atheneu, 2001, 65-75.
46. Mastrocolla LE, Martins LRF, Duarte PS, Smanio PEP. Medicina Nuclear. In: Araújo WB. (ed.) Métodos Não-invasivos: Diagnóstico e Conduta na Doença Coronariana. Rio de Janeiro: Ed. Revinter, 2002: 223-63.
47. Mancini GB, Bourassa MG, Willianson PR. Prognostic importance of quantitative analysis of coronary angiograms. Am J Cardiol 1992;69:1022-7.
48. Mack WJ, Xiang M, Selzer RH. Serial quantitative coronary angiography and coronary events. Am Heart J 2000;139:933-99.
49. Piek JJ, Boersma E, Di Mario C et al. Angiographical and Doppler fl ow-derived parameters for assessment of coronary lesion severity and its relation to the results of exercise electrocardiography. DEBATE study group. Doppler endpoints balloon angioplasty trial Europe. Eur Heart J 2000;21:466-74.
50. Harrison DG, White CW, Hiratzka LF et al. The value of cross-sectional area determined by quantitative coronary angiography in assessing the physiologic signifi cance of proximal left anterior descending coronary arterial stenoses. Circulation 1984;69:1111-9.
51. Abizaid AAC, Costantine C, Mattos LA et al. Diretriz de indicações do ultra-som intracoronariano na prática clínica. Arq Bras Cardiol 2003; 81(Supl II): 1-10.
53. Topol EJ, Nissen SE. Our preoccupation with coronary luminology: the dissociation between clinical and angiographic fi ndings in ischemic heart disease. Circulation 1995;92:2333-42.
54. Heller LI, Cates C, Popma J et al. Intracoronary Doppler assessment of moderate coronary artery disease: comparison 201TL imaging and coronar y angiography. FACTS Study Group. Circulation 1997;96:484-90.
55. Deychack YA, Segal J, Reiner JS et al. Doppler guide wire fl ow-velocity indexes measured distal to coronary stenoses associated with reversible thallium perfusion defects. Am Heart J 1995;129:219-27.
56. Nishioka T, Amanullah AM, Luo HUAI. Clinical validation of intravascular ultrasound imaging for assessment of coronary stenosis severity: Comparison with stress myocardial perfusion imaging. J Am Coll Cardiol 1999;33:1870-8.
57. Abizaid A, Mintz GS, Pichard AD et al. Clinical, intravascular ultrasound and quantitative angiographic determinants of the coronary
fl ow reserve: before and after percutaneous transluminal coronary angioplasty. Am J Cardiol 1998;82:423-8.
58. Glover DK, Okada RD. Myocardial kinetics of Tc-MIBI in canine myocardium after dipyridamole. Circulation 1990;81:628-37.
59. Glover DK, Beller GA, Cunninghan M. Comparison between 201Tl and 99mTc SESTAMIBI uptake during adenosine induced vasodilation as a function of coronary stenosis severity. Circulation 1995;91:813-20.
60. Sanjvi K. The role of capillaries in determining coronary blood fl ow reserve: Implications for stress- induced reversible perfusion defects. J Nucl Cardiol 2001;8:694-700.
61. Brown K. Prognostic value of myocardial perfusion imaging: state of art and new developments. J Nucl Cardiol 1996;3:516-37.